wTO: an R package for computing weighted topological overlap and
consensus networks with an integrated visualization tool
Deisy Morselli Gysi
1,2,*, Andre Voigt
3, Tiago Miranda Fragoso
4, Eivind Almaas
3,5, and
Katja Nowick
61
Department of Computer Science, Interdisciplinary Center of Bioinformatics, University of
Leipzig, Leipzig, D-04109, Leipzig.
2
Swarm Intelligence and Complex Systems Group, Faculty of Mathematics and Computer
Science, University of Leipzig, Leipzig, D-04109, Leipzig.
3
Department of Biotechnology, NTNU - Norwegian University of Science and Technology,
Trondheim, Norway.
4
Funda¸c˜
ao Cesgranrio, Rio de Janeiro, 20261-903, Brazil.
5
K.G. Jebsen Center for Genetic Epidemiology, NTNU - Norwegian University of Science
and Technology, Trondheim, Norway.
6
Human Biology Group, Institute for Biology, Department of Biology, Chemistry,
Pharmacy, Free University of Berlin, Konigin-Luise-Str. 1-3, D-14195 Berlin, Germany.
*
To whom correspondence should be addressed. [email protected]
November 15, 2017
Abstract
BackgroundGene co-expression network analyses have become a central approach for the systems-level analysis of biological data. Several software packages exist for generating and analyzing such networks, either from correlation scores or the absolute value of a transformed score called weighted topological over-lap (wT O). However, since some genes are able to up- or down-regulate other genes, it is important to explicitly consider both positive and negative correlations when constructing a gene co-expression network. Additionally, there has been a growing interest in the systematic comparison of multiple networks to identify deferentially changed links. Typically, such analyses are focused on the comparison of networks or data from two different conditions. Results Here, we present an R package for calculating the weighted topological overlap (wT O), that explicitly addresses the sign of wTO values. The package includes the calculation of p-values (raw and adjusted) for each pairwise gene score. Our package also allows the calculation of net-works from time series, without replicates. Additionally, our R package incorporates a novel method for calculating a consensus network (CN) from two or more networks. To visualize the resulting networks,
the R package contains a visualization tool which allows for the direct network manipulation and access of node and link information. When testing the package on a standard laptop computer, we can conduct all calculations for systems of 20,000 genes in under two hours. Conclusion In this work, we developed anR package that allows the computation ofwT O networks, CNs and a visualization tool in the R statis-tical environment. It is publicly available on CRAN repositories under the GPL−2 Open Source License (https://cran.r-project.org/web/packages/wTO/).
Keywords: Co-expression network,Network, Expression, R package, Software,Consensus Network,wTO.
Background
Recent applications of complex network analysis methods have provided important new knowledge of the functioning and interactions of genes at the systems level1;2;3;4. Within the area of biological network
analyses, co-expression networks have received much attention5;6. For the co-expression networks, a pair of
nodes are typically connected by a link if the genes they represent show a significantly correlated expression pattern. In the network, this link may be represented as a binary relationship, where 1 = “presence” and 0 = “absence” of the link, or alternatively, the link may have a numeric value (often called weight). The magnitude of the weight is often interpreted as representing the strength of a gene-pair relationship, and the sign as indicative of the type of associated gene interaction: positive if the genes are co-regulated, negative if they are oppositely controlled7.
In many implementations of network analyses, we may primarily be interested in an a priori defined subset of genes with a specific set of properties. Examples include transcription factors (TFs), genes with known orthologs in a set of organisms of interest, or disease genes 8;9. When the interest is focused on
a subset of all available genes, sometimes the choice is made to only take into account genes of interest in the network instead of including the full set of correlations, since the interest lies in a subset of genes. A major drawback with such an approach, is that relevant information contained in interaction patterns among excluded genes that would affect network topology and link strength values, is not incorporated in the network. The loss of such information is not only undesirable, but may also lead to biased results.
The approach of weighted topological (wT O) network analysis is a method that transforms the link weights for pairs of genes by averaging overallinteractions the pair of nodes share. Thus, wTO is a method that implicitly includes correlations among nodes that are going to be exempt from further analysis. The
wT O method10;11;12 can be used to determine the overlap among classes of transcripts, for example TFs
and non coding RNAs (ncRNAs). The resulting wTO network provides a more robust representation of the connections and interactions among the node-set of interest than a simple correlation network analysis focused only on the node-set of interest13. The package WGCNA14;15 is widely used for weighted gene
co-expression network analysis (WGCNA) studies. It provides functions for the calculation of the adjacency matrix for all pairs of genes as the nth power of absolute correlations, resulting in an unsigned network.
Network modules can be defined with this package by unsupervised clustering. Previously, Nowick and collaborators13 developed a mathematical method to calculate the wT O for a set of nodes that explicitly
When constructing severalwT Onetworks from independent data sets, the resulting networks’ topologies may be different16. These differences may arise from several sources: (A) technical differences, such as the
platform on which the expression data was measured, the facility where data was collected and prepared, or how data was processed. (B) Another cause may be biological differences from confounding factors, such as sex, age, and geographic origin of the individuals measured. It is thus desirable to obtain an integrated network that considers all independently derived networks as biological replicates and systematically iden-tifies their commonalities. We present here a novel method to compute the network that captures all this information; we call this the consensus network (CN).
Here, we present wTO, anR package capable of computing both signed and unsigned wTO networks as well as theCN, that comes with an integrated tool to visualize the resulting networks. The workflow of the package is shown in Fig. 1.
Implementation
Weighted Topological Overlap calculation
The representation of interactions between a set of nodes by thewT Omethod 10;11;12takes into account
the overall commonality of all the links a node has, instead of basing the analysis only on calculating raw correlations among the nodes. It thus provides a more comprehensive understanding of how two nodes are related. The use of the wT O method further reduces false effects coming from incorrectly assigned linked genes (false positives). Therefore, it is expected that awT Onetwork contains more robust information about the connections among nodes than what would result from simply taking direct correlations into account11;13.
ThewT Ocan be computed based on a similarity matrix, where the link weights are calculated using Pearson’s product moment correlation coefficient or the Spearman Rank correlation. The first one measures the linear relationship between two genes. Note that, the Pearson’s correlation coefficient is sensitive to extreme values, and therefore it can exaggerate or reduce the strength of a relationship. While, the Spearman Rank Correlation is recommended when data is monotonically correlated, skewed or ordinal, it is less sensitive to extreme outliers than the Pearson coefficient17;18;19;20.
To calculate the wT O 13, let i, j = 1, . . . , n be nodes that belong to the set of nodes of interest, u= 1, . . . , m all the nodes, including the ones in the set of interest, and the adjacency matrixA= [ai,j], defined
as
ai,j =
ρi,j i6=j
0 i=j.
(1)
withρbeing a correlation measure. Consequently, the wTO is defined as follows: Ω = wTO = [ωi,j], where
ωi,j=
Pn
u=1ai,uau,j+ai,j
min(|ki|,|kj|) + 1− |ai,j|
with
ki=
X
j
ai,j. (3)
Note that, this expression explicitly includes both positive and negative correlations, and thus allows for positive and negativewT Oi,j. This is not allowed using other implemented definitions of thewT Omethod,
making this new version especially valuable for gene regulatory networks.
Since Eq. (2) explicitly allows ai,j 60, we need to be aware of the limits of this expression: Consider
three nodes i, j and uand aij 6 0. All the terms in the denominator of Eq. (2) will be negative if also
aiuauj 60 for all nodes u. However, ifaiuauj >0, then contributions to the sum will cancel out. Similarly
for the case of aij ≥ 0. To systematically assess the potential effect of term cancellation in Eq. (2), we
calculate the absolute weighted topological overlap,|wT O|which uses the absolute value of the correlations (ai,j=|ai,j|) as input for Eq. (2) . In this case, the sign of the correlation is excluded from the analysis and
only the magnitude of the link-strength is taken into account. Consequently, by generating a scatter plot of the signed (wT O) and unsigned (|wT O|) versions of the weighted topological overlap, it is possible to assess at whichwT Oi,j term cancellations start affecting the results. Thus, the closer the plot ofwT O vs. |wT O|
is toy=|x|, the better.
Unfortunately, just by computing thewT Onetwork we do not get rid of all spurious correlations. A way to avoid them is to compute a probability of each one of the links being random or being zero. This can be easily computed by using 1. Bootstrap21or 2. Reshuffle13.
1. Bootstrapping the individuals, we allow the dependency inside the individuals to be constant, as a consequence we can calculate the empirical distribution of each one of the links, and based on that, estimate the probability that the observedwT Oij is approximately zero. The bootstrap is performed
to test the hypothesis that thewT O found in the real data is different than a zero, and thus, that the observed values carry reasonably small random noise. The hypotheses being tested with the Bootstrap are
H0:wT Oij = 0
Ha :wT Oij 6= 0
. (4)
One might also be interested in the use of blocked bootstrap resampling21, that can be used for
temporal data without sample replicates for each time point. This kind of resampling is necessary, once there are two correlation components in those samples: The correlation inside the factors of each sample and the correlation across the time of different samples. In this case, a time block, often also called lag, is required, this lag can be chosen using a partial correlation of the time per sample. Then thewT O is computed for a time series, where the observations are not independent of each other. 2. Reshuffling the expression values inside the individuals, we grant the dependency of the genes to be
A method for determining a Consensus Network
It is well known that co-expression networks vary much among different datasets (even if most conditions for obtaining the samples and data were the same). Thus, it is necessary for researchers to evaluate variability between such networks and to focus on their commonalities. This is an important step in co-expression network analysis that often is overlooked.
Berto and collaborators 16 described a Consensus Network from primates’ frontal lobes by applying a
Wilcoxon test on the links. This approach assumes that there are enough networks to be compared in two different groups. The usage our proposed methodology allows the minimum of two different wT O, containing only the significant links, to be combined into oneCN. This methodology also has the advantage of penalizing links with opposite signs. In the same direction, links with the same sign will have it’sCNi,j
value closer to the highestwT Oi,jof a link in thennetworks. Our first step is to remove nodes that doesn’t
exist in all networks, meaning that, if a node is absent in at least one network, we are not able to compute a consensus of the links that belong to that node.
In order to obtain one integratedwT Oderived from multiple independent network replicates, we calculate aCN using the function as follows:
Letk= 1, . . . , wbe the number of replicated networks, then Ω∗
A threshold can be used to remove links with values close to zero, that are the links in non-consensus.
Results and discussion
Package functions
The function wTO calculates the weights for all links according to Eq. (2) between a set of nodes for a given input data set. If the user is not interested in the resampling, he can simply run thiswT O function.
To test whether the calculated wT O is different from random expectation and to decide on a suitable threshold value for including link weights, we implemented the function wTO.Complete. Here, the wT O
is calculated a number of times n specified by the user, by either 1) Bootstrapping (method resampling
= ‘‘Bootstrap’’) the individuals, or for time series data (method resampling = ‘‘BlockBootstrap’’) or 2) Permuting the expression values for each individual (method resampling = ‘‘Reshuffle’’)13. The
default value of ∆ is set to 0.2. The user can specify the kind of correlation that the function should use, Pearson correlation is the default.
thRpackageparallel22.
The output of the wTO.Complete function has two outputs, a diagnosis set of plots and a list with the following results:
• $Correlationis a data.table containing the Pearson or Spearman correlations between all the nodes, not only the set of interest. The wT Olinks for the set of nodes of interest are based on these correla-tions. The default of this output is set to FALSE.
• $wTOis a data.table containing the nodes, thewT Ovalues (signed and unsigned), the p-values and the adjusted p-values computed using both signed and unsigned correlations.
• $Quantileis a table containing the empirical and “real” quantiles for: 0.1%, 2.5%, 10%, 90%, 97.5% and 99.9%. Those empirical values can be used as a threshold for the wT O values, when it is not desired to visualize low wT Ovalues.
The set of plots shows the quality of the resample, the closer the density of the resampled data is to the real data, the better. Another produced plot is the scatter plot of the wT O vs|wT O| values, previously described. The scatter plot of p-values against the wT O and |wT O| values is also plotted along with the suggested cut-offs using the empirical quantiles.
Computing theCN can be done using the functionwTO.Consensus, this function allows the user to give a list of networks in the format of data.frames with: Node 1, Node 2 and the link weight. The output here is a data.table containing the node’s names and the consensus weight.
OurRpackage also includes options to visualize the resulting networks. We have used a combination of the packagesnetwork23;24,igraph25andvisNetwork26to build the visualization capability. Here, the function NetVisgenerates a graph using as input a list of links and their corresponding weights. The analysis functions
wTO.CompleteandConsensusboth generate network data-structures (edge list) that can be visualized with this function. The user needs to choose a relevantwT O-threshold, orp-value cut-off, to select the set of links to be plotted. Additionally, the user may choose a layout for the network visualization from those available in the igraph25 package. By default, the wT O-threshold value is set to 0.5, and the network layout-style is set to layout nicely. The size of the nodes is relative to the degree of its node. An option allowed on this package is also to make clusters from the nodes. The MakeGroups parameter allows the user to choose clustering algorithms from: “walktrap”27, “optimal”28, “spinglass”29;30;31, “edge.betweenness’32;33,
‘fast greedy”34, “infomap’35;36, “louvain”37, “label prop’38and “leading eigen”39. All those algorithms are
implemented in theigraphpackage25. Nodes are colored according to the cluster they belong to. The width
of a link is relative to the wT Oi,j, and its color is relative to its sign (if a signed network was calculated).
Nodes can have different shapes, allowing for labeling of nodes of different classes, for example target genes or protein coding and non-protein coding genes.
The package provides a example dataset and an example of nodes of interest as well.
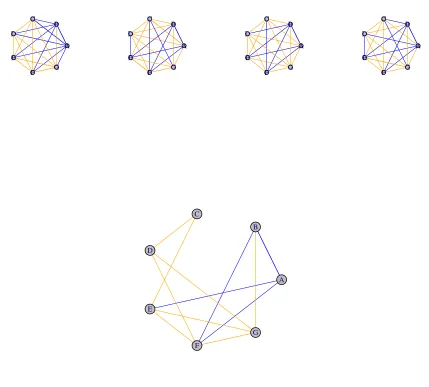
Consensus example
zero. When all links agree to the same or close value, the strength of the CN value is closer to the maximum value.
Stress Test
Normally, when running the wT O, the interest lies on a subset of nodes of interest. In Fig 2 we show the runtime for different network sizes, and different proportions of nodes of interest. Normally, running the
wT Ofor TF using the expressed genes, we have around 14% of nodes of interest. In a normal notebook, it’s possible to compute the wTO for a full network with 20,000 nodes in 20 miliseconds per link. It shows that is possible to compute the wTO easily for a full set of real gene expression networks.
Conclusion
The new wTO package allows the wT O network calculation for both positive and negative correlation, which is not provided in any other publishedRpackage. Our package computes p-values for each link based on its empirical distribution, which is another novel feature. This improvement to thewT O method permits the reduction of false positives. Our package also allows the computation of aCN, which allows integrating networks derived from different studies or datasets and focusing on links that consistently show in these networks. We also provide an interactive visualization tool that can be used to visualize both,wT Onetwork andCN.
Availability and requirements
R relies on the following packages: som40, plyr41, stringr42, network23;24, igraph25, visNetwork26, data.table43 and the standard packagesstats andparallel22. It is publicly available on CRAN repos-itories under the GPL-2 Open Source License https://cran.r-project.org/web/packages/wTO/. It is platform independent.
Declarations
Abbreviations
wTO: Weighted topological overlap;CN: Consensus Network;TF: Transcription Factor;lncRNA: long non coding RNA;miRNA: micro RNA.
Acknowledgements
Author’s contributions
DG implemented the code in R. DG and TM conceived the idea of p-values for the edges. KN and EA generalized the wT O for signed values. DG wrote the draft of manuscript. All authors discussed the manuscript, read and approved the final version of the manuscript.
Competing interests
The authors declare that they have no competing interests.
Consent for publication
Not applicable.
Ethics approval and consent to participate
Not applicable.
Funding
This work was supported partially by a doctoral grant from the Brazilian government’s Science without Borders program (GDE 204111/2014-5).
References
[1] A.-L. Barabasi and Z. N. Oltvai, “Network biology: understanding the cell’s functional organization,”
Nature Reviews Genetics, vol. 5, no. 2, pp. 101–113, 2004.
[2] M. Bansal, V. Belcastro, A. Ambesi-Impiombato, and D. Di Bernardo, “How to infer gene networks from expression profiles,”Molecular Systems Biology, vol. 3, no. 1, p. 78, 2007.
[3] L. I. Furlong, “Human diseases through the lens of network biology,” Trends in Genetics, vol. 29, no. 3, pp. 150–159, 2013.
[4] K. Dempsey, I. Thapa, C. Cortes, Z. Eriksen, D. K. Bastola, and H. Ali, “On mining biological signals using correlation networks,” in Data Mining Workshops (ICDMW), 2013 IEEE 13th International Conference on, pp. 327–334, IEEE, 2013.
[5] Y. Yang, L. Han, Y. Yuan, J. Li, N. Hei, and H. Liang, “Gene co-expression network analysis reveals common system-level properties of prognostic genes across cancer types,”Nature communications, vol. 5, p. 3231, 2014.
[6] I. W. Taylor, R. Linding, D. Warde-Farley, Y. Liu, C. Pesquita, D. Faria, S. Bull, T. Pawson, Q. Morris, and J. L. Wrana, “Dynamic modularity in protein interaction networks predicts breast cancer outcome,”
[7] S. van Dam, U. V˜osa, A. van der Graaf, L. Franke, and J. P. de Magalh˜aes, “Gene co-expression analysis for functional classification and gene–disease predictions,”Briefings in Bioinformatics, p. bbw139, 2017. [8] M. M. Babu, N. M. Luscombe, L. Aravind, M. Gerstein, and S. A. Teichmann, “Structure and evolution of transcriptional regulatory networks,”Current opinion in structural biology, vol. 14, no. 3, pp. 283–291, 2004.
[9] M. J. Mason, G. Fan, K. Plath, Q. Zhou, and S. Horvath, “Signed weighted gene co-expression network analysis of transcriptional regulation in murine embryonic stem cells,” BMC genomics, vol. 10, no. 1, p. 327, 2009.
[10] E. Ravasz, A. L. Somera, D. A. Mongru, Z. N. Oltvai, and A.-L. Barab´asi, “Hierarchical organization of modularity in metabolic networks,”Science, vol. 297, no. 5586, pp. 1551–1555, 2002.
[11] B. Zhang and S. Horvath, “A general framework for weighted gene co-expression network analysis.,”
Stat Appl Genet Mol Biol, vol. 4, p. Article17, 2005.
[12] M. R. Carlson, B. Zhang, Z. Fang, P. S. Mischel, S. Horvath, and S. F. Nelson, “Gene connectivity, function, and sequence conservation: predictions from modular yeast co-expression networks,” BMC Genomics, vol. 7, no. 1, p. 40, 2006.
[13] K. Nowick, T. Gernat, E. Almaas, and L. Stubbs, “Differences in human and chimpanzee gene expression patterns define an evolving network of transcription factors in brain,” Proceedings of the National Academy of Sciences, vol. 106, no. 52, pp. 22358–22363, 2009.
[14] P. Langfelder and S. Horvath, “Wgcna: an r package for weighted correlation network analysis,”BMC Bioinformatics, vol. 9, no. 1, p. 559, 2008.
[15] P. Langfelder and S. Horvath, “Fast R functions for robust correlations and hierarchical clustering,”
Journal of Statistical Software, vol. 46, no. 11, pp. 1–17, 2012.
[16] S. Berto, A. Perdomo-Sabogal, D. Gerighausen, J. Qin, and K. Nowick, “A consensus network of gene regulatory factors in the human frontal lobe,”Frontiers in Genetics, vol. 7, p. 31, 2016.
[17] D. G. Altman,Practical statistics for medical research. CRC press, 1990.
[18] E. McCrum-Gardner, “Which is the correct statistical test to use?,”British Journal of Oral and Max-illofacial Surgery, vol. 46, no. 1, pp. 38–41, 2008.
[19] M. Mukaka, “A guide to appropriate use of correlation coefficient in medical research,”Malawi Medical Journal, vol. 24, no. 3, pp. 69–71, 2012.
[20] A. J. Bishara and J. B. Hittner, “Testing the significance of a correlation with nonnormal data: compari-son of pearcompari-son, spearman, transformation, and resampling approaches.,”Psychological Methods, vol. 17, no. 3, p. 399, 2012.
[21] B. Efron and R. J. Tibshirani,An introduction to the bootstrap. CRC press, 1994.
[23] C. T. Butts, “network: a package for managing relational data in r.,” Journal of Statistical Software, vol. 24, no. 2, 2008.
[24] C. T. Butts,network: Classes for Relational Data. The Statnet Project (http://statnet.org), 2015. R package version 1.13.0.
[25] G. Csardi and T. Nepusz, “The igraph software package for complex network research,”InterJournal, Complex Systems, vol. 1695, no. 5, pp. 1–9, 2006.
[26] Almende B.V. and B. Thieurmel, visNetwork: Network Visualization using ’vis.js’ Library, 2016. R package version 1.0.3.
[27] P. Pons and M. Latapy, “Computing communities in large networks using random walks.,” J. Graph Algorithms Appl., vol. 10, no. 2, pp. 191–218, 2006.
[28] U. Brandes, D. Delling, M. Gaertler, R. Gorke, M. Hoefer, Z. Nikoloski, and D. Wagner, “On modularity clustering,”IEEE transactions on knowledge and data engineering, vol. 20, no. 2, pp. 172–188, 2008. [29] J. Reichardt and S. Bornholdt, “Statistical mechanics of community detection,” Physical Review E,
vol. 74, no. 1, p. 016110, 2006.
[30] M. E. Newman and M. Girvan, “Finding and evaluating community structure in networks,” Physical review E, vol. 69, no. 2, p. 026113, 2004.
[31] V. A. Traag and J. Bruggeman, “Community detection in networks with positive and negative links,”
Physical Review E, vol. 80, no. 3, p. 036115, 2009.
[32] L. C. Freeman, “Centrality in social networks conceptual clarification,” Social Networks, vol. 1, no. 3, pp. 215–239, 1978.
[33] U. Brandes, “A faster algorithm for betweenness centrality,”Journal of Mathematical Sociology, vol. 25, no. 2, pp. 163–177, 2001.
[34] A. Clauset, M. E. Newman, and C. Moore, “Finding community structure in very large networks,”
Physical review E, vol. 70, no. 6, p. 066111, 2004.
[35] M. Rosvall and C. Bergstrom, “Maps of information flow reveal community structure in complex net-works,”arXiv preprint physics.soc-ph/0707.0609, 2007.
[36] M. Rosvall, D. Axelsson, and C. T. Bergstrom, “The map equation,”The European Physical Journal-Special Topics, vol. 178, no. 1, pp. 13–23, 2009.
[37] V. D. Blondel, J.-L. Guillaume, R. Lambiotte, and E. Lefebvre, “Fast unfolding of communities in large networks,”Journal of statistical mechanics: theory and experiment, vol. 2008, no. 10, p. P10008, 2008. [38] U. N. Raghavan, R. Albert, and S. Kumara, “Near linear time algorithm to detect community structures
in large-scale networks,”Physical review E, vol. 76, no. 3, p. 036106, 2007.
[40] J. Yan,som: Self-Organizing Map, 2016. R package version 0.3-5.1.
[41] H. Wickham, “The split-apply-combine strategy for data analysis,” Journal of Statistical Software, vol. 40, no. 1, pp. 1–29, 2011.
[42] H. Wickham, “stringr: modern, consistent string processing,”The R Journal, vol. 2, no. 2, pp. 38–40, 2010.
[43] M. Dowle and A. Srinivasan,data.table: Extension of ‘data.frame‘, 2017. R package version 1.10.4.
Figures
Figure 1: The wTO package workflow. The wTO.Complete function takes as input a data set, in the data.frame format, with columns being the individuals, and the rows the measured variables (for example gene expression) and a vector of overlapping nodes (for example a set of transcription factor genes). The user has to set the resampling and the correlation methods. The resampling will be done for as many times as desired. The output of the function can be used to plot the network and to create theCN, using the
●
●