Received: 30 October 2009 / Accepted: 31 December 2009 / Published (online): 01 March 2010
Heart rate and motion analysis by GPS in beach soccer
Julen Castellano 1and David Casamichana 2
1
University of the Basque Country, 2 University of Malaga, Spain
Abstract
Although beach soccer has become increasingly popular in recent years very little scientific research has been conducted into the sport. A pilot study was carried out with the aim of examining the physiological (heart rate) and physical (motion analysis) responses of beach soccer players during competitive matches. Ten players (age 25.5 ±0.5 years; height 1.80 ± 0.08 m; weight 78.2 ±5.6 kg.) were studied over five beach soccer matches. The physiological demands were analysed by measur-ing heart rate (HR) usmeasur-ing telemetric devices, while the physical profile was evaluated by recording motion and speed by means of GPS devices. During competitive matches, players obtained a HRmean of 165.2 bpm (86.5% HRmax), with 59.3% of the time
participating (TP) corresponding to values above 90% of the HRmax. The distance covered per minute of participation was
97.7 m, with 9.5% of this distance corresponding to high-intensity running and 2.5% to sprint; the work:rest ratio was 1.4:1 and the maximum speed 21.7 km·h-1. These results showed that beach soccer is an intermittent physical activity of greater intensity than other team games. It requires a major contribution from the anaerobic system as emphasis is placed on players making quick bursts of high-intensity activity separated by brief rest periods.
Key words: Match, beach soccer, performance, motion analysis, heart rate.
Introduction
Beach soccer is one of the world’s fasting growing sports, particularly since FIFA began to promote and organise it through competitive matches, courses and other initiatives (http://www.fifa.com/aboutfifa/developing/beachsoccer/). The sport involves teams of five (four outfield players and a goalkeeper) with an unlimited number of substitutions, thus enabling play to be maintained at a high pace. Although the sport has been played in various recreational formats for several years now, it was not until 1992 that the rules of the game were established and a pilot tournament held in Los Angeles. The first profes-sional beach soccer matches were played the following year in Miami Beach, and in 1995 the first World Beach Soccer Championship was organised, with Brazil the winners. This was followed by the first Pro Beach Soccer Tour in 1996 and the setting up of the Beach Soccer Euro-league in 1998.
Due to its rapid growth and appeal the sport was incorporated into the FIFA structure in 2004 and the first Beach Soccer World Cup was held on Copacabana beach Brazil in 2005, with France beating Portugal in the final. Despite this growth in its popularity, lack scientific
re-search has been conducted into the sport and there are many aspects worthy of investigation (Scarfone et al., 2009).
In terms of the physical profile, and despite the fact that studies have been carried out with in different forms and levels of eleven-a-side soccer (Castagna et al., 2003; Di Salvo et al., 2007; Stroyer et al., 2004; Tessitore et al., 2005), soccer sevens (Capranica et al., 2001) and indoor soccer (Barbero et al., 2008) we have found no such re-search with respect to beach soccer. As regards the sport’s physiological profile there is only one study (Scarfone et al., 2009), although as it focused on a friendly match without substitutions we believe that the physiological profile under match conditions may differ from that re-ported by these authors, due mainly to the fact that unlim-ited substitutions are permitted in competitive matches.
Recent technological developments (Carling et al., 2008) permits highly detailed analysis of factors relating the physical match performance. The incorporation of GPS technology into sport has enabled the physical pro-file to be investigated in many sporting disciplines as it allows players to be monitored at the same time and im-proves the effectiveness of the analysis period (Aughey and Fallon, 2010). Several studies have evaluated these devices on team sport activities and have achieved ac-ceptable levels of accuracy and reliability (MacLeod et al., 2009) for most of the relevant measures in team sports that involve short demands and non-linear intermittent sprints. However, according to Coutts and Duffield (2010), they may offer poor reliability for high-intensity activities. This limitation may be of less relevance in the context of beach soccer as players can not run as high-intensities as in other forms of soccer, because a playing surface that does not enable such rapid movements as those attainable on other surfaces.
We believe that improving performance in a given sport requires specific training and that this is more effec-tive when the demands of the sport are known (Pereira et al., 2007). In this regard both physical and physiological analysis provide highly useful information to both the scientific and applied community (Drust et al., 2007). Knowing the distance covered or the range of speeds attained in doing so can help in planning training sessions and developing suitable training programmes to improve the specific physical condition of participants. In addition, this information can also be used to evaluate players’ performance (Barros et al., 2007).
The present pilot study aimed, in the context of Spanish official amateur beach soccer matches, to exam-ine two aspects: the physiological response through the telemetric recording of heart rate (HR) and the physical
Table 1. Beach soccer matches, periods, players, records and their duration. No. of
matches
No. of periods
No. of players
N. of records
Duration of each period
Total duration
of match TP
2 2 5 20 10 min 20 min 10.17 ± 1.38 2 2 5 20 12 min 24 min 12.27 ± 3.15 1 3 5 15 12 min 36 min 15.37 ± 3.47 Note: TP refers to the time participating of each player in minutes (min) and seconds ±standard deviation of each match.
response by means of GPS technology.
Methods
Participants
The study was conducted during the annual Spanish beach soccer championship held in July 2009. Although ten players took part in the matches studied only five of them (age 25.5 ± 0.5 years; height 1.80 ± 0.08 m; weight 78.2 ± 5.6 kg) were recorded (one out-and-out defender, two defenders who also went forward and two strikers who also dropped back). All the players were semi-professionals who competed in beach soccer tournaments at the end of their normal soccer season; they had an av-erage of ten years experience in the official eleven-a-side game, as well as experience in beach soccer. Each player was informed about the research design and the require-ments, benefits and risks of the study, and they all gave their informed consent prior to the start. In addition, the Ethics Committee at the University of the Basque Country gave institutional approval to this study, conforming to the Code of Ethics of the World Medical Association (Declaration of Helsinki).
The games studied consisted of two matches of two 10-min periods, two matches of two 12-min periods and one match of three 12-min periods, thus giving a total of 55 records. Each player’s contribution was considered in terms of the time participating (TP), defined as the time during which each participant was involved in play, i.e. any rest periods or time spent on the bench were ex-cluded. The data were expressed in relative terms accord-ing to the number of minutes duraccord-ing which the partici-pants were involved in play, thus enabling comparisons to be made both within and between matches. The TP values for each type of match are shown in Table 1.
Physiological variables: heart rate
The parameter used to evaluate the physiological compo-nent was HR, which was recorded at 5 s intervals during
each match using telemetric devices (Polar Team Sport System, Polar Electro Oy, Finland). The HR of the five participants was continuously recorded during all the matches. The HR monitors were also worn during the YYIRT1 (Bangsbo et al., 2008) in order to determine the maximum heart rate (HRmax) of each player (Krustrup et
al., 2003). This value was then used as a standard against which to define four intensity zones: <75%, 76–84%, 85– 89% and >90%HRmax. We quantified the percentage of
time spent within each intensity zone during the competi-tive matches, as well as the mean heart rate (HRmean) and
the HRmax reached in each match, expressed in both
abso-lute values (beats per min: bpm) and relative values (per-centage of maximum heart rate [%HRmax] and mean heart
rate [%HRmean]).
Physical variables: speed and distance covered
The players’ movement during five competitive matches was measured using a portable GPS device (MinimaxX, Team Sports 2.0, Catapult Innovations). A continuous recording was made using these GPS devices at a sam-pling frequency of 5 Hz for the same five players during all the matches. For the data analysis five speed zones were established: stationary–walking (0–3.9 km·h-1),
jogging (4.0–6.9 km·h-1), quick running (7.0–12.9 km·h-1),
high-intensity running (13.0–17.9 km·h-1) and sprint (>18 km·h-1). The speed zones and movement categories cho-sen are similar to those used in other studies conducted in different sports (Barros et al., 2007; Di Salvo et al., 2007; Rampinini et al., 2007). However, given that the present study involves a playing surface that does not enable such rapid movements as those attainable on other surfaces (the maximum speed achieved by players did not exceed 21.7 km·h-1) the speed categories were adapted accordingly. The physical variables studied were: total distance cov-ered in the TP (when the player is on the pitch), the maxi-mum speed, the percentage of distance covered in each one of the speed categories, the work:rest ratio (estimated using the distance covered at a speed of 0–3.9 km·h-1
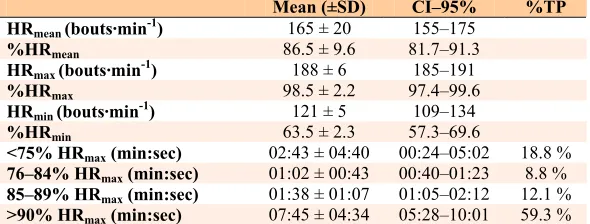
Table 2. Absolute and relative values of heart rate for all the players (5) and matches (11 measurements for each participant): mean, standard deviation (±SD) and confidence interval (CI–95%) with respect to the time of participation (TP), as well as the temporal distribution in the different intensity zones.
Mean (±SD) CI–95% %TP
HRmean (bouts·min-1) 165 ± 20 155–175
%HRmean 86.5 ± 9.6 81.7–91.3
HRmax (bouts·min-1) 188 ± 6 185–191
%HRmax 98.5 ± 2.2 97.4–99.6
HRmin (bouts·min-1) 121 ± 5 109–134
%HRmin 63.5 ± 2.3 57.3–69.6
<75% HRmax (min:sec) 02:43 ± 04:40 00:24–05:02 18.8 %
76–84% HRmax (min:sec) 01:02 ± 00:43 00:40–01:23 8.8 %
85–89% HRmax (min:sec) 01:38 ± 01:07 01:05–02:12 12.1 %
>90% HRmax (min:sec) 07:45 ± 04:34 05:28–10:01 59.3 %
Note. HRmax is the maximum heart rate, HRmean is the mean heart rate and HRmin is
Table 3. Time participating and distribution of time according to running intensity: mean, standar deviation (± SD) and confidence interval (CI-95%). Percentage of distance covered in each speed category for all the players consid-ering only their time participating (TP) (n = 55 measurements).
Mean (±SD) CI–95% %TP
Time participating (min:sec) 11:48 ± 3:05 10:28–13:09
Maximum speed (km·h-1) 21.67 ± 4.5 19.7–23.6
Stationary-walking (min:sec) 5:17 ± 2:23 4:17–06:18 43.67 %
jogging (min:sec) 3:04 ± 0:43 2:46–03:23 26.50 %
Quick running (min:sec) 2:25 ± 0:49 2:14–02:56 22.79 %
High-intensity running (min:sec) 0:26 ± 0:11 0:21–00:31 3.79 %
Sprint (min:sec) 0:05 ± 0:05 0:03–00:07 0.87 %
Work:rest ratio 1.4 ± 0.6 1.1–1.6
as a ‘rest’ period, while all the categories with speeds above 4 km·h-1 were considered as ‘work’ or ‘activity’), and the effort rate at different intensities; the latter was expressed in absolute terms (TP), indicating the mean number of efforts made per match, and in relative terms as each minute of participation (MP). The typical error expressed as a coefficient of variation (CV) (Hopkins, 2000) was 4.6% for total distance, 7.6% for stationary– walking (0–3.9 km·h-1), 4.6% for jogging (4.0–6.9 km·h
-1
), 6.5% for quick running (7.0–12.9 km·h-1), 8.9% for
high-intensity running (13.0–17.9 km·h-1) and 18.9% for
sprint (>18 km·h-1). The CV for peak speeds was 4.4%.
Statistical analysis
Due to the nature of the study and the small sample the data are mainly presented in descriptive terms, using means, standard deviations (±SD) and the 95% confi-dence interval (CI-95%). All the statistical analyses were performed using SPSS16.0 for Windows (SPSS Inc, Chi-cago, USA).
Results
Physiological response
Table 2 shows the physiological characteristics associated with the mean values obtained in the competitive beach soccer matches, the mean heart rate corresponding to 86.5% of the HRmax; the maximum values obtained during
the matches reached 98.5% of the HRmax. With regard to
the percentage of time corresponding to each intensity zone, it can be seen that the category >90% HRmax
ac-counts for the largest time percentage, while the least amount of time corresponded to 75–84% of the HRmax.
Physical response
During the mean time of 11.48 min played by each player in each match (TP) the distribution of running speeds is as shown in Table 3. The maximum speeds attained were less than 22 km·h-1. For almost half the time (43.7%)
players were stationary or walking, while around a quarter of the time (26.5%) they were engaged in jogging. Around 30 s were spent on high-intensity running or sprints.
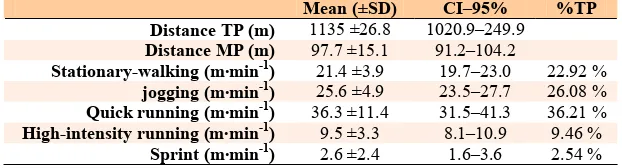
As regards their movement, players covered a total distance of 1135 ± 26.8 m during their TP, with a relative distance of 97.7 ± 15.1 m per min (m·min-1) in the MP. The distribution of distances covered at different intensi-ties is shown in Table 4. As can be seen the categories
quick running (7.0–12.9 km·h-1) and jogging (4.0–6.9 km·h-1) are those in which players cover the most dis-tance.
The number of efforts corresponding to each player also follows a particular distribution. Table 5 presents these values in the TP (absolute) and MP (relative or per min) for the matches analysed.
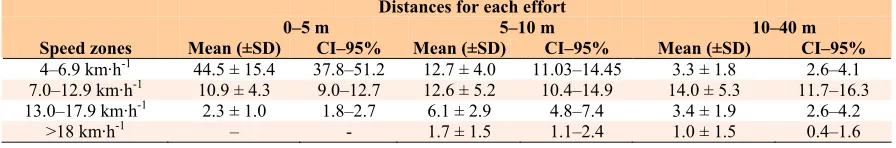
Table 6 presents the effort rate according to the speed categories and the distances covered, showing that the latter differs as a function of the former. It can be seen that efforts in which a player covers more than 5 m are the most common in the categories of highest intensity.
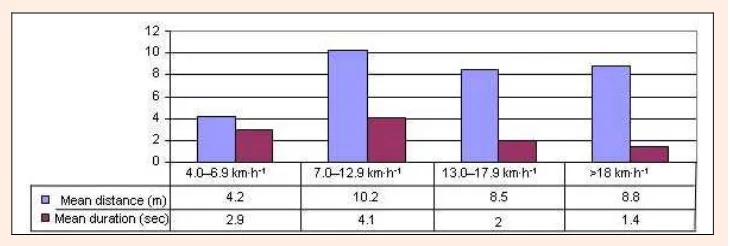
Figure 1 shows the mean distance and duration of efforts during the competitive matches for each speed category, showing that the longest mean distance and the longest mean duration were both achieved in the quick running category (7.0–12.9 km·h-1).
Discussion
This study aimed to examine the physical and physiologi-cal response of players during several matches of an ama-teur beach soccer tournament.
To the best of our knowledge only one study (Scar-fone et al., 2009) has recorded the physiological profile of beach soccer players, although this was during a friendly in which all the players played three periods of a full twelve minutes. This differs from competitive matches in which unlimited substitutions are allowed, a ruling that the teams usually take advantage of in order to get the
Table 4. Absolute and relative distances covered and distances in relation to the running intensity: mean, standard deviation (±SD) and confidence interval (CI-95%). Percentage of distance covered in each speed category for all the players considering only their time participating (TP) (n = 55 measurements).
Mean (±SD) CI–95% %TP
Distance TP (m) 1135 ±26.8 1020.9–249.9
Distance MP (m) 97.7 ±15.1 91.2–104.2
Stationary-walking (m·min-1) 21.4 ±3.9 19.7–23.0 22.92 %
jogging (m·min-1) 25.6 ±4.9 23.5–27.7 26.08 %
Quick running (m·min-1) 36.3 ±11.4 31.5–41.3 36.21 %
High-intensity running (m·min-1) 9.5 ±3.3 8.1–10.9 9.46 %
Table 5. Frequency of effort according to each movement category, expressed in absolute terms (TP) and relative terms (per min, MP); mean, standard deviation (±SD) and confidence interval (CI-95%) (n = 55 measurements).
Absolute (TP) Relative (MP)
Speed zones Mean (±SD) CI–95% Mean (±SD) CI–95%
4–6.9 km·h-1 60 ± 17.0 52.8–67.2 5.1 ± .7 4.8–5.4 7.0–12.9 km·h-1 37.6 ± 10.4 33.2–42.0 3.2 ± .6 2.9–3.5 13.0–17.9 km·h-1 11.7 ± 4.6 9.7–13.6 1.0 ± .3 0.9–1.1 >18 km·h-1 2.6 ± 2.1 1.7–3.5 .2 ± .2 0.1–0.3
most out of players at each point. For this reason the pre-sent results will be compared with those obtained in stud-ies of other forms of soccer (such as five-a-side) or other team sports (basketball or handball), which have similar characteristics in terms of dimensions, number of players involved and a rule allowing unlimited substitutions. As regards physiological intensity a high percentage of time corresponded to high-intensity zones (59.3% of time in the category >90% HRmax), this being consistent with
the findings of Scarfone et al. (2009). Both the HRmeanand
the percentages of time spent in each intensity zone show similar (although slightly lower) values to those obtained in studies of indoor soccer (Barbero et al., 2008; Castagna et al., 2009) and basketball (Matthew and Delextrat, 2009), where substitutions are also unlimited. Whereas in the case of indoor soccer and basketball the HRmean was
90% and 92.5% of the HRmax, respectively, with 83.2%
and 93.1% of time participating corresponding to values above 85% of the HRmax, the present study obtained a
HRmean of 86.5% of the HRmax, with 71.4% of time
par-ticipating being above 85% of the HRmax. In situations in
small-sided soccer games the HRmean ranges between 83%
and 90% of the HRmax in terms of different structural
variables of training such as the number of players par-ticipating in the task, the dimensions of space and the encouragement of coach (Hill-Haas et al., 2009; Katis and Kellis, 2009; Rampinini et al., 2007). However, it should be remembered that this comparison involves different modalities played by players of a different level on play-ing surfaces that are not always similar. This point needs to be underlined since for the same speed the energy ex-pended when running or walking on sand is greater (Pin-nington and Dawson, 2001; Zamparo et al., 1992). Cau-tion should therefore be exercised when interpreting the physiological and physical profile for activities played on this kind of surface.
With respect to the physical analysis it is worth noting that the mean distance covered per match in the TP was 1135 m. However, this distance is influenced by the length of time each player is on the pitch. Therefore, it cannot be used as an indicator of the players’ particular physical performance, as would be the case in standard soccer or rugby where the number of substitutions is lim-ited. As pointed out by Barbero et al. (2008), in sports that
allow unlimited substitutions the distance covered per minute (MP) is more representative of the general inten-sity of the activity performed and can be used as a global index of the match’s intensity. In our case this took a value of 97.7 m·min-1. This distance in MP is less than that reported by studies of indoor soccer players: 117.3 m·min-1 (Barbero et al., 2008) and 121 m·min-1 (Castagna et al., 2009), recorded using two-dimensional photo-grammetry, and 118 m·min-1 (Barbero & Castagna, 2007), recorded using similar GPS technology to that employed in the present study. The distance recorded in the present study is also less than that obtained in young Brazilian soccer players, who covered 118, 105 and 109 m·min-1 at the under-15, under-17 and under-19 levels, respectively (Pereira et al., 2007) and that reported for small-sided soccer games with different formats, with distances close to 107 m·min-1(Hill-Haas et al., 2009). In addition, it is less than the 100 m·min-1 reported for Spanish pre-adolescents (Barbero et al., 2007). Finally, it should be noted that the values obtained here are higher than those reported using GPS technology (83.7 m·min-1) with rugby players (Cunniffe et al., 2009).
As regards the maximum speed reached at specific points in the matches (21.7 km·h-1) it is important to men-tion the handicap imposed by the playing surface in beach soccer. Sand reduces the maximum force and the maxi-mum applied power, increasing the time of impact and impulse (Barrett et al., 1997; Giatsis et al., 2004). This type of surface absorbs part of the applied energy, reduc-ing the reaction force (Bishop, 2003), and this can lead to a lower maximum speed of movement due to the sand’s instability (Giatsis et al., 2004).
The work:rest ratio is a fairly general measure that provides information about the nature of the activity. In the present study its value of 1.4:1 (for every minute of ‘rest’ there are 1.4 minutes of ‘work’) reflects the inter-mittent nature of a very high-intensity sport. This figure is close to that obtained in indoor soccer (1:1), but differs considerably from the values reported for sports that do not allow unlimited substitutions: 1:5.7 in rugby (Cun-niffe et al., 2009) or 1:3.5 in young soccer players (Bar-bero et al., 2007).
With regard to the mean distances and durations of the different movement categories, the mean distance
Table 6. Frequencies according to distance covered and speed of the recorded efforts, the values showing the mean, standard deviation (±SD) and the confidence interval (CI-95%) (n = 55 measurements).
Distances for each effort
0–5 m 5–10 m 10–40 m
Speed zones Mean (±SD) CI–95% Mean (±SD) CI–95% Mean (±SD) CI–95%
4–6.9 km·h-1 44.5 ± 15.4 37.8–51.2 12.7 ± 4.0 11.03–14.45 3.3 ± 1.8 2.6–4.1 7.0–12.9 km·h-1 10.9 ± 4.3 9.0–12.7 12.6 ± 5.2 10.4–14.9 14.0 ± 5.3 11.7–16.3 13.0–17.9 km·h-1 2.3 ± 1.0 1.8–2.7 6.1 ± 2.9 4.8–7.4 3.4 ± 1.9 2.6–4.2
Figure 1. Mean distance and duration of efforts according to the speed categories.
covered during the highest intensity efforts was 8-10 m, while their duration was less than 2 s. This illustrates the importance in beach soccer of players being able to make quick bursts of acceleration, which is more relevant than the maximum speed reached since efforts are short in both duration and distance covered. As a result, players do not reach the maximum speed they would attain on other surfaces.
This study is the first to describe the time–motion characteristics in beach soccer. However, one limitation of the present study concerns the interpretation of the time-motion results, because the GPS units have been shown reliability at high-intensity running being relatively poor (Petersen et al., 2009).
Conclusion
It can be concluded that beach soccer is an intermittent sport of very high intensity whose physiological profile shows that more than half the time is spent at intensities above 90% of the HRmax, thus requiring large amounts of
energy via the anaerobic system (Scarfone et al., 2009). The distance covered per minute of play is around 100 m with a work:rest ratio of 1.4:1. The durations and dis-tances covered at high intensity are short but repeated, thus underlining the importance of players’ ability to make continuous bursts of acceleration. These data should be taken into account when proposing training protocols in this mode, prioritizing actions intermittent high inten-sity and short duration with breaks lasting less working time.
As this study is descriptive in nature and only in-cludes a small number of subjects and matches it does not address certain important aspects such as variations pro-duced by fatigue over successive matches or the level of individual players. Furthermore, given the small sample size it did not seem appropriate to focus on the specific playing positions. However, we believe that this should be done in future research as studies of other sports have shown how the physical demands of each position vary (Di Salvo et al., 2007; 2009). This more specific focus would increase our knowledge of beach soccer and help to improve training programmes by developing their de-gree of specificity. Only thus will it be possible to apply knowledge of the sport’s physical and physiological de-mands in a more detailed way.
Acknowledgments
This study is part of the project entitled Avances tecnológicos y meto-
dológicos en la automatización de estudios observacionales en deporte,
funded by Spain’s Dirección General de Investigación, Ministerio de Ciencia e Innovación (PSI2008-01179) over the period 2008-2011. The authors would also like to thank the University of the Basque Country and sports material company RANKING S. L. for providing the GPS
MinimaxX devices used in carrying out the study.
References
Aughey, R. and Fallon, C. (2010) Real-time versus post-game GPS data in team sports. Journal of Science and Medicine in Sport, in press.
Bangsbo, J., Iaia, M., and Krustrup, P. (2008) The yo-yo intermittent recovery test. A useful tool for evaluation of physical perform-ance in intermittent sports. Sports Medicine38, 37-51
Barbero, J. C., Soto, V. M., Barbero, V. and Granda, J. (2008) Match analysis and heart rate of futsal players during competition.
Journal of Sports Sciences 26, 63-73.
Barbero, J. C., Barbero, V. and Granda, J. (2007) Perfil de actividad durante el juego en futbolistas infantiles. Apunts. Educación Física y Deportes 4, 33-41.
Barbero, J. C. and Castagna, C. (2007) Activity patterns in professional futsal players using global position tracking system. Journalof
Sports Science and Medicine 6, 208-209.
Barrett, R., Neal, R. and Roberts, L. (1997) The dynamic loading re-sponse of surfaces encountered in beach running. Journal of Science and Medicine in Sport 1, 1-11.
Barros, R.M.L., Misuta, M.S., Menezes, R.P., Figueroa, P.J., Moura, F.A., Cunha, S.A., Anido R. and Leite, N.J. (2007) Analysis of the distance covered by the first division Brazilian soccer play-ers obtained with an automatic tracking method. Journal of
Sports Science and Medicine 6, 233-242.
Bishop, D. (2003) A comparison between land and sand-based tests for beach volleyball assessment. Journal of Sports Medicine and Physical Fitness 43, 418-423.
Capranica, L., Tessitore, A., Guidetti, L. and Figura, F. (2001) Heart rate and match analysis in pre-pubescent soccer players. Journal of Sports Sciences 19, 379- 384.
Carling, C., Bloomfield, J., Nelsen, L. and Reilly, T. (2008) The role of motion analysis in elite soccer: contemporary performance measurement techniques and work rate data. Sport Medicine 38,
839-862.
Castagna, C., D’Ottavio, S. and Abt, G. (2003) Activity profile of young soccer players during actual match play. Journal of Strength
and Conditioning Research 17, 775-780.
Castagna, C., D’Ottavio, S., Granda, J. and Barbero, J. C. (2009) Match demands of professional Futsal: a case study. Journal of Science
and Medicine in Sport 12, 490-494.
Coutts, A. and Duffield, R. (2010) Validity and reliability of GPS de-vices for measuring movement demands of team sports. Journal
of Science and Medicine in Sport13, 133-135.
Cunniffe, B., Proctor, W., Baker, J. and Davies, B. (2009) An evaluation of the physiological demands of elite rugby union using global positioning system tracking software. Journal of Strength and
Conditioning Research 23, 1195-1203.
Di Salvo, W., Baron, R., Tschan, H., Calferon, F. J., Bachi, N. and Pigozzi, F. (2007) Performance characteristics according to playing position in elite soccer. International Journal of
SportsMedicine 28, 222-227.
(2009) Analysis of high intensity activity in premier league soc-cer. InternationalJournal of Sports Medicine30, 205-212. Drust, B., Atkinson, G. and Reilly, T. (2007) Future perspectives in the
evaluation of the physiological demands of soccer. Sports Medicine 37, 783-805.
Giatsis, G., Kollias, I., Panoutsakopoulos, V. and Papaiakovou, G. (2004) Biomechanical differences in elite beach-volleyball players in vertical squat jump on rigid and sand surface. Sports Biomechanics 3, 145-158.
Hill–Haas, S., Dawson, B., Coutts, A. and Rowsell, G. (2009) Physio-logical responses and time–motion characteristics of various small–sided soccer games in youth players. Journal of Sports Sciences27, 1–8.
Hopkins, W. G. (2000) Measures of reliability in sports medicine and science. Sports Medicine30, 1–15.
Katis, A. and Kellis, E. (2009) Effects of small-sided games on physical conditioning and performance in young soccer players. Journal
of Sports Science and Medicine 8, 374-380.
Krustrup, P., et al. (2003). The Yo–Yo Intermittent Recovery Test: Physiological Response, Reliability, and Validity. Medicine and
Science in Sports and Exercise 35, 697-705.
MacLeod, H., Morris, J., Nevill, A. and Sunderland, C. (2009) The validity of a non- differential global positioning system for as-sessing player movement patterns in field hockey. Journal of Sports Sciences 27, 121-128.
Matthew, D. and Delextrat, A. (2009) Heart rate, blood lactate concen-tration, and time-motion analysis of female basketball players during competition. Journal of Sports Sciences 27, 813-821. Pereira, N., Kirkendall, D. T. and Barros, T. L. (2007) Movement
pat-terns in elite Brazilian youth soccer. Journal of Sports Medicine and Physical Fitness 47, 270-275.
Petersen, C., Pyne, D., Portus, M. and Dawson, B. (2009) Validity and Reliability of GPS Units to Monitor Cricket-Specific Movement Patterns. International Journal of Sports Physiology and Per-formance 4, 381-393.
Pinnington, H. C. and Dawson, B. (2001) Running economy of elite surf iron men and male runners, on soft dry beach sand and grass.
European Journal of Applied Physiology 86, 62-70.
Rampinini, E., Coutts, A., Castagna, C., Sassi, R. and Impellizzeri, F.M. (2007) Variation in top level soccer match performance.
Inter-national Journal of Sports Medicine 28, 1018-1024.
Rampinini, E., Impellizzeri, F.M., Castagna, C., Abt, G., Chamari, K., Sassi, A. and Marcora, S.M. (2007) Factors influencing physio-logical responses to small-sided soccer games. Journal of Sports Sciences 25, 659-666.
Scarfone, R., Tessitore, A., Minganti, C., Ferrragina, A., Capranica, L. and Ammendolia, A. (2009) Match demands of beach soccer: a case study. In: Book of abstracts of 14th Annual Congress of the
European College of Sport Science. July 24-29, Oslo-Norway.
54.
Stroyer, J., Hansen, L. and Klausen, K. (2004) Physiological Profile and Activity Pattern of Young Soccer Players during Match Play.
Medicine and Science in Sports and Exercise 36, 168-174.
Tesittore, A., Meeusen, R., Tiberi, M., Cortis, C., Pagano, R. and Capranica, L. (2005) Aerobic and anaerobic profiles, heart rate and match analysis in older soccer players. Ergonomics 48, 1365-1377.
Zamparo, P., Perini, R., Orizio, C., Sacher, M. and Ferretti, G. (1992) The energy cost of walking or running on sand. European Jour-nal of Applied Physiology 65, 183-187.
Key points
• The distance covered per minute of play is around 100 m.
• Beach soccer is an intermittent sport with a
work:rest ratio of 1.4:1.
• The playing surface in beach soccer is an important handicap to obtain maximum speeds.
• Beach soccer has a high physiological intensity, with more than half of the game is spent at intensi-ties above 90 % of the HRmax.
AUTHORS BIOGRAPHY
Julen CASTELLANO Employment
Professor at Basque Country University (UPV-EHU), Spain
Degree
PhD
Research interests
Performance analysis in team sports; Methodology in Behavioural Sciences.
E-mail: [email protected]
David CASAMICHANA Employment
PhD Student, Málaga University (Spain)
Degree
MSc
Research interests
Physiological development in soccer athletes.
E-mail: [email protected]
Julen Castellano