FROM SAMPLE TO POPULATION: THE USE OF DOT PLOT TO SUPPORT
The need for statistically literate society brings the need to broaden the scope of statistics education beyond mere numbers, formulas and calculations. The students need to be able to comprehend the world around them statistically. The difficulty the students experience during inferential statistics becomes another problem to tackle. Therefore, a new topic called Informal Inferential Reasoning arises; centering around introducing inferential statistics in early education by focusing on informal aspects of it. A set of learning activities is designed through Realistic Mathematics Education (RME) approach to support 7th grade students in developing this reasoning. This paper describes a specific aspect of this study, which is the use of dot plots. Dot plots is a type of data representation that is rarely used in statistics education in Indonesia. However, existing researches have shown that dot plot is helpful to help students analyzing graph visually. Design research was used as the research approach. Six students of the 7th grade of Laboratory Junior High School of State University of Surabaya (SMP Lab UNESA) were involved in the teaching experiment. The results show that dot plots do help students to see data as an aggregate by visually exhibiting the characteristics of the data set, thus helping the students when comparing sample to population or vice versa; a process that is an inherent part of informal inferential statistics.
Keywords: informal inferential statistics, dot plots, realistic mathematics education,
design research.
INTRODUCTION
One of the topics in Statistics proven to be difficult for students to learn is inferential statistic. In most countries, including Indonesia, students in elementary and secondary education are only exposed to descriptive statistics which rarely goes beyond computing average and interpreting graphs, while inferential statistics is only introduced in tertiary level (Makar & Rubin, 2009; Rossman, 2008). The separation between these two broad categories of statistics, namely descriptive and inferential, is identified as the cause because the students are found to be unable to link inferential statistics to the descriptive statistics they have learned in the previous education level. Aside from that, the procedure and algorithm oriented way statistics being introduced to students also encourage an overly deterministic sense about statistics, which leads to the difficulty in dealing with the probabilistic nature of inferential statistics (Zieffler, Garfield, Delmas, & Reading, 2008).
The solution proposed to deal with this problem is informally introducing inferential
statistics in the earlier stage of the students education, by focusing on the underpinning
aspects of it. This is known as informal inferential statistics (IIR).
Some studies already show promising result in developing IIR. Because IIR is something that develops very gradually, it is impossible to for students to completely possess it only by enrolling them in a few lesson (A. Bakker, personal communication, April 24, 2015). Bakker and Gravemeijer (2004) showed that 7th graders can develop the concept of distribution through informal ways of reasoning. Ben-Zvi, Gil, and Apel (2007) explored the possibilities of developing IIR for 6th grade by using data generator software. Both study noted that the students start to produce statements that address the elements of IIR. However, these researches are also very dependent in the use of computer software. In Indonesia, where most public schools are generally not well-equipped with computers and internet connection, the use of computer software is impractical.
In order to make inference about a population from a sample, students have to conceive the idea of sample and population. This idea has to be supported by other statistical idea such as the ability of a sample to represent population (representativeness), effect of sample size, sampling process, and randomization. Since IIR encourages students to employ their informal knowledge, problems with meaningful context and activities will suport their reasoning.
Another important thing to be considered is the type of data representation. The use of data-generator software, although making learning easier and more interactive, is impractical in classrooms unsupported by computers and internet connection. Constructing graph by hand, on the other hand, is quite time-consuming and error-prone. Dot plots is chosen because it is fairly simple to construct, one of the simplest data representation there is. Aside from that, by using dot plots the students can see the patterns and distribution in data clearly.
by using dot plots as data representation. The study focuses on the 7th grade students in Indonesia. The research question of this study is formulated as follow, How can 7th grade students be supported to develop informal inferential reasoning?. This paper will focus the use of dot plots as one of the way to support students in developing IIR.
THEORETICAL FRAMEWORK Informal Inferential Reasoning
In Statistics, two broad categories can be distinguished: descriptive and inferential statistics (Walpole, 1995). Descriptive statistics is only about the data in hand, while inferential statistics makes generalization beyond said data. Informal inferential statistics is proposed as a way to deal with the difficulty the students have when learning inferential statistics. It is a relatively new topic in statistics education, hence a general consensus about definition and framework is yet to be reached. Some researchers, however, have formulated definitions built around their respective studies. One of them is definition by Ben-Zvi, et al. (2007) which defines informal inferential statistics as
cognitive activities involved in informally drawing conclusions or making predictions
about some wider universe from patterns, representations, statistical measures, and statistical models of random samples, while attending to the strength and limitations of the sampling and the drawn inference p. .
Makar and Rubin (2009) suggested three key principles that are essential in making statistical inference informally: (a) generalization beyond the data, (b) the use of data to back up this generalization, and (c) the employment of probabilistic language (statement of uncertainty) in describing this generalization.
Developing Informal Inferential Reasoning
Grade 7 students in Indonesia have not been introduced to the idea of sample and population, therefore the main statistical idea that the students have to possess in order to develop are definitely sample and population. Some researchers have expressed the importance of learning about sample and population (Rubin, Hammerman, & Konold, as cited in Ben-Zvi et al., 2007). This very concept can be broken down into the following sub-ideas.
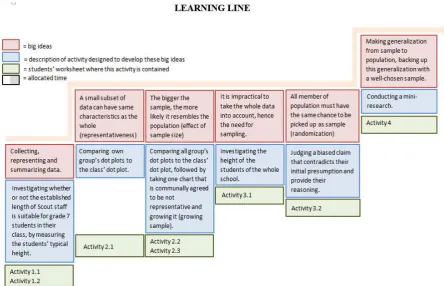
1. A part of a set of data can contain characteristics of the whole, hence representing them (sample representativeness).
2. The bigger this set of data is, the more likely it represents the whole (effect of sample size).
3. For a really big set of data, it is impractical to take all data into account (the need for sampling).
Dot Plots
Dot plots are one of the simplest statistical chart, initially exist as a hand-drawn graph to depict distribution (Wilkinson, 1999). They are useful for moderately sized data as well as to highlight clusters, outliers, range, and other characteristics (Wilkinson, 1999). Dot plots is used because it is fairly easy to construct without computer software, hence it is suitable to be used in classroom environment that is not supported by computers and internet connection. Because all the characteristics of data are shown quite clearly, the students are also encouraged to analyze the data visually instead of being dependent on formulas.
Realistic Mathematics Education
The instructional material developed in this study is designed using Realistic Mathematics Education approach. The idea was conceived by Hans Freudenthal (Gravemeijer, 1994) a Dutch mathematician, initially as his contribution to reform the way Mathematics being taught in Netherlands, from ready-to-use to student-built concept. It is adapted in Indonesia into Pendidikan Matematika Realistik Indonesia (PMRI).
METHOD
The main goal of this study is to develop instructional material intended to support the development of informal inferential reasoning in grade 7 students. Hence, this goal leads to innovation, as in new ideas about teaching Statistics in Indonesian secondary school. The final product is teaching material and an accompanying theory on how this material work in developing IIR, ready to be used by teacher in their respective classroom.
In accordance to the aim of this study, design research is chosen as the research approach. Bakker and Eerde (2013) stated that design research aims at developing theories about domain-specific learning as well as its accompanying instructional material. Every cycle of design research is conducted in 3 phases (Bakker & van Eerde, 2013), namely preparation and design, teaching experiment, and retrospective analysis. The instructional material is prepared in the first phase and implemented in the second phase. The result of teaching experiment is analyzed in the third phase by comparing it to the HLT (hypothesized learning trajectory which is the conjectured students response. The result contributes to the researcher s knowledge on what already known about )nformal Inferential Reasoning in Indonesian secondary school education setting, which is the foundation the HLT is built at, and leads to whether or not the execution of another cycle is necessary.
The study was conducted in two cycles. To cater the purpose of this paper, the following section only focus on the second meeting in the first cycle. The statistical idea developed in this meeting is the sample representativeness and effect of sample size. The participants involved were Dimas, Raffi, Sirril, Sinta, Adinda, and Wulan. They work in group of 2. The data collected from the meetings are video registrations and the students written work.
RESULT AND DISCUSSION
This section will be organized as follows. First, we will describe what the students learn in the previous lesson to set a starting point for the current lesson. This will be followed by the learning goals of the second lesson, as well as the accompanying activities and the conjecture of students reaction. Further, we will explain the actual learning trajectory, as in how the class discussion went in reality. The actual and hypothetical learning trajectory will then be compared, closed with the conclusion and discussion.
Meeting 1 is basically designed as a chance for students to recall what they have learned about Statistics in 6th grade. The context is finding a suitable length of Scout staff for students in grade 7. In order to do that, they have to find the typical height of the students in their class and decide what length will be suitable for them.
The notion about central tendency becomes a major discussion in this meeting. Even though the students are already familiar with the idea, average was introduced to them algorithmically as arithmetic mean, meaning that the students knows average as the way it is calculated and not as what it represents. The discussion about typicality in this lesson encouraged them to think of average as more than just the add and divide formula.
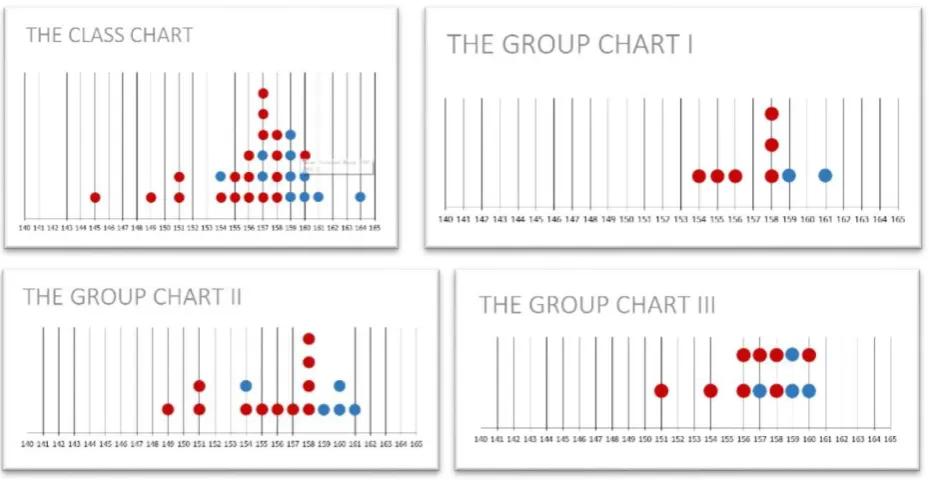
Figure 3. The group charts and the class chart
The main task of lesson 1 is to describe and analyze the dot plots. The students are asked to elaborate what they know about the height of the students in their class based on their dot plot, as well as to find the typical value. When asked about the typical height (in Bahasa Indonesia: tinggi kebanyakan siswa , the students strategy is to find the modal clump (modal values) in the dot plot.
The statistical idea intended to be developed in Lesson 2 is sample representativeness a part of data can represent the whole in Activity . and effect of sample size the bigger this part of data, the more likely it represent the population in activity . . The context for the first activity is the disappearance of the class chart while the Scout staff factory specifically asked the report to include the chart. The solution is to include the group chart instead. The task for students is to find the group chart that can represent the class chart the best. The problem can be summarized as follows.
The report about students’ height measurement will be sent to the Scout staff factory. However, the class chart is lost! The factory won’t accept the report without any chart though. Thankfully, each group still has their own group chart. Now your task is to find out which group chart can represent the class chart the best, meaning the group chart from which you can acquire the same information as you do from the class chart.
1. Which group chart can represent the class chart the best? 2. Which class chart can represent the group chart the best?
based on their shape and chose the group chart whose shape the most similar to the class chart.
As predicted, the students analyze the dot plot visually to find the characteristics of the set of data. The students use the same strategy when asked about the typical height (in Bahasa Indonesia: tinggi kebanyakan siswa) and average height (in Bahasa Indonesia: tinggi rata-rata), which is to find the modal clump (modal values) in the dot plot. As found in the previous meeting, unless asked specifically to use the formula of arithmetic mean, the students think of average as the typical value or mode. The preferred choice of using modal value as measure of central tendency is definitely encouraged by the use of dot plot as data representation, meaning when using different representation, the students will probably use different measure. However, we can interpret that the dot plot did helped the students to construct the notion of central tendency, so the notion of average
no longer means add-and-divide.
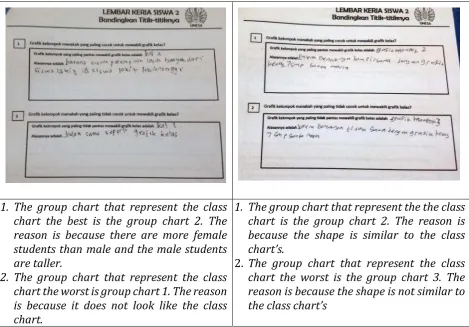
1. The group chart that represent the class chart the best is the group chart 2. The reason is because there are more female students than male and the male students are taller.
2. The group chart that represent the class chart the worst is group chart 1. The reason is because it does not look like the class chart.
1. The group chart that represent the the class chart is the group chart 2. The reason is because the shape is similar to the class chart’s.
2. The group chart that represent the class chart the worst is the group chart 3. The reason is because the shape is not similar to the class chart’s
Figure 5. Example of students worksheet from activity .
In comparing both dot plots, the students did it by matching the characteristic. Dimas and Rafi, however, used shape (Figure 5). The context for Activity 2.2 is making the least representative group chart to be more representative. The problem for activity 2.2 can be summarized as follows.
1. Add 5 more data values to the chart. What can you notice? 2. Add 8 more data value to the chart. What can you notice?
3. As the number of data inserted into the group chart get closer and closer to the total number of students in the class, what is your conclusion?
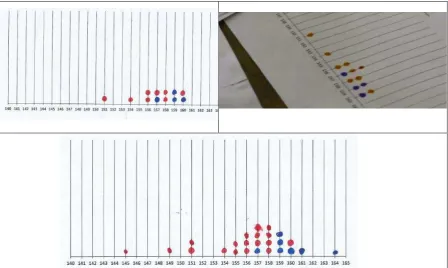
The teacher collected the additional data values by herself, read it aloud, while the students inserted it to the chart of group 2, which is agreed to be least representative. The conjecture of this activity is quite straightforward. As the number of data gets closer and closer to the total number of students the class, students can see that the group chart starts to look more like the class chart. Transcript 1 shows how the discussion goes when the students were adding the data value, while figure 6 shows the transformation of 9. Researcher : Is the shape better than before? 10. Adinda : Yes 16. Researcher : Okay, so the number is adding up and getting closer to the
number of students in the class. What can you notice? 17. Sirril : The heights, is starting to be more visible, it s starting to
look like *the class chart*
Figure 6. Transformation of group chart 3
CONCLUSION
Being able to visually singling out the characteristics of data set support students in comparing dot plot easily, which leads to the notion that one, smaller set of data can represent the bigger one as long as it gives same information. The easy construction of dot plot also support students in growing sample activity. Therefore, to conclude, the use of dot plot helps students in developing the idea of sample representativeness and sample size, two of a series of big ideas that support the emergence of informal inferential reasoning.
Figure 2. The learning line
REFERENCES
Bakker, A., & Gravemeijer, K. (2004). Learning to reason about distribution. In D. Ben-Zvi, & J. Garfield (Eds.), the challenge of developing statistical literacy, reasoning, and thinking (pp. 147-168). Dordrecht: Kluwer Academic Publishers.
Ben-Zvi, D., Gil, E., & Apel, N. (2007). What is hidden beyond the data? Helping young students to reason and argue about some wider universe. In D. Pratt, & J. Ainley (Ed.), Reasoning about Inforla Inferential Statistical Reasoning: a collection of current research studies.
Gal, I. (2002). Adults' Statistical Literacy: Meanings, Components, Responsibilities.
International Statistical Review, 70(1), 1-25.
doi:10.1111/j.1751-5823.2002.tb00336.x
Garfield, J., & Ben-Zvi, D. (2004). Statistical liteacy, reasoning, and thinking: goals, definition, and challenges. In D. Ben-Zvi, & J. Garfield (Eds.), The challenge of developing statistical literacy, reasoning, and thinking (pp. 3-15). Dordrecht: Kluwer academic publisher.
Gravemeijer, K. (1994). Developing Realistic Mathematics Education. Utrecht: Freudenthal Institute.
Simon, M. A. (1995). Reconstructing mathematics pedagogy from a constructivist perspective. Journal for Research in Mathematics Education, 26(2), 114-145. Rossman, A. J. (2008, November). Reasoning about Informal Statistical Inference: One
Statiscian's View. Statistics Education Research Journal, 7(2), 5-19.
Walpole, R. E. (1995). Pengantar Statistika (3 ed.). (B. Sumantri, Trans.) Jakarta: PT. Gramedia Pustaka Utama.
Wilkinson, L. (1999). Dot Plots. The American Statiscian, 53(3), 276-281. doi:10.1080/00031305.1999.10474474