AUTHORS
Indonesia Climate Change Sectoral Roadmap – ICCSR Marine and Fishery Sector Report
Adviser
Prof. Armida S. Alisjahbana, Minister of National Development Planning/Head of Bappenas
Editor in Chief
U. Hayati Triastuti, Deputy Minister for Natural Resources and Environment, Bappenas
ICCSR Coordinator
Edi Effendi Tedjakusuma, Director of Environmental Affairs, Bappenas
Editors
Irving Mintzer, Syamsidar Thamrin, Heiner von Luepke, Tilman Hertz
Synthesis Report
Coordinating Author for Adaptation: Djoko Santoso Abi Suroso
Marine and Fishery Sector Report
Authors: Hamzah Latief, M. Suhardjono Fitrianto
Technical Supporting Team
Chandra Panjiwibowo, Edi Riawan, Hendra Julianto, Leyla Stender, Tom Harrison, Ursula Flossmann-Krauss
Administrative Team
ACKNOWLEDGMENTS
The Indonesia Climate Change Sectoral Roadmap (ICCSR) is meant to provide inputs for the next ive year Medium-term Development Plan (RPJM) 2010-2014, and also for the subsequent RPJMN until 2030, laying particular emphasis on the challenges emerging in the forestry, energy, industry, agriculture, transportation, coastal area, water, waste and health sectors. It is Bappenas’ policy to address these challenges and opportunities through effective development planning and coordination of the work of all line ministries, departments and agencies of the Government of Indonesia (GoI). It is a dynamic document and it will be improved based on the needs and challenges to cope with climate change in the future. Changes and adjustments to this document would be carried out through participative consultation among stakeholders.
High appreciation goes to Mrs. Armida S. Alisyahbana as Minister of National Development Planning /Head of the National Development Planning Agency (Bappenas) for the support and encouragement. Besides, Mr. Paskah Suzetta as the Previous Minister of National Development Planning/ Head of Bappenas who initiated and supported the development of the ICCSR, and Deputy Minister for Natural Resources and Environment, Ministry of National Development Planning /Bappenas, who initiates and coordinates the development of the ICCSR.
The following steering committee, working groups, and stakeholders have provided valuable comments and inputs for the development of the ICCSR Marine and Fishery Sector document. Their contributions are highly appreciated and acknowledged:
Steering Committee (SC)
Deputy of International Cooperation, Coordinating Ministry for Economy; Secretary of Minister, Coordinating Ministry for Public Welfare; Secretary General, Ministry of Marine and Fisheries; Executive Secretary, Agency for Meteorology, Climatology; Deputy of Economy, Deputy of Infrastructures, Deputy of Development Funding, Deputy of Human Resources and Culture, Deputy of Regional Development and Local Autonomy, National Development Planning Agency; and Chief of Secretariat of the National Council for Climate Change.
Working Group
Ministry of Marine and Fisheries
National Development Planning Agency
Sriyanti, Yahya R. Hidayat, Bambang Prihartono, Mesdin Kornelis Simarmata, Arum Atmawikarta, Montty Girianna, Wahyuningsih Darajati, Basah Hernowo, M. Donny Azdan, Budi Hidayat, Anwar Sunari, Hanan Nugroho, Jadhie Ardajat, Hadiat, Arif Haryana, Tommy Hermawan, Suwarno, Erik Amundito, Rizal Primana, Nur H. Rahayu, Pungki Widiaryanto, Maraita, Wijaya Wardhana, Rachmat Mulyanda, Andiyanto Haryoko, Petrus Sumarsono, Maliki
Agency for Meteorology, Climatology and Geophysics
Edvin Aldrian, Dodo Gunawan, Nurhayati, Soetamto, Yunus S, Sunaryo
Universities and Professionals
ITB: Safwan Hadi; Dishidros, TNI-AL: Letkol Ir. Trismadi, MSi.
Grateful thanks to all staff of the Deputy Minister for Natural Resources and Environment, Ministry of National Development Planning/ Bappenas, who were always ready to assist the technical facilitation as well as in administrative matters for the inalization process of this document.
Remarks from Minister of National
Development Planning/Head of bappenas
We have seen that with its far reaching impact on the world’s ecosystems as well as human security and development, climate change has emerged as one of the most intensely critical issues that deserve the attention of the world’s policy makers. The main theme is to avoid an increase in global average temperature that exceeds 2˚C, i.e. to reduce annual worldwide emissions by more than half from the present level in 2050. We believe that this effort of course requires concerted international response – collective actions to address potential conl icting national and international policy initiatives. As the world economy is now facing a recovery and developing countries are struggling to fuli ll basic needs for their population, climate change exposes the world population to exacerbated life. It is necessary, therefore, to incorporate measures to address climate change as a core concern and mainstream in sustainable development policy agenda.
We are aware that climate change has been researched and discussed the world over. Solutions have been proffered, programs funded and partnerships embraced. Despite this, carbon emissions continue to increase in both developed and developing countries. Due to its geographical location, Indonesia’s vulnerability to climate change cannot be underplayed. We stand to experience signii cant losses. We will face – indeed we are seeing the impact of some these issues right now- prolonged droughts, l ooding and increased frequency of extreme weather events. Our rich biodiversity is at risk as well.
Those who would seek to silence debate on this issue or delay in engagement to solve it are now marginalized to the edges of what science would tell us. Decades of research, analysis and emerging environmental evidence tell us that far from being merely just an environmental issue, climate change will touch every aspect of our life as a nation and as individuals.
planning and priority setting.
I am delighted therefore to deliver the “Indonesia Climate Change Sectoral Roadmap”, or I call it ICCSR, with the aim to mainstream climate change into our national medium-term development plan.
The ICCSR outlines our strategic vision that places particular emphasis on the challenges emerging in the forestry, energy, industry, transport, agriculture, coastal areas, water, waste and health sectors. The content of the roadmap has been formulated through a rigorius analysis. We have undertaken vulnerability assessments, prioritized actions including capacity-building and response strategies, completed by associated inancial assessments and sought to develop a coherent plan that could be supported by line Ministries and relevant strategic partners and donors.
The ICCSR is launched now and I invite for your commitment, support and partnership in joining us in realising priorities for climate-resilient sustainable development while protecting our population from further vulnerability.
Minister for National Development Planning/
Head of National Development Planning Agency
Remarks from Deputy Minister for Natural
Resources and Environment, bappenas
To be a part of the solution to global climate change, the government of Indonesia has endorsed a commitment to reduce the country’s GHG emission by 26%, within ten years, benchmarked to the emission level from a business as usual and, up to 41% emission reductions can be achieved with international support to our mitigation efforts. The top two sectors that contribute to the country’s emissions are the forestry and energy sectors, mainly emissions from deforestation and from power plants.
With a unique set of geographical location among the countries on Earth we are at most vulnerable to the negative impacts of climate change. Measures are needed to protect our people from the adverse effect of sea level rise, l ood, greater variability of rainfall, and other predicted impacts. Unless adaptive measures are taken, prediction tells us that a large fraction of Indonesia could experience freshwater scarcity, declining crop yields, and vanishing habitats for coastal communities and ecosystems.
National actions are needed both to mitigate the global climate change and to identify climate change adaptation measures. This is the ultimate objective of the Indonesia Climate Change Sectoral Roadmap, ICCSR. A set of highest priority actions are to be integrated into our system of national development planning. We have therefore been working to build national concensus and understanding of climate change response options. The Indonesia Climate Change Sectoral Roadmap (ICCSR) represents our long-term commitment to emission reduction and adaptation measures and it shows our ongoing, inovative climate mitigation and adaptation programs for the decades to come.
Deputy Minister for Natural Resources and Environment National Development Planning Agency
TAbLE Of CONTENTS
AUTHORS i
ACKNOWLEDGMENTS ii
Remarks from Minister of National Development Planning/Head of Bappenas iv
Remarks from Deputy Minister for Natural Resources and Environment, Bappenas vi
Table of Contents i
List of Figures iv
List of Tables viii
List of Abbreviations x
1 INTRODUCTION 1
1.1 Background 1
1.2. Objectives and Targets 5
1.3. Approaches 6
1.3.1. Framework 6
1.3.2. Scientiic Analysis 10
1.3.3 Stakeholder Participation Process 11
2 CONDITIONS, PROBLEMS, AND CHALLENGES
FOR THE MARINE AND FISHERIES SECTOR 12
2.1. Indonesian Water Areas, Interactions and Their Functions 12
2.2. Potential of the Fisheries and Marine Sector 14
2.2.1. The Potential of Fisheries 15
2.3. Current Conditions and Problems of the Marine and Fisheries Sector 20
2.3.1. Conditions of the Marine and Fisheries Sector 20
2.3.2. Problems of the Marine and Fisheries Sector 20
2.4.1. Current Institutional Responses 22
2.4.2. Current National Regulation and Policy Framework 24
2.5. Climate Change Hazards and the Marine and Fisheries Sector 27
2.5.1. Increase of Air and Sea Surface Temperatures 29
2.5.2. Increase in Frequency and Intensity of Extreme Weather Events 33
2.5.3. Changes in Rainfall Pattern and Freshwater Runoff Induced by Changes
of the Climate Variability Pattern 37
2.5.4. Changes in the current Ocean Circulation Induced by Changes of the
Climate Variability Pattern 41
2.5.5. Sea Level Rise 48
2.5.6. Notes and Summary of the Hazard Analysis 52
2.5.7. Summary of Hazards induced by Climate Change in Each Region 56
2.5.7.1. Region I Sumatra Island and Its Surroundings 56
2.5.7.2. Region II Java-Madura-Bali Islands and Its Surroundings 58
2.5.7.3. Region III Nusa Tenggara Islands 61
2.5.7.4. Region IV Kalimantan Island and Its Surroundings 63
2.5.7.5. Region V Sulawesi Island and Its Surroundings 65
2.5.7.6. Region VI Maluku Islands 66
2.5.7.7. Region VII Western Part of Papua Island and Its Surroundings 68
2.6. Strategic Issues of the Marine and Fisheries Sector Related to Climate Change 69
3 VULNERABILITY OF THE MARINE AND FISHERIES
SECTOR TOWARDS CLIMATE CHANGE 74
3.1. Vulnerability Elements and Parameters of the Marine and Fisheries Sector 75
3.2. Quantitative and Qualitative Vulnerability Description for the Marine and
Fisheries Sector In Each Region 81
3.2.2. Region II Java-Madura-Bali Islands and Its Surroundings 84
3.2.3. Region III Nusa Tenggara Islands 85
3.2.4. Region IV Kalimantan Island and Its Surroundings 86
3.2.5. Region V Sulawesi Island and Its Surroundings 87
3.2.6. Region VI Maluku Islands 88
3.2.7. Region VII Western Part of Papua Island and Its Surroundings 89
4 POTENTIAL IMPACTS AND RISKS OF CLIMATE CHANGE
FOR THE MARINE AND FISHERY SECTOR 90
4.1. Potential Impacts 90
4.2. Risk Analysis (Quantitative Potential Impacts) in Each Region 94
4.2.1. Region I Sumatra Island and Its Surroundings 96
4.2.2. Region II Java-Madura-Bali Islands and Its Surroundings 96
4.2.3. Region III Nusa Tenggara Islands 96
4.2.4. Region 4 Kalimantan Island and Its Surroundings 96
4.2.5. Region V Sulawesi Island and Its Surroundings 96
4.2.6. Region VI Maluku Islands 97
4.2.7. Region VII Western Part of Papua Island and Its Surroundings 97
5 FUTURE DIRECTIONS AND STEPS? FOR THE
INTEGRATION OF CLIMATE CHANGE ADAPTATION
IN THE MARINE AND FISHERIES SECTOR 98
5.1. Future Directions for the Marine and Fisheries Sector 2010 - 2030 100
5.2. Future Steps for the Marine and Fisheries Sector in 2010-2030 101
5.2.1. Priority Activities for Adaptation 101
5.2.2. Champion Activities for Adaptation 110
5.2.3. Steps to follow for the Priority Activities 111
References 121
Appendix I Execution of Focus Group Discussion (FGD) with Associated Stakeholders 124
Appendix II Missions of the Ministry of Marine and Fisheries Directly
Related to Climate Change Adaptation Strategies 125
Appendix III Vulnerability Description 126
Appendix IV Interrelation between Potential Impacts and Adaptation Strategies,
Hazards and Vulnerabilities Related to Climate Change 129
LiST Of fiGURES
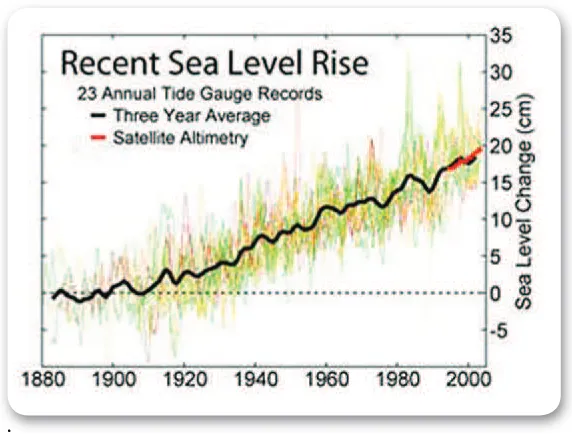
Figure 1. 1 Trends in global sea level rise for the last 125 Years
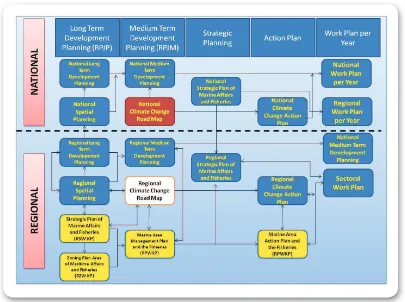
Figure 1. 2 Position of Indonesia Climate Change Sectoral Roadmap (ICCSR) in the system of development planning of the marine and isheries sector at the national and regional levels.
Figure 1. 3 Conceptual framework of adaptation accompanied by climate change mitigation (Diposaptono et.al. 2009)
Figure 2. 1 Map of the Indonesian Waters under the Law No. 6 Year 1996
Figure 2. 2 Coastal water areas and its surroundings
Figure 2. 3 Interactions in coastal water areas (Latief and Hadi, 2001)
Figure 2. 4 Economic potential of activities related to the coastal, marine, and ishery sector
Figure 2. 5 Distribution of upwelling areas in Indonesian waters (Nontji, 1993)
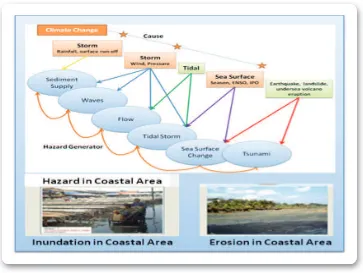
Figure 2. 6 Interrelation between hazards triggered by climate change upon the marine and isheries sector (adopted from Australian Greenhouse Ofice, 2005)
Figure 2. 7 Trend of increasing air temperature in Jakarta and Semarang
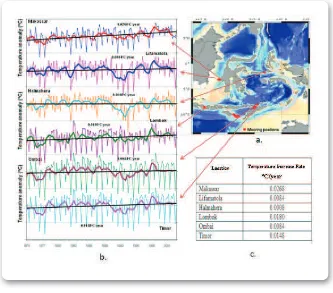
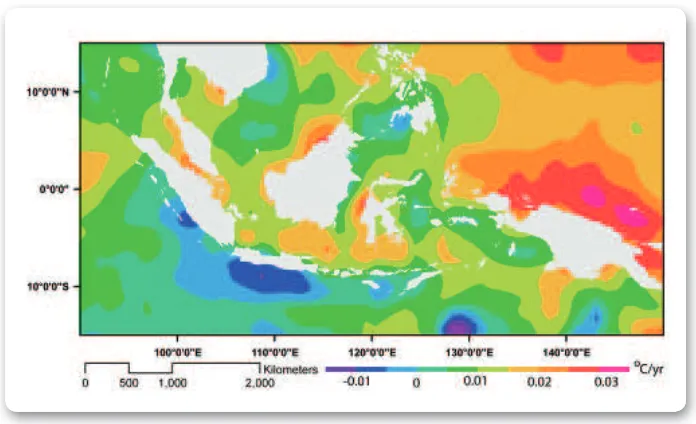
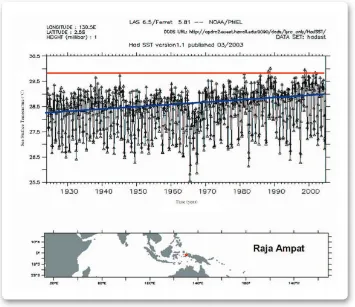
Figure 2. 8 Mooring point position of sea temperature measurement, b) sea surface temperature measurement results and (c) Temperature increase rate for every station (modiied from source: Aldrin and Ariian, 2008)
Figure 2. 9 The trend of sea level rise according to NOAA OI data, with the highest increase to be expected in the Paciic Ocean, at the north of Papua, while the lowest one is expected to occur at the southern coast of Java Island
Figure 2. 10 Trend of SST rise based on IPCC SRESa1b (IPCC, 2007) using MRI_ CGCM3.2 model (Soian, 2009)
Figure 2. 11 SST seasonal variations (black line) and SST increase trend (blue line) and the threshold temperature of the coral bleaching (red line)
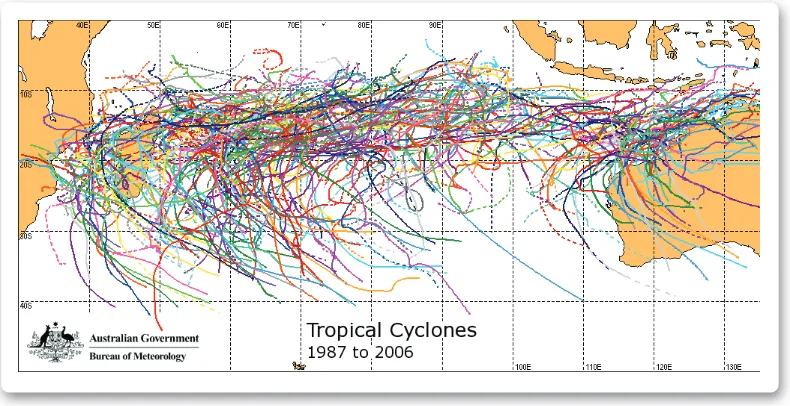
Figure 2. 12 Area of tropical cyclones (red shade). These cyclone do not occur in
Indonesia, but the impacts of hurricane and strong wind are still ecxperienced
Figure 2. 13 Tropical cyclone track in Indian Ocean (BOM Australia, 2006)
7
8
9
13
14
14
15
13
17
18
21
22
23
24
25
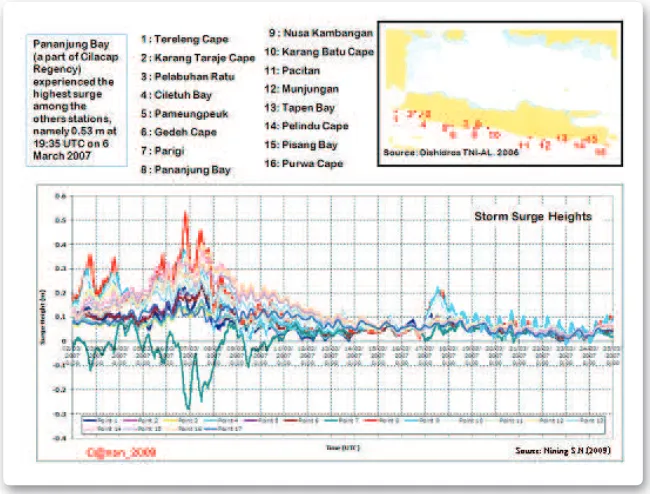
Figure 2. 14 Storm wave height distribution from model simulation results in the southern coast of Java Island (N.S. Ningsih, 2009)
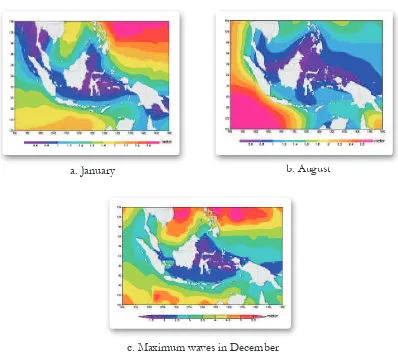
Figure 2. 15 The mean waves height in January (a) and August (b), and the maximum waves (Soian, 2009)
Figure 2. 16 Rainfall patterns in Indonesian area: (A) monsoonal type, (B) equatorial type, (C) local type (Tjasyono, 1999)
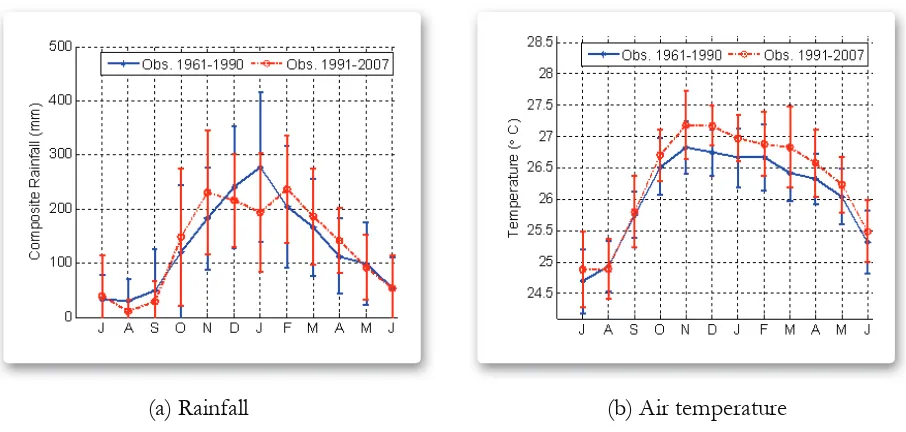
Figure 2. 17 The phenomenon of change in rainfall patterns (a) and air temperature (b) on Lombok island (Hadi, TW., 2008)
Figure 2. 18 Annual cycle of mean rainfall in Indonesia for January and August.
Figure 2. 19 Wind and average sea surface temperatures patterns in Indonesia for January and August (Soian, 2009)
Figure 2. 20 Distribution of sea water level and low patterns in January and August. Sea water level and low patterns are the monthly average for 7 years, from 1993 to 1999 (Soian, 2009).
Figure 2. 21 Spatial distribution of SSL and surface low in January and August. SSL based on altimeter data, while the direction and speed of currents is the result of an estimation of the HYCOM model (Hybrid Coordinate Ocean Model) (Soian, 2009)
Figure 2. 22 Time series of altimeter sea level anomalies (anomaly SSL) (1993 to 2008). SSL anomaly lowers down to 20 cm during strong El Niño period, and increases up 20cm during strong La Niña period (Soian, 2009).
Figure 2. 23 Distribution of average chlorophyll-a concentration in January and August, and in August 1997 during El Nino (Soian, 2009).
Figure 2. 24 Projected global sea level rise using SRESa1b IPCC (IPCC, 2007) with the assumption of a 720 ppm CO2 concentration (Soian, 2009)
Figure 2. 25 The increase in SSL until the year 2100, relative to SSL in 2000 (Soian,2009).
Figure 2. 26 Examples of time-series SSL data from some tide stations in Indonesia and its surrounding areas (Soian, 2009).
Figure 2. 27 Projected sea level rise in some locations using observatory tide data obtained from the University of Hawai’i Sea Level Center (UHSLC) (Soian, 2009).
Figure 2. 28 SSL upward trend based on altimeter data from January 1993 until December
7
8
9
13
14
14
15
13
17
18
21
22
23
24
2008 using spatial trend analysis (Soian, 2009)
Figure 2. 29 Projected levels of sea level rise in Indonesian waters based on the IPCC SRESa1b scenario with assumptions of CO2 concentration of 750ppm
Figure 2. 30 Estimates of the rate of SSL increase in Indonesian waters based on the dynamic model with the addition of ice melting after IPCC AR4 (Soian, 2009)
Figure 2. 31 Examples of subsidence due to earthquake Nias in 2005
Figure 2. 32 Examples of uplift due to Nias earthquake in 2005
Figure 2. 33 Scheme of the hazards associated with sea level rise (in this case a tsunami is not included)
Figure 2. 34 Tidal Range Distribution in Indonesia
Figure 2. 35 Three scenarios of inundation of seawater in coastal areas, due to sea level rise, climate variability La-Nina, and a storm surge. Each event is accompanied by the highest tides perigee
Figure 2. 36 Simulation of a coastal inundation in Sumatra Region
Figure 2. 37 Simulation of coastal inundation in the area of Java-Madura-Bali.
Figure 2. 38 Simulation of sea water inundation in (a) the north coast of West Java and (b) the south coast of West Java (Regional Environmental Management Agency of West Java Province, 2008)
Figure 2. 39 Simulation of sea water inundation in north coastal of Jakarta
Figure 2. 40 Simulation of coastal inundation in Nusa Tenggara Islands
Figure 2. 41 Simulation of coastal inundation on Lombok Island
Figure 2. 42 Simulation of coastal pools in Borneo and the surrounding areas
Figure 2. 43 Simulation of inundation in the area of Sulawesi and its surroundings
Figure 2. 44 Simulation of coastal looding in the Maluku Islands region
Figure 2. 45 Simulation of coastal inundation in West Papua Island
Figure 3. 1 Elevation map (altitude, topography) of land surface
Figure 3. 2 Map of the slope of Land Surface
Figure 3. 3 Map of the distribution of population
7
8
9
13
14
14
15
13
17 18
21
22 23
24
25
26
0
0
0
Figure 3. 4 Population data from Indonesia in 2005 (a) and projections for the year 2025 (b) (processed from BPS data)
Figure 3. 5 Map of the distribution of Population Density
Figure 3. 6 Map of important infrastructure vulnerability to sea level rise hazard
Figure 3. 7 Map of land cover
Figure 3. 8 Fishery Management Areas as a proxy for the potential to capture ish in Indonesia (Marine and Fisheries Ministerial Regulation No. 01-MEN-2009)
Figure 3. 9 Map of coral reef distribution in the world
Figure 3. 10 Map of mangrove forest distribution (red) in Indonesia (Departement of Marine and Fishery Affairs, 2005)
Figure 3. 11 Map of seagrass distribution (pink) in Indonesia (Departement of Marine and Fishery Affairs, 2005)
Figure 3. 12 Map of vulnerability to sea level rise hazards
Figure 4. 1 Vulnerability framework (USAID, 2009; Daw, et.al., 2009)
Figure 4. 2 Schematic Impact of climate change on several sectors
Figure 4. 3 Three scenarios of climate change risks: inundation of seawater in the coastal zone due to sea level rise, climate variability of La Nina, storm surge. Each scene is accompanied by the highest tides perigee
Figure 5. 1 The sequence of seven steps in the process of adaptation to climate change (Diposaptono et al, 2009)
7
8
9
13
14
14
15
13
17
18
21
22
LiST Of TAbLES
Table 1. 1 The report structure based on the framework of Figure 1.3 8
Table 2. 1 Export values of isheries by major commodities 16
Table 2. 2 Projected incidence of El-Nino and La Nina using SRES a1b
scenarios (Source: Soian, 2009) 40
Table 2. 3 Summary of hazards and climate change projections 51
Table 2. 4 Hazards induced by climate change in the region I 56
Table 2. 5 Hazards induced by climate change in the region II 58
Table 2. 6 Hazards induced by climate change in the region III 61
Table 2. 7 Hazards induced by climate change in the region IV 63
Table 2. 8 Hazards induced by climate change in the region V 65
Table 2. 9 Hazards induced by climate change in the region VI 66
Table 2. 10 Hazards induced by climate change in regions VII 68
Table 3. 1 Description of the elements and parameters of vulnerabilities of
the marine and isheries sector due to climate change 75
Table 3. 2 Elements and parameters considered in the analysis of the vulnerability
to lood hazards in coastal seawater (sampled from Table 3.1) 82
Table 3. 3 Vulnerability to climate change in the region I 84
Table 3. 4 Vulnerability to climate change in the region II (Java-Madura-Bali) 85
Table 3. 5 Vulnerability to climate change in the region III (Nusa Tenggara) 86
Table 3. 6 Vulnerability to climate change in the region IV (Borneo) 86
Table 3. 7 Vulnerability to climate change in the region V (Sulawesi) 87
Table 3. 8 Vulnerability to climate change in the region VI (Maluku Islands) 88
Table 3. 9 Vulnerability to climate change in the region VII (Western Part of Papua Island) 89
Table 5. 1 Nine priority activities for adaptation to climate change in the marine
and isheries sector 102
Table 5. 2 Explanation of the priority activities for adaptation to climate change
in the marine and isheries sector 104
Table 5. 3 Five Champion Activities for the adaptation to climate change
in the marine and isheries sector 110
Table L. 1 List of Conducted Focus Group Discussions (FGD) 124
Table L. 2 Missions of KKP Strategic Plan Year 2005-2009 125
Table L. 3 Sectoral vulnerability descriptions due to climate change 126
Table L. 4 Potential impacts and alternative adaptation measures speciically associated
to climate change 129
LiST Of AbbREviATiONS
AMDAL Environmental Impact Assessment
ASEAN Association of Southeast Asian Nations
Bappenas National Development Planning Agency
Bakosurtanal National Coordinating Agency for Surveys and Mapping
BMKG Meteorology, Climatology, and Geophysics Agency
BMKT Goods Content of Sinking Ship
BOM Australia Australia Bureau of Meteorology
COREMAP Coral Reef Rehabilitation and Management Program
CRV Climate Resilience Village
KKP Departement Marine and Fishery Affairs
DPP Coastal Water Areas
ENSO El-Nino Southern Oscillation
FGD Focus Group Discussion
GRK Greenhouse Gasses
GTZ Germany Deutsche Gesellschaft für Technische Zusammenarbeit
HHWL Highest High Water Level
IPCC Intergovernmental Panel on Climate Change
IPCC AR4 Intergovernmental Panel on Climate Change The Fourth
Assessment Report
IPO Interdecadal Paciic Oscillation
IPTEK Science and Technology
ITF Indonesian Throughlow
KP3K Marine, Coastal, and Small Islands
KTPL Seawater Temperature Increases
LAPAN National Institute of Aeronautics and Space
MCRMP Marine and Coastal Resource Management Project
MOD Manado Ocean Declaration
MSL Mean Sea Level
MRI_CGCM Meteorological Research Institute - Coupled General Circulation Model
NOAA National Oceanic and Atmospheric Administration
PMEL Paciic Marine Environmental Laboratory
OTEC Ocean Thermal Energy Conversion
PEMP Coastal Community Economic Empowerment Program
PKCE Increased frequency and intensity of extreme weather events
PVI-AAM Changes in the pattern of natural climate variability for wind and ocean currents change pattern
PVI-CH Changes in the pattern of natural climate variability for the
rainfall change pattern
RADPI Local Action Planning for Climate Change
RANPI National Action Planning for Climate Change
PDB Gross Domestic Product
ICCSR Indonesia Climate Change Sectoral Roadmap
RPJP Long-Term Development Plan
RPJPN National Long-Term Development Plan
RPJPD Local Long-Term Development Plan
RPJMD Local Medium-Term Development Plan
RPWKP Management Planning of Marine and Fisheries Area
RSWKP Strategic Planning of Marine and Fisheries Area
RTRN National Spatial Planning
RTRD Local Spatial Planning
SLR Sea Level Rise
SRES Special Report on Emissions Scenarios
SS Storm Surge
SRTM Shuttle Radar Topography Mission
TML Sea Level Height
TPL Sea Surface Temperature
UNCLOS United Nations Convention on Law of the Sea
UNFCCC United Nations Framework Convention on Climate Change
UN-ISDR United Nations - International Strategy for Disaster Reduction
USAID United States Agency for International Development
USGS United States Geological Survey
WOC World Ocean Conference
WPP Fisheries Potential Area
WP3K Coastal Areas and Small Islands
iNTRODUCTiON
1.1 Background
Global warming is a phenomenon of global temperature increase due to the greenhouse effect which is caused by increasing greenhouse gas emissions such as carbon dioxide (CO2), methane (CH4), dinitrooksida (N2O), and chlorolurocarbon (CFCs) into the atmosphere.
It is well known that solar radiation into the atmosphere is partly transmitted and absorbed by the earth, and is partly relected back into the atmosphere by the earth in the form of long wave radiation. In the relection process a part of the heat is absorbed by the greenhouse gases keeping the heat inside the atmosphere. The effect of heat absorption by the greenhouse gases is called greenhouse effect. As a result the Earth surface temperature and atmospheric temperature increase until these temperatures reach a new equilibrium. The amount of heat lowing into and out of the atmosphere does not change, but the amount of heat stored in the Earth and the atmosphere increases and is a reason for the rising temperature of the Earth (Hadi, et al, 2009).
.
Figure 1. 1 Trends in global sea level rise for the last 125 Years (http://rst.gsfc.nasa.gov/Sect16/Sect16_2.html)
In reality sea level may suffer both long-term and short-term changes:
a. Long term sea level changes
Long term change of sea level is also called “secular change”. It is categorized into two classes according to its causes: (1) Eustatic changes or changes of sea water volume, and (2) Local changes that include land uplift or subsidence , including isostasy effect. This isostasy effects comprises thermal isostasy due to changes in temperature or the density of the Earth’s interior, glacio isostasy related to the presence of ice, hydro-isostasy associated with the presence of water, volcanic isostasy due to magma extrusion, and sediment isostasy linked to deposition and erosion.
Also, the existence of fault causing the tectonic plate to rise (up-lift) or to fall (subsidence) could affect the sea level changes of about 1 to 3 mm/year. Sediment compaction could cause land to be compressed, or subsidence of oil and ground water extraction.
One of the eustatic effects is a change of the ocean basin due to expansion of the ocean l oor, changes in the oceanic ground l oor elevation, and seabed sedimentation. In addition, changes of sea watermass as a consequence of polar ice caps melting, release of water from the earth interior, as well as release and accumulation of the reservoir are included in the eustatic changes.
b. Short term sea level changes
El Nino and La Nina phenomena also affect the sea level in a short time period. At the time of the El Nino occurrence, sea surface in Indonesian waters decreases, while during La Nina the sea level increases. Meanwhile, looding in certain seasons is also a seasonal variation that may affect sea level in the short term, which increases runoff from rivers into the sea and causes additional sea level rise. These changes occur in seasonal up to annual periods. In addition, the sea surface oscillations occuring at harbors known as a seiche is also a factor that affects sea level in short-term. These changes could occur within a period of minutes to hours.
An earthquake that causes land deformation could cause relative changes in the sea level. Earthquakes could lead to land subsidence and/or uplift, which changes sea level relative to the land.
In addition to the above phenomena, global warming also affects air temperature rise and causes changes in atmospheric pressure and other climatic variables such as wind and rainfall. These phenomena will trigger a series of natural hazards which could impact the coastal zones. The impact is exacerbated by vulnerability factors of the coastal and marine region such as: explosive population growth and poverty, excessive exploitation of resources, as well as air and water pollution.
Serious attention needs to be given to the climate change impacts, ideally before they happen. Although the changes are slow (gradual), the potential impact is very likely and extends to the entire surface of the earth. However, the people who live or who depend on activities in coastal zones, marine, and small islands have already suffered losses due to natural disasters induced by climate change. Residential, ofices, and the harbor are feeling more often the impact of lood and storm tides; the pond farmers and the ishermen have already experienced the irregularity of wet and dry seasons disturbed by the El-Nino and La-Nina phenomena; and the ishermen have to sail further offshore in search for ish.
Anticipating the climate change impacts on the marine and isheries sector is about preparing adaptation activities so as to reduce the negative impacts of climate change and to look for opportunities to take advantage of the positive impact through a variety of responsive and planned efforts. These efforts can be accompanied by mitigation activities in the form of human intervention through science and technology to prevent or slow down climate change through the efforts of emissions reduction and/or absorption increases of the greenhouse gases (GHG) associated with this sector, such as maintenance and rehabilitation of mangrove forest and seaweed cultivation.
1.2. Objectives and Targets
The main objective of the preparation of the Indonesian Climate Change Sectoral Roadmap (ICCSR) is to determine the priority and champion activities in the area of adaptation (and mitigation efforts) to climate change in the marine and i sheries sector. These activities will be described in some steps in order to mainstream them into the RPJMN in 2010-2014 and RPJPN while considering a projection of global climate change in the period of 2010-2030 years. The position of ICCSR in the development planning system at the national and regional levels can be seen in Figure 1.2 (modii ed from Diposaptono, 2009) as follows.
Figure 1. 2 Position of Indonesia Climate Change Sectoral Roadmap (ICCSR) in the system of development planning of the marine and i sheries sector at the national and regional levels.
The targets of this activity are:
1. To identify the current conditions and problems as well as the future challenges faced by the Marine and Fisheries sector comprising hazards induced by climate change, elements of vulnerability based on the identiied hazards, as well as an analysis of potential impacts and description of risk due to the identiied hazards and vulnerabilities.
2. To formulate the strategic directions and steps of integration of the climate change adaptation into the marine and isheries sector containing several outputs, namely:
a. Direction of long-term development strategy (in the period of 2010-2030),
b. Integration of policies and activities into the medium-term development stages (for each ive-year period), and
c. Cross-sectoral issues.
1.3. Approaches
Climate change adaptation and mitigation activities are generally realized through a combination of two processes, namely:
1. Top-down process based on analysis and scientiic studies, and
2. Bottom-up process based on the participation of the stakeholders associated to this sector.
Discussion of these two processes will be preceded by an explanation of the framework of the climate change roadmap.
1.3.1. Framework
Adaptation to climate change refers to the efforts of intervening as a response to climate change that is current and will happen. It is meant to reduce risks and potential impacts on communities and ecosystems, and tries to identify and exploit possible opportunities caused by climate change. These efforts are adjustment measures, either on individual or group level, either in a reactive and/or anticipative manner. Basically, these efforts are intended to reduce the level of vulnerability in following way:
• Reduce the socio-economic and environmental exposure and sensitivity,
Mitigation of climate change is an anthropogenic intervention effort in the climate system which is designed to reduce anthropogenic effects on the climate system that cause global warming by reducing greenhouse gas emissions and enhancing the natural ability to absorb these emissions. Adaptation strategies accompanied by mitigation are needed to be mainstreamed into the national development planning for both the medium and long term. Diposaptono et al (2009) proposed a framework to assess and develop the concept of adaptation and mitigation of climate change as shown in Figure 1.3.
Figure 1. 3 Conceptual framework of adaptation accompanied by climate change mitigation (Diposaptono et.al. 2009)
In the conceptual framework adaptation accompanied by mitigation consists of at least (7) seven cylic steps (Figure 1.3), namely:
(1) Assessment of climate variability and hazards induced by climate change and their impacts ,
(2) Assessment of stressors such as human activities,
(3) Presentation of information (facts) about climate change and the environment, both induced by climate change or by human activities,
(4) Planning design includes criteria of development policies, directions and identii cation of the options for adaptation and mitigation,
(5) Implementation of adaptation and mitigation actions,
(6) Monitoring and evaluation of the implementation results of adaptation and mitigation actions, (7) From the results of monitoring and evaluation, it is necessary to i ne-tune and design: (i) adaptation
mitigation approaches to reduce greenhouse gas emissions and increase the greenhouse gas absorptions.
The concept is embodied in the structure of the report as shown in Table 1.1.
Table 1. 1 The report structure based on the framework on Figure 1.3
No Points Description Chapter
1 Introduction and approach to the problem
Approach to the study; conditions and problems; response to the current capacity; and challenges ahead; strategic issues expected to be reviewed as the primary basis of the formulation of policies and activities
1, 2
2 Identii cation of the climate change hazards
Physical environmental changes triggered by global warming; current conditions and projections until the year of 2030; and other hazards that can arise as a consequence of these physical changes
2
3
Identii cation of
elements and parameters of vulnerability
Exposure; sensitivity and adaptive capacity of the hazards
induced by climate change (UN-ISDR, 2004) 3
4
Identii cation of
potential impacts and risks
Potential impacts and risks from the hazard analysis and
vulnerability 4
5
Identii cation of
alternatives for adaptation strategies and determination of adaptation activities
Alternatives to adaptation strategies derived from the potential impact and strategic issues; selection of adaptation strategies are aligned with national development strategies; grouping strategies into priority adaptation activities; sorting the priority activities to be champion activities; stages of adaptation
activities for i ve years (2010 -- 2030)
5
Indonesia is a wide archipelagic country, the assessment and preparation of the climate change adaptation and mitigation is applied to the seven regions of development that have been determined by Bappenas, namely:
(1) Sumatra and its surrounding areas,
(2) Java-Madura-Bali and its surrounding areas,
(3) Nusa Tenggara and its surrounding areas,
(4) Kalimantan and its surrounding areas,
(5) Sulawesi and its surrounding areas,
(6) Maluku and its surrounding areas,
Implementation of adaptation and mitigation of climate change also needs to consider clusters in the marine and isheries sectors, such as:
• Seven Marine and Fisheries Services, namely:
(1) Sea Transport,
(2) Maritime Industry,
(3) Fisheries,
(4) Marine Tourism,
(5) Marine Energy and Mineral Resources-power,
(6) Marine Buildings and offshore structures,
(7) Marine Services
• Eleven Fisheries Management Areas (WPP), namely:
(1) WPP-571: Straits of Malacca and the Andaman Sea,
(2) WPP-572: Indian Ocean West of Sumatra and the Sunda Strait;
(3) WPP-573: the Indian Ocean South of Java to the South of Nusa Tenggara, Savu Sea, Western Part of Timor Sea;
(4) WPP-711: Strait Karimata, Natuna Sea, South China Sea;
(5) WPP-712: Java Sea;
(6) WPP-713: Makassar Strait, Bone Gulf, Flores Sea, Bali Sea;
(7) WPP-714: Tolo Gulf and the Banda Sea;
(8) WPP - 715: Tomini Gulf, Maluku Sea, Halmahera Sea, Seram Sea, Berau Gulf;
(9) WPP-716: Celebes Sea, North of Halmahera Island; (10) WPP-717: Cendrawasih Gulf, the Paciic Ocean;
1.3.2. Scientiic Analysis
Scientiic analysis is conducted by collection, analysis and synthesis of various data and information (documents, consultations, discussions) which is described in more detail as follows:
• Data and information that are internally obtained through the internal discussions with the scientiic team and the other sectors.
• Data and information that are obtained by studying documents and maps in related national institutions such as Ministry of Marine Affairs and Fisheries (MMAF/KKP), the National Coordinating Agency for Surveys and Mapping (Bakosurtanal), the Meteorology, Climatology, and Geophysics Agency (BMKG), and the National Institute of Aeronautics and Space (LAPAN).
• Data and information that are documents and reports obtained from some international intitutions such as IPCC, UNFCCC, USGS, etc.. These iles are obtained through internet browsing as well as in discussions with Dr. Irving Mintzer, a climate change expert, in March 2009.
Data and information are then analyzed with three types of analysis:
• Analysis of the scientiic meteorological and oceanographic data so as to provide some information of potential hazards induced by climate change. The results of this analysis will be presented in Chapter 2.
• Analysis of vulnerability and potential impacts intended to provide information of what factors cause climate change vulnerability and potential impacts in coastal zones and ocean waters of Indonesia. The results of this analysis will be presented in Chapters 3 and 4.
• Analysis of strategy and identiication of activities for adaptation to climate change. The results of this analysis will be described in Chapter 5.
1.3.3 Stakeholder Participation Process
Stakeholders are involved in the process of this ICCSR preparation in several ways, including:
• Consultation and discussions with oficials, researchers and experts from relevant institutions.
• Indirect participation through the internet sites, e.g. KKP (www.KKP.go.id), to obtain the document of KKP Strategic Plan from 2005 to 2009, and 2010-2014.
CONDiTiONS,
PRObLEMS, AND
CHALLENGES
ON MARiNE AND
fiSHERiES SECTOR
The anticipated problems in the Marine and Fisheries Sector include internal and cross-sectoral issues as well as the problems related to the capacity (in terms of policies) to respond to climate change. Discussion about the challenges of this sector include the assessments of hazard, vulnerability, and impacts of climate change, and then adaptation and mitigation efforts as well as other related issues.
2.1. Indonesian Water Areas, Interactions and Their Functions
Issuance of the United Nations Convention on Law of the Sea 1982 (UNCLOS 1982), which was ratii ed by the Government of the Republic of Indonesia through the Law No. 17 Year 1985 concerning Ratii cation of UNCLOS 1982 in Indonesia, says that the rights and obligations of the management of Indonesian marine areas must be based on international laws. It also provides a positive impact on widening the area of the marine management, so that Indonesia becomes geographically a maritime country with a marine area of 5.8 million km² (Figure 2.1), which consists of 0.8 million km² of sea territorial, 2.3 million km² of sea archipelagic and 2.7 million km² of the exclusive economic zone. In addition, Indonesia has 17,480 islands and 95,181 km coastline length (KKP, 2008). Furthermore about 50% of Indonesian marine area (5.8 million km²) is a Coastal Waters Areas (DPP), which id of potential importance: about 70% of i sh resources spent their life in such areas, and approximately 90% of marine biomasses are obtained from the DPP. Coastal Waters Area is an area that lies between the end of the continental shelf with a water depth of approximately 200 m and the shoreline (Figure 2.2). This area consists of mangrove ecosystems, coral reefs, estuaries, seagrasses, and non-living and biological resources, and facilities such as ports, coastal settlements, and coastal panorama.
.
Figure 2. 2 Coastal water areas and its surroundings
In the context of space and their interactions, the DPP is a junction of land and sea, where physical, chemical and biological parameters from land, coastal water, deep ocean, as well as from atmosphere and ocean l oor interact with one another in a highly complex system. These interactions are also inl uenced by the attraction forces of outer space objects (the sun and moon) as shown in sketch of Figure 2.3. There are also dynamic interactions in very intensive manner between terrestrial ecosystems and marine ecosystems. This area is very vulnerable to the stress of global climate change such as: sea level rise, ENSO, storm surges, storm tides as well as human activities on both land and sea.
Traditionally, the DPP is a very high activity area in terms of economic and social factors. Some of its functions are:
(1) basic functions: food production, water supply and energy;
(2) social functions: housing and recreation;
(3) economic functions: commercial transportation, mining, and industrial development; and
(4) public function: public transportation, defense, distribution of waste water, etc.
This area is also a source of renewable energy such as: ocean thermal energy conversion (OTEC), ocean current energy, ocean wave energy, tidal energy, energy conversion of the salinity gradient, oceanic bio-conversion energy (whereas the non-renewable energies are in the forms of mineral resources such as minings in coastal areas and open oceans).
2.2. Potential of Fisheries and Marine Sector
The marine and i sheries sector has seen increases of its contribution to the National Gross Domestic Product (NGDP), with an overall economic potential worth of US$ 136.5 billion. The largest contributions are from i sheries, sustainable coastal resources, marine biotechnology, marine tourism and natural oil (KKP, 2005) as seen in Figure 2.4.
Figure 2. 4 Economic potential of activities related to the coastal, marine, and i shery sector
2.2.1. The Potential of Fishery
Fishery is one of the marine resources with a high potential in Indonesia. Beside acting as a food source, i sheries become a commercial commodity for export, contributing to the foreign reserve, as shown in Table 2.1.
Table 2. 1 Export values of i sheries by major commodities
(Ministry of Marine Affairs and Fisheries, 2008)
COMMODITY 2004 2005 2006 2007 2008*) Average Increase (%) 2004 - 2008 2007 - 2008
EKSPORT
Volume (Ton) 902.358 857.782 926.478 854.328 845.939 -1,43 -0,98 Shrimp 142.098 153.900 169.329 157.545 179.409 6,31 13,88 Tuna, Skipjack 94.221 90.589 91.822 121.316 125.992 8,37 3,85
Pearl 2 13 2 13 16 309,94 21,47
Seaweeds 51.011 69.264 95.588 94.073 95.125 18,33 1,12 Others 615.027 544.015 569.736 481.381 445.397 -7,45 -7,48 Value (US$ 1000) 1.780.833 1.912.926 2.103.471 2.258.920 2.708.678 11,17 19,91 Shrimp 892.452 948.121 1.115.963 1.029.935 1.220.428 8,68 18,50 Tuna, Skipjack 243.938 245.375 250.557 304.348 337.896 8,80 11,02
Pearl 5.866 10.735 13.409 12.644 12.694 25,65 0,39
Seaweed 25.296 57.515 49.586 57.522 105.639 53,31 83,65 Others 613.281 651.180 673.957 854.470 1.032.021 14,31 20,78
Note : *) Temporary numbers
a. General Potential of Fishery in Indonesia
The potential of marine i sh resource commodities and their regional distribution in Indonesian waters are described as follows (BE Priyono, et al., 1997):
Big pelagic i sh resources
The big pelagic i sh species of madidihang, big eye tuna, albacore can be found in the waters of west Sumatra, south of Java, Bali and Nusa Tenggara, Banda Sea, Flores Sea and Makassar Strait, Molucca Sea and Gulf of Tomini, Celebes Sea and north of Irian Jaya, as well as Arafura Sea. As for the bluei n tuna species, it can be found in the waters south of Java, Bali and Nusa Tenggara, Banda Sea, Flores Sea and Makassar Strait, and the Maluku Sea and the Gulf of Tomini. The tuna i sh species of skipjack can be found almost everywhere in the waters of Indonesia except in the Java Sea, Malacca Strait and South China Sea. The Tongkol i sh can be found near the coast in all parts of Indonesian waters. Fishing season for all the above i sh species is throughout the year.
Small pelagic i sh resources
concentrate in the Bali Strait. Another type of small pelagic ish is the layang ish which mainly concentrates
in the northern and southern seas of Sulawesi and Java Sea, while the kembung ish can be found mainly
in southern, western, and eastern seas of Kalimantan, Malacca Strait and the western seas of Sumatra.
Teri ish can be found in the western waters of Sumatra, Malacca Strait, the southern and north eastern
seas of Sulawesi and Sumatra, while tembang ish are found especially in the southern waters of Sulawesi,
Java Sea, Bali / NTT / East Timor, eastern and southern seas of Sumatra and the sea nearby West Kalimantan. Julung-julung ish are found in the waters of Maluku and Irian Jaya.
Demersal ish resources
Demersal ishes live near sea bottom of waters with a depth of less than 100 m; they like to live in the waters which are relatively lat and muddy. The water which are expected to have high potential resource of demersal ish is in the Gulf of Tolo (Central Sulawesi) as the water there is relatively shallow and wide, and also in the Arafura Sea where there is a very large capture areas of demersal ish, as well as in the northern waters of Papua.
Shrimp resources
The best potential of panaeid shrimp resources in Indonesia can be found in the Arafura Sea, while the largest potential of reef shrimp is in the Indian Ocean.
Consumptive ish resources in reef waters
Consumptive ish resources in reef waters have not been widely exploited, it is still limited to some accessible areas and for particular communities. Only few species are already intensively exploited as high commercial values, such as easy to be captured and high density ish such as yellow tail ish and bananas ish (Caessionidae). The largest potential of reef ish in Indonesia can be found in southern Sulawesi.
It is known that the level of exploitation of ish resources in the western part of the Indonesian waters, especially in coastal zones, has approached the maximum levels of its carrying capacity- some resources are even excessively exploited. On the other hand, most of the ish resources off the coast, in the eastern part of Indonesian waters, and in the Indonesian ZEE have not been optimally exploited.
b. Primary Productivity As Indicators For Fisheries Locations
To support the marine isheries industry, it is very important to have knowledge of where the ish are gathered. These locations are an aquatic area with high fertility level indicated by primary productivity. The higher the primary productivity, the higher the fertility level.
part of the energy, although it lies only as a thin layer at the surface of the water where there is enough sunlight.
Primary productivity is inl uenced by three factors: light, nutrients, and oceanographic factors which will be described below.
Light factor
Phytoplankton is only found in top layers where the sunlight intensity is sufi cient for photosynthesis. In the tropical oceans the sunlight can penetrate into the depths of 100 to 120 m such that the photosynthesis is still likely to occur (Nybakken, 1992).
Nutrients substances factor
Major inorganic nutrients that are needed by phytoplankton to grow and reproduce are nitrogen (as nitrate, NO3-) and phosphorus (as phosphate, PO42-). Those two main elements are very important because their concentrations in the sea are relatively small and therefore become limiting factors for phytoplankton productivity. The most fertile oceans contain only 0.00005% of nitrogen, the amount is equal to 1/10,000 of the amount of nitrogen contained in the soil (Nybakken, 1992). Nutrients can only be used on photic zone to become a very signii cant inventory and it can increase the production.
Oceanographic factors
A very large amount of nutrient locates below the photic zone. These nutrients can only be utilized if there are oceanographic factors such as upwelling (displacement of water mass from beneath to the surface layer) which can raise the nutrients to the photic zone. Results of the research carried out in various locations in Indonesian waters (Nontji, 1993) showed that the upwelling has been known and proven in some areas, but in some others it is still an estimate and needs to be further investigated (Figure 2. 5).
c. Time Pattern of the Potential Fishing in Indonesia
Upwelling areas in Indonesia always shifted according to changes of wind patterns due to monsoonal climate that affect Indonesian waters. According to Susanto (2000), upwelling areas in the west ocean of Sumatra up to the south ocean of Java, Bali and Nusa Tenggara are affected by two seasons, i.e. southeast and northwest monsoons, in normal conditions.
During the southeast monsoon (May to September) the southeast wind moves parallel to the south coast of Java Island coming from Australia. This wind causes movement of surface water mass offshore ward in the south coast of Java. As a result there is a lack of surface water mass in most of the south coast of Java so that, as compensation, the water mass from the bottom moves upward (upwelling) to replace the surface water mass deiciencies. The movements of bottom water mass are surely accompanied by a rise of nutrients into the surface inducing the high primary productivity in the area. This event intensively begins around May-June in the south coast of East Java. Between August to October, the southeast monsoon winds are intensiied. Strengthening of this southeast wins causes the upwelling center to move to the west coast of Sumatra. Upwelling center is then located around the Enggano Island.
In other areas, there are also temporary upwelling areas in the Makassar Strait (Wyrtki, 1961). During the southeast monsoon winds, the sea water mass from Flores meets with the mass of water coming out of the Makassar Strait, and move together to the Java Sea. This situation causes the water from the lower layer of the Makassar Strait moving upward to replace the water mass deiciencies. This situation is characterized by high surface salinity in June and July.
2.3. Current Conditions and Problems of Marine and Fisheries Sector
2.3.1. Conditions of Marine and Fisheries Sector
The environmental condition of the marine and ishery sector can be observed from marine, coastal and small island ecosystems because of its inluences on the levels of resource productivity (KKP, 2005). These ecosystems contain coral reefs, mangroves, seagrass, estuary, and marine aquaculture. In general, these ecosystems have suffered the physical degradation up to a level that threats the resource sustainability. For instance: coral reefs which spread over an area of more than 60,000 km2 have been damaged by up to around 40%. Some of the factors are: (i) human activities (ishing with destructive devices, pollution, over-exploitation, etc.), and (ii) natural factors (El-Nino and La-Nina, hurricanes, earthquakes, and loods). Similarly, mangrove forests have reduced from 5.21 million ha to 2.5 million ha in a 12 year period (1982-1993), partly because of land conversion to aquaculture ponds, especially in southern parts of Sumatra, southern parts of Sulawesi and East Kalimantan, and to industrial areas, especially in Java and Bali.
participation and collaboration between government and local government with various parties such as the coastal communities themselves, NGOs, universities, and media.
2.3.2. Problems of Marine and Fisheries Sector
In general, the marine and isheries sector faces two internal problems: the inoptimality of management and the development of the sector in terms of captured isheries, cultured isheries, utilization of small islands, marine conservation, non-conventional marine potential and the weakness of law enforcement when it comes to illegal ishing. The sector also meets external problems, especially arising from the lack of national awareness about the importance of marine resources for national prosperity. This can be seen in the form of unsupportive policies on monetary, iscal, investment, spatial planning, pollution control, law certainty and law enforcement.
The consequences , especially in coastal waters, are degradation or deterioration of coastal environment habitats caused by domestic and industrial pollution, over-exploitation of marine resources (over-ishing), losses of coral reefs, mangroves, reclamation activities, dredging and erosion. Other consequences are settlements or resource exploitation activities such as deforestation and mining. Other issues relate to a decline in value or losses of historical, archaeological and cultural heritage caused by the construction of hotels and other development activities.
Pollution in coastal zones from river catchment area is generally caused by sediments from erosion due to deforestation and mining, waste from residents and run-off from agriculture, pesticide residues from agriculture and aquaculture, the operation of ships, oil spills from ship collision and oil drilling rigs, thermal pollution from power plant emissions channels, industrial waste water pollution. The burden of pollution is highly correlated with the density and the level of agricultural productivity, including livestock and ponds.
Excessive ishing in the coastal waters or even in the off shore (open ocean) is common in high population areas. The over-ishing is usually indicated by the failure of catch per unit of effort. Another cause of ish stock decline is the degradation of ecosystems as a place to support ish breeding. Losses of mangrove forests as a breeding ground for ish and shrimp and destructions due to unsustainable ishing techniques such as the use of dynamite and cyanide also contribute to the decline of the quality of ishing grounds.
ishing by using bombs or poison causing the death of coral reefs, (4) Development: damages due to mining for materials/building materials.
The losses of mangrove forest are primarily caused by the conversion into ponds, rice ields, ports and other development activities.
Degradations of coastal environments, which are generally caused by the pressures stemming from the activities for the fulilment of human needs, are worsened by climate change. This degradation can alter the coastal and marine environment containing signiicant biota and biodiversity.
2.4. Current Capacity in Responses to Climate Change
Capacities required to cope with climate change issues affecting the marine and isheries sector include human resources, research activities, and policies.
2.4.1. Current Institutional Response
At the political and policy levels the Indonesian Government has shown strong commitment in anticipation of climate change issues by organizing the United Nations Framework Convention on Climate Change (UNFCCC) in Bali in December 2007 that produced the Bali Road Map. This result was then followed up by the implementation of the World Ocean Conference (WOC) in Manado, on May 14, 2009. This ocean conference has produced some agreements included in the Manado Ocean Declaration (MOD) taken up by 74 countries and 13 international agencies.
Some of the agreements set out in the MOD include:
• Need for a national strategy in the management of sustainable coastal and marine ecosystems as an attempt to reduce the impact of climate change.
• Need for the implementation of an integrated coastal and marine management system to reduce risk and vulnerability for coastal communities and infrastructures.
• Need for an integrated and sustainable scientiic research and monitoring of oceanas well as awareness building on hte community level.
adaptation strategies which include (1) the management and development of marine conservation, the rehabilitation of damaged ecosystems habitats such as coral reefs, mangrove forests, seagrass, and estuarine; (2) marine, coastal and small island spatial planning; (3) maintenance and improvement of the management of marine, coastal and small island ecosystems; and (4) improvement of safety, mitigation of sea natural disasters, and forecasting of ocean climate.
Similarly, the irst mission, that is improving the public welfare of ishermen, ish farmers, and other marine and isheries businessmen, and the second mission of improving the role of marine affairs and isheries sector as a source of economic growth, had supported and strengthened the adaptation efforts to climate change.
Some of the main activities are also relevant to adaptation strategies including: (1) empowerment of marine and isheries communities; (2) increase of public participation in monitoring; (3) dissemination and assimilation of the results of research and development of the marine and isheries science and technology; (4) development of the ocean, brackish, and freshwater cultured areas; (5) development of ishing ports and boats; monitoring of marine and isheries resources; (6) empowerment of small island communities and facilitating the integrated management of coastal zones; (7) increases in the resource capacities of marine and isheries researches.
In Strategic Planning of 2010 – 2014, the Ministry of Marine Affairs and Fisheries have highlighted strategic objectives that also respond to climate change. One of the objectives is to manage marine resources and isheries in a sustainable way, through utilization of the natural resources in an optimal way, conserving species and areas, managing small islands, and preventing destructive and illegal activities.
The Directorate General of Marine, Coastal, and Small Islands of Ministry of Marine Affairs and Fisheries has responded to many issues concerning climate change. The task of this working unit has a more territorial and cross-sectoral focus, besides working towards the conservation of coastal, marine, and small islands. This ministry has conducted some responses related to climate change issues such as:
• MCRMP Program (Marine and Coastal Resource Management Project), that aims to improve the ability of the Provincial and Regency/City Governments in conducting the functions and responsibilities to explore, utilize and manage the natural resources in coastal and ocean within each responsible territory. This program has been conducted in the year 2001 - 2009 in 15 provinces in Indonesia (source: http://www.KKP.go.id/index.php/ind/menu/31/MCRMP)
Similarly, the KKP annual programs held in all provinces have supported the adaptation attempts to climate change, such as programs of coastal and marine ecosystem rehabilitation as well as small island conservation and empowerment.
2.4.2. Current National Regulation and Policy Framework
Several laws and regulations which are relevant to climate change adaptation for the marine and isheries sector are as follows:
Laws
• Law Number 27 Year 2007 on Management of Coastal Zones and Small Islands
• Law Number 26 Year 2007 on Spatial Planning
• Law Number 24 Year 2007 on Disaster Recovery
• Law Number 17 Year 2007 on Long Term Development Plan 2005-2025
• Law Number 16 Year 2006 on Agriculture, Fishery, and Forestry Counseling Systems
• Law Number 32 Year 2004 on Local Government
• Law Number 31 Year 2004 on Fisheries as revised in Law No. 45 Year 2009
• Law Number 25 Year 2004 on National Development Planning System
• Law Number 7 Year 2004 on Water Resources
• Law Number 20 Year 2003 on National Education System (Human resources).
• Law Number 18 Year 2002 on Marine Research and Development (Ocean Law and
Inforcement)
• Law Number 23 Year 1997 on Environmental Management
• Law Number 6 Year 1996 on Indonesian Waters.
• Law Number 21 Year 1992 on Shipping.
• Law Number 9 Year 1990 on Tourism (Coastal Tourism).
• Law Number 5 Year 1990 on Conservation of Natural Resources and Its Ecosystem
• Law Number 17 Year 1985 on Ratiication of UNCLOS 1982 in Indonesia
• Law Number 15 Year 1983 on Indonesia Economic Exclusive Zone.
• Law Number 1 Year 1973 on Continental Shelf .
• Law Number 11 Year 1967 on Mining (Marine Mining).
Government Regulations
• Government Regulation Number 23 Year 2008 on Participation of International Organizations and Foreign non-Governmental Organizations in Disaster Recovery
• Government Regulation Number 21 Year 2008 on Implementation of Natural Disaster Recovery
• Government Regulation Number 8 Year 2008 on Stages and Guidelines in Development, Controlling, and Evaluation of Implementation of Regional Development Plan
• Government Regulation Number 38 Year 2007 on Distribution Of Governmental Responsibilities between Central Government, Provincial Governments, and Regency/City Governments
• Government Regulation Number 27 Year 1999 on Environmental Analysis Assesment
• President Regulation Number 5 Year 2010 on Medium Term National Development Planning
(RPJMN) 2010-2014.
• President Regulation Number 8 Year 2008 on National Disaster Recovery Agency
• President Regulation Number 81 Year 2005 on Ocean Safety Coordination Agency
• President Regulation Number 32 Year 1990 on Protection Management of the Protected Areas
• Regulation of Minister of Environment Number 5 Year 2000 on Guidelines for Environmental Analysis of Wetland Development Activities
Adjustments due to Unavalaible Law and Policy
As the lack of laws and regulations which govern speciically and directly the adaptation and mitigation to climate change, the implementation may refer to Law No. 24 of 2007 on Disaster Management and Law Number 27 Year 2007 on the Management of Coastal Zones and Small Islands that is binding for the national government, local governments and communities.
such as temperature increases and sea level rises.
To accommodate the peculiarities of the characteristics of natural disasters induced by climate change, it is necessary to formulate new regulations and policies concerned with adaptation and mitigation of climate change and/or to adjust existing laws and policies mentioned above.
2.5. Climate Change Hazards and the Marine and Fisheries Sector
Ocean waters covering approximately 71% of the earth surface play an important role as a receiver, storage, and distributor of heat absorbed from solar radiation through the ocean currents circulation system from the equator region towards the poles. Thermohaline circulation becomes an energy storage system in which heat energy received by the surface sea water transported and distributed into the deep ocean for thousands of years. Through this distribution of heat energy the evaporation of sea water occurs so as to disburse the latent heat energy into the atmosphere and stimulate the hydrological cycle that can generate storms and cyclones.
Temperature affects the sea level rise, both directly through control of heat and indirectly through the relection of heat energy from the atmosphere so that it affects icebergs, polar ice, and the hydrologic cycle. The absorption of carbon dioxide by the ocean is naturally able to compensate the heat energy from the atmosphere.
The equilibrium system between the ocean and the atmosphere is recently disturbed by human activities which led to increases of production of greenhouse gases, leading to global climate change. Climate change may trigger some natural hazards in the marine and coastal environments which are identiied and reviewed by the Working Group I of the Intergovernmental Panel on Climate Change (IPCC-WG1) as follows:
1. Seawater temperature increases (for further coded: KTPL)
2. Increases in frequency and intensity of the extreme weather events (storms, cyclones) (code: PKCE)
3. Changes in the patterns of natural climate variability (El-Nino, La-Nina, IPO), leading to further hazards in the forms of:
• Changes in rainfall and river low patterns (code: PVI-CH)
• Changes in wind circulation and ocean current patterns (code: PVI-AAM)
The above hazards may interact with each other: an area may suffer various climate forces or hazards induced by climate change at the same time.
Australian Greenhouse Ofice (2005) describes the inluence of climate change on hazards that will arise in the coastal and marine areas as shown in Figure 2.6 in the form of:
• storms that affect rainfall and surface runoff,
• storms associated with wind and pressure, and
• sea-level changes (seasonal variability, ENSO and IPO).
Figure 2. 6 Interrelation between one hazard to the others triggered by climate change upon the marine and i sheries sector (adopted from Australian Greenhouse Ofi ce, 2005)
2.5.1. Increase of Air and Sea Surface Temperatures
Figure 2. 7 Trend of increasing air temperature in Jakarta and Semarang
An Analysis of the increase of sea surface temperature (SST) has also been conducted by several researchers such as:
• Levitus et al (2000) examined and analyzed the approximately 5 million SST proi le data at depths of 0-300 meters (up to 3000 meters depth) and showed that there was an increase in global SST around 0.31oC between 1948-1998, or the rate of SST increase is 0.0062 oC/year which means that it already occured since the end of World War II.