The Development of Manufacturing Process Analysis:
Lesson Learned from Process Mining
Bernardo Nugroho Yahya1*
Abstract: Process analysis is recognized as a major stage in business process reengineering that has developed over the last two decades. In the field of manufacturing, manufacturing process analysis (MPA) is defined as performance analysis of the production process. The performance analysis is an outline from data and knowledge into useful forms that can be broadly applied in manufacturing sectors. Process mining, an emerge tool focusing on process perspective and resource perspective, is a way to analyze system based on the event log. The objective of this study is to extend the existing process analysis framework by considering attribute perspective. This study also aims to learn the lessons from some experiences on process mining in manufacture industries. The result of this study will help manufacturing organizations to utilize the process mining approach for analyzing their respective processes.
Keywords: Manufacturing process analysis, process mining, business process.
Introduction
Manufacturing industries have concerned the impor-tance to improve their capability to meet demands’ requirements, i.e., high quality products with shorter cycle time. They put a lot of efforts and investments to improve those requirements by ensuring optimum economic within a certain agreement-level of quality. The solution to these challenges and opportunities is found in the current application and intrinsic assimi-lation of a model-based, knowledge-enabled environ-ment that addresses a full spectrum of enterprise product, operational and management life cycles. Manufacturing process analysis (MPA) has been recognized as one of the important application func-tions in a manufacturing process management. Cur-rently, MPA is mostly used to monitor the current production process and measure the performance of overall processes. Some of previous works on MPA using process mining showed a comprehensive results (Rozinat et al. [1], Son et al. [2,3]). However, there are corresponding discussions on more foundational questions related to the importance of discovering process model and the usefulness of process mining in the manufacturing domain (Aalst
et al. [4]).
Process mining has emerged as a way to analyze system and their actual use based on the event logs they produce (Aalst [5], Aalst et al.[6]).
1Industrial and Management Engineering Department, Hankuk
University of Foreign Studies, Oedae-ro 81, Mohyeonmyon, Cheoingu, Yongin, South Korea 449791.
Email: [email protected].
*Corresponding author
The goal of process mining is to extract useful know-ledge such as process models, organizational models, etc. from the logs, which are commonly available in information systems. Most of process mining applica-tions have focused on a service industry, and relatively little attention was paid to the manufac-turing industry (Aalst [5], Aalst et al. [7], Aalst [8], Hornix [9]). Previous research works and develop-ment efforts on MPA showed their comprehensive results in the process perspective. Some of the analysts argued that MPA using process mining has little impact, in particular, to result a production process which is the same as a-priori model. In fact, process discovery, a tool in process mining, can discover a suitable process model for specific pur-pose, e.g., a process model that shows deviation. This results in the research objective question: “how can the concept of process mining be applied in a manufacturing environment?” In order to answer
this research question, it is necessary to answer two
questions; “what is process mining” and “what can process mining do”? Therefore, this paper merely report the experiences with process mining and review previous works thereby stimulating the reader to view the importance of this issue in the manufacturing.
process for the attribute perspective and proposes an event data visualization using annotation chart and utilizes the quantitative aspects of production pro-cess for the attribute perspective. For these appli-the lessons that can be learn from process mining, in particular, in a manufacturing industry. The results expectedly helps analysts in examining the industry based on process facts.
This paper is organized as follows. First, this paper proceeds with a brief explanation of the process analysis framework. After that, it presents the appli-cation of manufacturing process analysis. The following section describes the discussions for the lessons of the existing manufacturing process analy-sis. Finally, it concludes the overall results and highlights the implications.
Methods
Process Analysis Framework
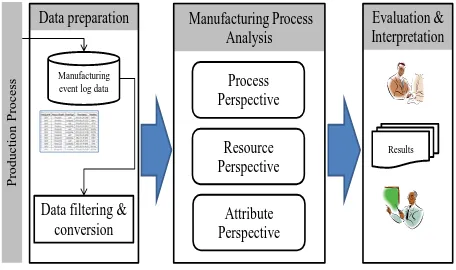
In this section, we explain a process analysis work for manufacturing process analysis. The frame-work shows how event logs from a manufacturing company can be analyzed with data and process mining techniques. As shown in Figure 1, it consists of three major steps: data preparation, manufactur-ing process analysis, and evaluation and interpre-tation. In the data preparation step, data related to manufacturing process executions are extracted from a manufacturing database and stored in an indepen-dent repository, called as event logs. In the manu-facturing process analysis step, several performance measurement techniques, including process mining approach, are applied to analyze the logs. Finally, the results are evaluated and interpreted by decision makers. Each step will be explained in detail in the next section.
Figure 1. Process analysis framework
Data Preparation
A manufacturing process consists of the sequence of activities to make final products from raw materials. The activities are performed using manufacturing equipment. A manufacturing company stores vari-ous kinds of data and information that are generated during manufacturing. The process data includes product information and related attributes such as names of the activities, names of the equipment, start time and end time of activities, number of lots, name of performers, etc. Among the data generated by manufacture company, a suitable information should be extracted to analyze the manufacturing processes.
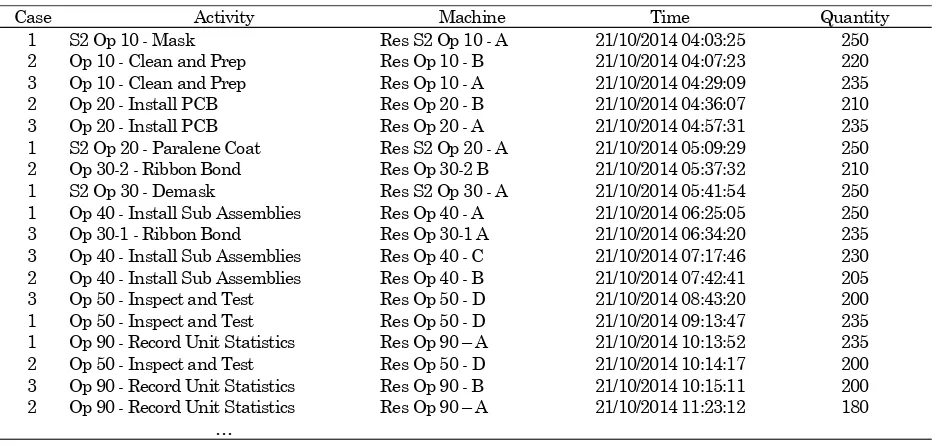
For process analysis, a log which contains a set of cases (i.e. process instances) is required. Each case consists of a sequence of events with various attri-butes such as activity name, event type, timestamp, resource name, event data, etc. Table 1 shows a fragment of manufacturing process with two cases and nine activities including resource attributes. By considering the time sequence, we can get an example of traces, including the resources, as shown in Table 2.
Processes in the manufacturing have specific process
ID (we referred to “Case”) and process name (we
referred to all processes in the manufacturing as "activities" in the later part of this paper). During manufacturing process, it is possible to record the event type. Event type identifies the transactional information at a given point in time. For example, starting to do Clean & Prep would be a start event. Finishing the Clean & Prep is a complete event. The time (i.e. timestamp) of the event is to show the order of the events in a case. The event also contains information about name of resources and number of lots. Resource is an entity (e.g. machine or perfor-mers) that performed an activity. Other data attributes e.g. number of lots (input or output quan-tity) can provide additional analysis for managers. We can formalize the event log as follow.
Definition 1. Event Log
of timestamps and Q is a set of quantity. In some cases, there is no event type recorded in the repository. In that case, it usually refers to the start time of the correspond activity Case. C is a set of event for its one instance where a collection of all cases is an event log (L). Cases always have a trace, denoted as σ∊E*.C=E* is the set of possible event sequences (traces describing a case). Then, L∊ℬ(C) is an event log. Note that ℬ(C) is the set of all bags (multi-set) over C. Each element of L denotes a case.
For any event e∊E, π(e) is the value of an attribute for event e. If event e does not have a designated
attribute named, then π(e) = ⏊ (null value). More-over, each attribute has each mapping function. For
example, πA(e) is the activity associated to event e,
The production process data often includes incom-plete data. Thus, data filtering is a step to remove incomplete cases, e.g. a manufacturing process should have one start activity and one end activity. This step is regarded as data cleansing to obtain accurate analysis of manufacturing process. The current process mining tool need to receive an input using a standard form, i.e., MXML. However, there is also another consideration to apply using data-base. This study applies process mining using data from both MXML and database.
Manufacturing Process Analysis
This section describes the use of process mining to analyze manufacturing process in three perspectives; process, resources and attributes. The process per-spective focuses on the control-flow, i.e., the ordering of activities. The objective of this perspective is to find all possible paths expressed in terms of specified format, e.g. graph. The comparison of a resulting graph with a-priori model is relevant to observe the behavior recorded in the log. The resource perspec-tive focuses on the resource entity, i.e. which resources are involved and how they are related. The objective is to mine the organization structure of resources by classifying machine in terms of organi-zational units. In addition, it can also show the relations between individual resources. The attribute perspective focuses on some relevant attributes, e.g., product quantity, to figure out the potential issues during process execution.
Process Perspective
Process perspective aims to construct a process model, verify the model based on event log, and derive some patterns. Three typical types of analysis in the process perspective are process discovery, conformance checking and pattern analysis (Aalst [5]). Process discovery aims at constructing a process model that reflects current situation from enactment logs. Conformance checking focuses on finding the discrepancies between the process model and the event log and pattern analysis pays more attention to find specific structural representations. In this paper, we focus to review the experience on using process discovery.
Process discovery is considered as one of the most challenging process mining tasks (Aalst et al. [6]). Based on an event log, a process model is constructed thus capturing the behavior seen in the log. A numerous algorithms of process discovery are existed. This study covers the most prominent algorithm, called heuristic mining (Weijters et al.[10]). Heuristic mining takes frequencies of events and sequences into account when constructing a process model. In addition, it includes the discovery of control flow behaviors (i.e., sequence, AND, and OR) which comes from the causal dependency of the events.
The starting point of the heuristics mining is the construction so called dependency graph. Traces, which described aforementioned, are required to obtain dependency graph. A trace contains the ordering of the events. If an event is always followed by another event, it is likely that there is a dependency relation between both events. Let L be an event log over A and a1, a2∊A. a1>L a2 indicates
that there is a sequence of activities in the log L such that the relation of a1 and a2 is direct succesion.
a1>>L a2 denotes as a sequence of activities such that
the relation of a1 and a2 is direct succesion and there
is a sequence from a2 to a1. It is considered as a loop
with length two (Weijters et al.[10]).
A frequency based metric is used to indicate how we certain that there is a dependency relation between two activities a1 and a2 (notation a1⇒L a2). The
calculated ⇒L values between the activities are used in a heuristic search for retrieving the dependency
A frequency based metric is used to indicate how we certain that there is a dependency relation between two activities a1 and a2 (notation a1⇒L a2). The
calculated ⇒L values between the activities are used in a heuristic search for retrieving the dependency
two) (eq.3). For further detail, reader can refer to the original publication (Weijters et al. [10]).
1 2 2 1
Resource perspective deals with all information related to the performance of resources e.g.
indivi-dual performance of each resource and relation between resources. In this study, the resource perspective refers to the work of social network and organizational mining (Aalst et al. [7], Song and Aalst [11]). It aims to extract the resource network based on the relationship of activities and individual of resources. The resource perspective also provides the organizational of the resource and resource assignment.
We describe the notion of social network analysis as the basis of analysis in the resource perspective. Let consider the example in Table 1. For example, we can deduce that activity D is executed by either M4 or M10, E is executed by M5 and F is executed by M6. Other activities has only one resource since it shows only one instance. This example can show a typical method to find the organizational structure according to executed activity. For larger data set, it is possible to find the resource which performed in different activity (e.g. a machine can be used in different activity).
The organizational of the resource applies organi-zational mining (Song and Aalst [11]). The focus on deriving organizational entities from the event log is on the relation between resources (machine) or
Table 1. A fragment of manufacturing event log
Case Activity Machine Time Quantity
1 S2 Op 10 - Mask Res S2 Op 10 - A 21/10/2014 04:03:25 250
Table 2. Example of traces with activity and resource information (A1: S2 Op 10 – Mask, A2: Op 10 – Clean & Prep, B1: S2
groups of resources (machines) and the process (doing similar task). We can also infer the relations among individuals (or group of individuals) instead on focusing on the relation between the process (transfer of work, working together) (Aalst et al. [7]). By using the example in Table 1, we can see that, most of the time, M5 is working with M6 (cases 1 and 2). However, it shows that M7 is not working with M12 although activity A2 follows activity H (cases 2 and 3). Accordingly, we can make a sociogram to indicate the machine relationships based on the frequency.
Resource assignment shows the relationship bet-ween resources and activity. Each resource (M) has a profile (i.e. activity-resource relationship matrix) based on how frequently they conduct specific activity (A). If a machine executed an activity, the activity is assigned to the machine. For example, in the example log, since M5 executed activity D in the case 1, 2, and 3, the activity D has a value of 3 for the relationship with M5.
Attribute Perspective
The aim of attribute perspective is to figure out some potential issues during the process execution. Attri-butes can refer to either activity or resource property. For example, waste produced in an activity, fuel indicator of a resource, etc. In addition, it can also point out the product quantity on each event. For example, some defects occurred in Op 40 - Install Sub Assemblies and caused the quantity of production lot decreased in the next activity.
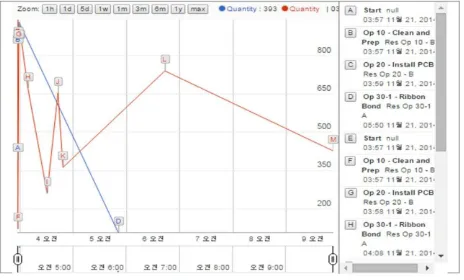
This study attempts to detect the production quan-tity over time. By using the annotation chart, we can show the fluctuation of quantity in the respective activity. The annotation chart plots the product quantity on each event and draw line between each plot. A decrement in the line of annotation chart shows some defects occurred in the previous acti-vities. On the other hand, an increment, which can be seen in particular condition, indicates product insertion during the process. Plotting the quantity in the start and the end of instance can derive the defective rate on production process. For example,
the process start with an activity named “Start” and end with “End”. Let L be an event log and es, en∊E. The notation es refers to an event that πA(e) =”Start” and en refers to an event that πA(e) =”End”. The productivity of each instance (�c) can be denoted as
eq. 4. In order get overall productivity, it requires to sum the productivity of each instance and divide with the number of cases. Let |C| be the number of cases. Thus, we can calculate it based on eq. 5.
�
(4)�̅
∑(5)
Evaluation and Interpretation
The evaluation and interpretation step takes the results and delivers them for decision makers to take action for further improvement. It should be noted that the process mining and analysis results deriving from the transaction logs can be various according to
manager’s requirements. Based on the results,
manufacturing manager can further improve the current production process.
Results and Discussion
This section describes the implementation of the manufacturing process analysis. First, it describes the data used for the implementation. Afterwards, we explain the step of implementation using the pro-posed process analysis framework. Finally, we show the result of the implementation.
Results
To show the application of the manufacturing process analysis framework, we conducted a case study. The case study is based on a generated events from a process model (https://www.promodel.com/ Products/ProcessSimulator). First, the process model is created using a process model notation, called business process modeling notation (BPMN). Next, the BPMN is used to generate a log of synthetic events. In this paper, we use a complex event processing engine, called Esper (http://esper.code-haus.org/), to generate the events.
Data Preparation
In the data preparation step, we selected only relevant data from production process and stored in the repository as manufacturing event log. The data
includes cases that has “Start” and “End” activity.
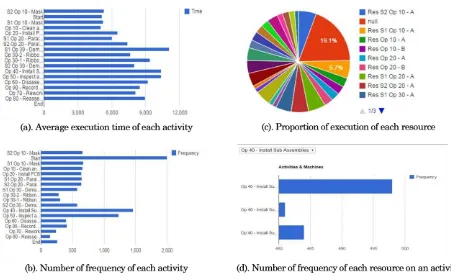
including process, resource and attribute, is des-cribed as follow. First, the basic performance ana-lysis based on the manufacturing event log, as shown in Figure 2, is shown. Next, the process perspective and resource perspective reused the existing algorithm in ProM. The attribute perspec-tive is added and has been applied in the web-based system using javascript technology. Next section shows the result of each perspective.
Process Perspective
Process perspective analysis is extracting a manu-facturing process model and providing some useful information about the model. Here, we derive manu-facturing processes by using process modeling algorithms i.e. Heuristic mining. Figure 3 displays the overall manufacturing process model derived by Heuristic miner. All the processes start with the
Start activity and finish with the End activity. The model is useful to provide general manufacturing flows as well as number of products passing between activities.
Resource Perspective
The goal of resource perspective analysis is to manage the machines on manufacturing processes in a balanced way. Figure 4 shows one fragment of organizational mining results, which are useful to visualize the relationship between activities and machines. Op 50 - Inspect and Test is performed by four resources called Res Op 50 – A, Res Op 50 – B, Res Op 50 – C, and Res Op 50 – D. With the result, managers can check whether machines were used for desired works by comparing the model with the standard machine assignment guideline in a company.
Attribute Perspective
The goal of attribute perspective analysis is to understand the pattern of potential attributes on manufacturing processes. Figure. 5 shows the quan-tity plot of some process instances using annotation chart. It shows that the quantity is decreasing from the Op 20 – Install PCB (Res Op 20 – B) to Op 30-1 Ribbon Bond (Res Op 30-1 A) (see the blue line from C to D). However, it also shows some quantity increment (See the red line from I to J). Using this graph, analysts can take some actions according to the production condition.
Discussions
This paper has attempted to apply the process analysis framework in a manufacturing industry. The result which is based on the synthetic log showed the applicability of the extended process
analysis framework. Based on the result, we endeavor to assist manufacturing organizations which intend to use process mining as their analysis tool. Therefore, we also investigated some prior works which is related to manufacturing sector to enrich readers who take the role of manufacturing analysts.
Rozinat et al. [1] introduced the application of
process mining in the test process of ASML’s wafer scanner. ASML, is the world’s leading manufacturer
of chip-making equipment and a key supplier to the chip industry [1]. The study applied process mining to the less structured processes of ASML. It also concluded that there is a need for alternative mining approaches for better process visualization. Son et al.
[2] have developed an independent process mining tool to analyze transaction logs from configurable manufacturing execution system (c-MES). A proto-type tool was presented and verified using a transaction log of a gear manufacturing process. Moreover, Son et al. [3] have attempted to apply process mining in manufacturing execution system (MES) by using the data collection from Samsung Electro Mechanic. The result showed a proposed process analysis framework. However, most of pre-vious works has excluded attribute perspective which is one of the important analysis for manu-facturing sector.
This paper extends the existing process analysis framework for manufacturing industries. Using the existing works, this paper intends to discuss four insights which are learnt from the experience of using the process mining approach. The next section describes each of the insights.
Four Insights Related to Manufacturing Pro-cess Analysis
As indicated earlier, previous works have applied manufacturing process analysis using process mining tool, ProM, in the manufacturing domain (Son et al. [2, 3]). Using synthetic log and real log, it changed the way we view the process analysis. In particular, we noted typical limitations of manufac-turing process analysis and pointed out what we can achieve when analyzing a process.
First Insight: Aiming a Process Model that Suits for Specific Purposes
Figure 2. Various basic performance analysis of manufacturing process
Figure 3. Process discovery based on event logs
Process model discovery on the basis of event logs comes out with a process model as a map. There may be highway maps, bicycle maps, tourist maps covering the same area. Some elements may not be shown while other elements are emphasized. Some maps may show a larger area with less detail whereas other maps show a smaller area with more details. Similarly, different process model are needed depending on the intended purpose (bottleneck analysis, auditing, simulation (Rozinat et al. [12]), etc.). Therefore, the discovery of a map is not as important as the ability to generate a map that suits specific purposes.
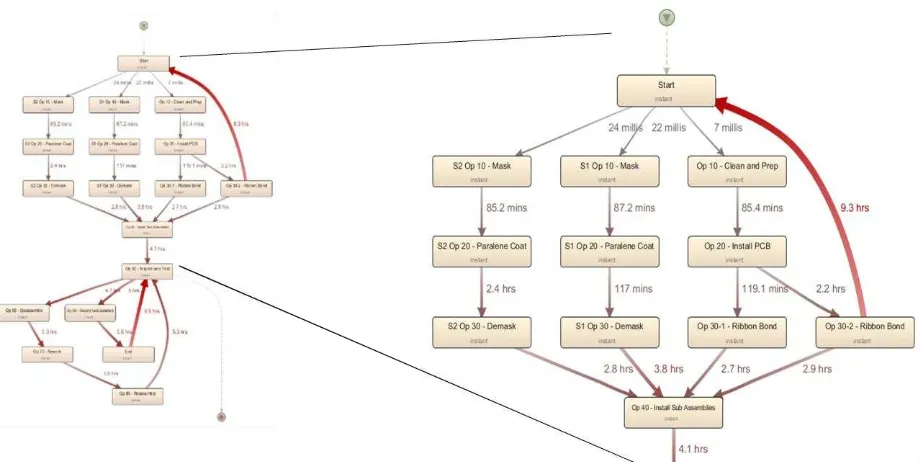
Figure 6 describes a process model derived from Disco (http://fluxicon.com/disco). Disco is a commer-cial software of process mining that uses abstraction concepts to discover the process model. Due to different types of measurement and the use of
activity and path threshold values, the Disco’s result
is slightly different from the result of heuristic mining. Using the same manufacturing event log as the mentioned analysis result, the process model maps the manufacturing process and shows the time performance of each activity. The line between two activities displays a number in a time unit and indicates the execution time of the earlier activity. The line thickness exposes how long the execution time in comparison to other activities. In other words, this process model is specifically intended to visualize the process in terms of time.
Second Insights: Using Hierarchical Decompo-sition to Obtain Abstract Process Model
Most process modeling notations support some notion of hierarchy. In principle, the hierarchy concepts are useful by allowing designer to show the general model at the upper level and hide details at the lower level. We explain this insight using the metamorphic relation between processes and maps mentioned earlier. Consider for example the zooming functionality of Google Maps. While we zoom out, insignificant things are either left out or dynamically clustered into aggregate shapes. On the other hand, important roads (e.g., highways) may be visible at all levels whereas insignificant roads disappear. Simi-larly, the process model can be aggregated to show the material flow between two processes in different location (e.g., buildings). The process model can also show the detail of material flow between activities in the lower levels. Therefore, the abstract process model, for example, generated from customer to supplier can resemble the supply chain process and the process model generated from each supply chain party represent the real process in its party. This insight clearly helps not only manufacturing ana-lysts to see the process but also supply chain analysts to perceive the knowledge of respective flows.
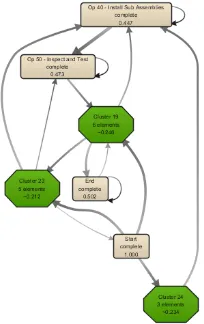
The process model in Figure 3 shows the overall processes whereas the process model in Figure 7
aggregates less frequent activities into a cluster. Process model in Figure 7 is derived using fuzzy mining. Readers who interested on fuzzy mining can refer to (Gunther and Aalst [13]). The result in Figure. 7 shows that the significant activities in the current manufacturing process are Op 40 – Install Sub Assemblies and Op 50 – Inspect and Test, regardless Start and End activity. The use of fuzzy mining assists manufacturing analysts to see the general overview of manufacturing processes. It becomes an important tool when the derived process is complex and unstructured. In this sense, the hierarchical decomposition leads analysts to see the most significant processes and provides more insights for further improvement.
Third Insights: Modeling Machines as if They are Humans Having Relationship on Doing Their Tasks
Process discovery is only merely about control-flow. In fact, we can model the resources relationship through control-flow dependency. Although simple mathematical model is enough to model resources, e.g., machines, people, working in an assembly line, it is inadequate when modeling resources involved in multiple processes and exposed to multiple priorities (Song and Aalst [11]). A resource which is involved in multiple processes needs to distribute their load, e.g., to schedule using least workload. Resources also do not work at constant speed. In most processes, one can easily observe that resources typically run on almost at the same time, under normal distribution. However, the condition could be varied according to some preemptive situation, e.g., breakdown, setup, etc.
Figure 2(d) shows the performance of three resources in activity Op 40 – Install Sub Assemblies. The chart represents the workload of each resource of a chosen activity and shows that the first resource have more loads than the other two. Using this bar chart, manufacturing analysts can take more actions to balance the resource workload.
Fourth Insights: Concrete Improvement for Failures that Disturb the Manufacturing Process
Process model, which is a result of process discovery, can show the real process according to the event logs. It means that the process model can represent some failures on the process flow. Failures are unavoi-dable, in particular, in manufacturing processes. Even though manufacturing organizations apply production management tool, e.g., Kanban, failures still tend to happen due to human activity. When the process is so complex, it is hard for analysts to see the failures of the process without analyzing the respective data. Thus, process mining is helpful for analysts to check and verify the manufacturing process and improve the process when failures occurred.
Process discovery tool provides many approaches to see the control-flow of respective process. Using heuristic mining, the dependency between activities, which is a frequency-based measurement, can show the existing of self-loop. For example, in Fig. 3, the activity S2 Op 20 – Paralene Coat indicated a self-loop for 18 times. Using other approach, i.e., fuzzy mining, there is an unintended flow from Op 30-2 Ribbon Bond to Start activity. The denoted res-pective time, which is 9.3 hours, is another issue that needs action from the analyst.
Figure 7. Abstraction process model using fuzzy mining
The attribute perspective, the additional perspective on MPA, also provides insights for concrete improve-ment. When the product quantity, mostly denoted as production lots, indicate some changes, analyst can verify the process in production floor and determine further actions for improvement. For example, in Figure 5, there is a significant quantity decrement from the Op 20 – Install PCB (Res Op 20 – B) to Op 30-1 Ribbon Bond (Res Op 30-1 A). In this particular condition, analyst can check the respective process to fix any failures during the operation. Since the analysis took place with static data, it is an open issue for developing monitoring and analysis tool for real time manufacturing environment.
Conclusion
In this paper, we posed the question “how can the concept of process mining be applied in a manufac-turing environment?” To address the question, we
show the application of manufacturing process ana-lysis through process mining. We applied the existing process mining techniques and proposed an event data visualization based on attribute perspec-tive using annotation chart. In addition, to address the lesson learnt from process mining, we exposed some insights related to the way analysis are conducted. These insights were identified while con-ducting the process mining analysis as well as several of process mining projects in the manu-facturing domain.
Previous works has validated the process analysis framework in the manufacturing process. The pro-cess analysis framework included data preparation, manufacturing process analysis and evaluation and interpretation. In this study, we extend the existing manufacturing process analysis, which originally consist of process perspective and resource per-spective, by adding attribute perspective. This study presented an example using synthetic log to examine the validity of the extended framework. In the result,
we eventually showed how process mining can benefit to manage the manufacturing processes.
First, the process perspective showed how each pro-duct pass along the manufacturing processes. Process model discovery, which used heuristic mining, discovered all the manufacturing process flows. The relevant behaviors based on the manufacturing event logs were also retrieved. Second, the resource perspective showed who perform an activity and how they are related to each other. The organizational mining displayed the relations of resources and performed activities. Third, the attribute perspective, which is the extension of existing work, illustrated more insightful result, in particular, about the product quantity during process execution. Finally, this study discussed four lessons learnt from process mining in manufacturing sector.
Using process mining techniques, we can discover a specific process model according to some require-ments, for example, a model that indicates bottle-necks. The models can get complex when the number of activities get bigger. Thus, a method using hierarchical decomposition could be used to obtain an abstract process model. Fuzzy mining, the tools to obtain an abstract process model, has been used to aggregate and abstract the number of information displayed in a model. Process mining can be used not only to extract a process model but also resource relationship (i.e., relations between workers or machines). The resource relationship was drawn in an organizational model based on the process facts. Finally, the process attributes, e.g., product quantity, can be visualized in a graph, i.e., annotation chart, to immediately notice the failures that disturb the manufacturing process. All these results have been shown by using the existing pro-cess mining techniques and the proposed visuali-zation tool for attribute perspective.
There are some challenges upon existing process mining. The current applications showed there is a need for alternative mining approaches for better visualization. Moreover, with the advanced techno-logy, manufacturing data are getting to bigger than ever. It is believed that big data in manufacturing will be a hot issue to extend and improve the current process mining techniques. Also, current process mining techniques are not customized to real-time analysis since it takes several complicated steps. So, it is necessary to develop real-time monitoring techniques for the manufacturing process.
Acknowledgment
References
1. Rozinat, A., de Jong, I.S.M., Gunther, C.W., and van der Aalst, W.M.P., Process Mining Applied to the Test Process of Wafer Scanners in ASML,
IEEE Transactions on Systems, Man and Cybernetics - Part C: Applications and Reviews, 39(4), 2009.
2. Son, S., Yahya, B.N., and Song, M., A Manufac-turing Resource Analysis in Configurable Manu-facturing Execution Systems, Proceedings of International Symposium on Green Manufactur-ing and Applications, Busan, Korea, 2014. 3. Son, S., Yahya, B.N., Song, M., Choi, S., Hyeon,
J., Lee, B., Jang, Y., and Sung, N., Process Mining for Manufacturing Process Analysis: A Case Study, Proceeding of 2nd Asia Pacific Conference on Business Process Management, Brisbane, Australia, 2014.
4. Aalst, W.M.P., Reijers, H.A., Weijters A.J.M.M., van Dongen B.F., Aalves de Mediros A.K., Song, M.S., and Verbeek, H.M.W., Business Process Mining: An Industrial Application, Information System, 32, 2007, pp. 713-732.
5. Aalst, W.M.P., Process Mining: Discovery, Con-formance and Enhancement of Business Pro-cesses, Berlin: Springer-Verlag, 2011.
6. Aalst, W.M.P., Weijters, A., and Maruster, L., Workflow Mining: Discovering Process Models from Eveng Logs, IEEE Transactions on
Know-ledge and Data Engineering, 16(9), 2014, pp. 1128-1142.
7. Aalst, W.M.P., Reijers, H.A., and Song, M., Discovering Social Networks from Event Logs,
Computer Supported Cooperative Work (CSCW), 14(6), 2005, pp. 549-593.
8. Aaslt, W.M.P., What Makes a Good Process Model?: Lesson learnt from Process Mining, Soft-ware and SystemModeling, 11(4),2012, pp. 557-569.
9. Hornix, P.T.G., Performance Analysis of Business Processes through Process Mining, Master thesis of Eindhoven University of Technology, 2008. 10.Weijters, A., Aalst, W.M.P., and de Medeiros, A.,
Process Mining with Heuristic Miner Algorithm, in BETA Working Paper Series, WP 166. Eindhoven University of Technology: Eindhoven, 2006.
11.Song, M., and van der Aalst, W.M.P., Towards Comprehensive Support for Organizational Mining. Decision Support System, 46(1), 2008, pp. 300-317.
12.Rozinat, A., Mans, R.S., Song, M., and van der Aalst, W.M.P., Discovering Simulation Models
Information Systems, 34(3), 2009, pp. 305-327. 13.Gunther, C.W., and Aalst, W.M.P., Fuzzy Mining
- Adaptive Process Simplification Based on