www.elsevier.comrlocaterapplanim
Behavioural differences in non-reproductive adult
females in a long-term selection experiment for
litter size in mice
W.M. Rauw
a,), P. Luiting
b, M. Bakken
a, T. Schuurman
c,
C.J.M. de Veer
d, O. Vangen
aa ˚
Department of Animal Science, Agricultural UniÕersity of Norway, P.O. Box 5025, 1432 As, Norway
b
Roslin Institute, Roslin, Midlothian, EH25 9PS, Scotland, UK
c
Human and Animal Physiology Group, Wageningen Institute of Animal Science, Wageningen, Netherlands
d
Ethology Group, Wageningen Institute of Animal Science, Wageningen, Netherlands
Accepted 9 September 1999
Abstract
In a previous study, it has been shown that adult, non-reproductive female mice from a line
Ž . Ž .
selected for high litter size at birth S-line have higher residual feed intake RFI than females of
Ž .
a non-selected control line C-line . Several studies have indicated that a higher RFI is related to a higher activity level. Differences in activity may suggest underlying differences in coping strategies. To investigate whether coping strategies have been affected as a correlated effect of selection for high litter size, 48 non-reproductive mature C- and S-line females were twice subjected to an open field, seven times to a maze, once to a social confrontation and twice to a runway test. In the second open-field test, S-line females crossed more squares than C-line females and were less reserved to enter the centre of the open field. In the maze tests, S-line females showed more locomotion activity than C-line females. They encountered dead-ends more often and returned more often to the starting area in the first maze test. No differences were found in their reaction towards an extra-maze cue change. In the social confrontation test, S-line females showed more locomotion activity, were less immobile and investigated the floor and opponent less than C-line females. S-line females ran faster in both runway tests than C-line females. These results suggest that the novelty response of S-line females is more dominated by an active coping style than that of C-line females. However, more tests, such as additional behavioural tests, physiological tests and neurobiological tests are required to be more conclusive on whether
)Corresponding author. Tel.:q47-64948000; fax:q47-64947960; e-mail: [email protected] 0168-1591r00r$ - see front matterq2000 Elsevier Science B.V. All rights reserved.
Ž .
selection for high litter size has resulted in mice that adopt the active coping strategy.q2000
Elsevier Science B.V. All rights reserved.
Keywords: Selection; Litter size; Coping behaviour; Resource allocation
1. Introduction
Ž .
In the study of Rauw et al. 1999 , it was shown that mature non-reproductive female
Ž .
mice of a line selected for high litter size have higher residual feed intake RFI than females of a non-selected control line. RFI is defined as the part of the feed intake that is unexplained by food requirements for maintenance and production, or in other words, as the difference between the feed that is consumed by an animal and its consumption as predicted from a model involving its growth and maintenance requirements. Variation in RFI can be caused by variation in partial efficiencies for maintenance and growth and by variation in metabolic food demanding processes not included in the model, such as behavioural activities, responses to pathogens and responses to stress. Since growth is virtually absent at maturity, the differences in RFI are mainly explained by differences
Ž .
in maintenance requirements Luiting, 1990 .
Ž .
In a divergent selection experiment on RFI in laying hens, Luiting et al. 1991
Ž .
observed higher activity-related heat production in the high RFI low efficiency line
Ž .
than in the low RFI efficient line: more than 50% of the variation in RFI could be
Ž .
explained by variation in physical activity. Findings by Morrison and Leeson 1978 and
Ž .
Braastad and Katle 1989 support these results: inefficient laying hens were more active than efficient hens. Variation in the amount of feed intake activity accounted for 44% of the variation in RFI in pigs: pigs with a low RFI visited the feed hopper less often and
Ž .
spent less time eating per day than pigs with a high RFI De Haer et al., 1993 ; these
Ž .
results are supported by Von Felde et al. 1996 .
Differences in activity levels suggest underlying differences in coping strategies. Coping can be defined as a behavioural and physiological reaction to aversive situations
Ž
and aims at retaining or re-establishing homeostasis Wechsler, 1995; Koolhaas et al.,
.
1997 . Behavioural strategies have been extensively described in mice selected
bidirec-Ž .
tionally for attack latency, particularly in males e.g., Benus, 1988; Sluyter et al., 1996
Ž .
and more recently also in females Compaan et al., 1993; Benus and Rondigs, 1996 .
¨
The correlated responses in a variety of other behavioural traits indicate the existence of a general underlying control mechanism determining complex behavioural strategiesŽSluyter et al., 1995 . Consequently, reciprocal selection for related behavioural traits,.
Ž .
such as nest-building behaviour Sluyter et al., 1995 , active shock avoidance acquisition
ŽDriscoll et al., 1990 and susceptibility to apomorphine Cools et al., 1990 have. Ž .
resulted in similar reciprocal correlated responses in coping behaviour. Large individual differences in the behavioural and physiological reactions to stressors are not restricted to rodent species. Evidence for the existence of different coping styles has been obtained
Ž . Ž . Ž
in pigs Hessing et al., 1993 , dairy cows Hopster, 1998 and great tits Verbeek et al.,
.
1996 .
In general, two coping strategies are distinguished: active and passive copers, which
Ž
.
et al., 1997 . Active copers tend to actively manipulate events, whereas passive copers tend to switch to passivity. In social confrontations, active copers respond by attacking
Ž .
the opponent or fleeing from a physically stronger opponent fightrflight reaction , whereas passive copers respond with ‘freezing behaviour’ or immobility
Žconservationrwithdrawal strategy . In non-social situations, the behaviour of active.
copers is less affected by changes in the environment. Active copers tend to develop routine behaviour; their behaviour is more intrinsically organised. The behaviour of passive copers is more dependent on external stimuli and hence their behaviour is more
Ž .
flexible Benus, 1988 . Active and passive copers differ furthermore for several
physio-Ž .
logical and neurobiological characteristics Benus, 1988 .
The aim of the present study was to investigate whether selection for high litter size at birth in mice has resulted, as a correlated effect, in a higher occurrence of behavioural characteristics indicative of an active coping style. Therefore, non-reproductive adult
Ž .
female mice of the line selected for high litter size S-line and of the non-selected
Ž .
control line C-line were subjected to three non-social tests and a social confrontation. We hypothesise that subjects from the S-line, which are characterised by a high RFI, will respond with a behavioural pattern more dominated by an active coping style when subjected to mild stressful situations, than subjects of the C-line.
2. Material and methods
Ž .
Two mouse lines of the Norwegian mouse selection experiment e.g., Vangen, 1993
Ž .
were used: a line selected for high litter size at birth S-line and a non-selected control
Ž . 3
line C-line . The mice were housed in cages of 30=12.5=12.5 cm filled with a layer of saw dust and had free access to pellet concentrate and water. The energy content of the feed was 12.6 kJ ME per gram and contained 21% crude protein, as specified by the producer. The mice originated from litters standardised at birth, when larger than eight pups, to eight pups per litter. The light was left on 24 h a day.
In the 91st generation, per line, from each of 12 litters one sister-pair was randomly
Ž .
chosen at weaning i.e., 3 weeks of age . Average total number of pups born was 10 and 21 in the C- and S-line, respectively. All animals were housed in sister-pairs until 10 weeks of age; thereafter they were housed individually. From 11–15 weeks of age, the females were subjected to an open-field procedure, a maze, a social confrontation and a runway test.
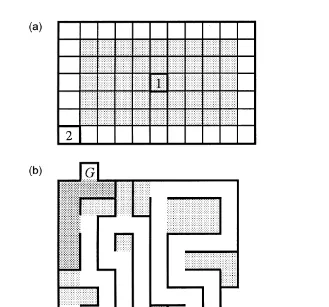
2.1. Test one: open-field test
A total of 24 females of each line were introduced individually into an open-field
Ž .
apparatus at 76 and 77 days of age OF1 and OF2 . The test duration was 30 seconds.
Ž 2.
The open field 70=110 cm was surrounded by 20 cm high, non-transparent walls
2 Ž .
and was divided into squares of 10=10 cm Fig. 1a . In OF1, the mice started in the
Ž .
Ž . Ž 3.
Fig. 1. a Design of the open-field test 70=110=10 cm . 1: starting point OF1; 2: starting point OF2. Dark
Ž . Ž 3.
area marks the centre of the open field. b Design of the maze test 55=55=10 cm . GsGoal box,
Ž . Ž .
SsStart box. Dark areas mark goal area below G and starting area above S . Light dark areas mark dead
Ž . Ž 3.
ends. c Design of the runway test 200=10=10 cm . SsStart box, GsGoal box. Distance in centimeters
Ž25 to 200 is marked..
days. During the 30 s observation period, the position of the mouse in the OF was registered every 5 s. From these data the following parameters were measured:
Ø Distance travelled as measured by the cumulative number of squares crossed in 5, 10,
Ž .
15, 20, 25 and 30 s OF1 and OF2
Ž .
Ø Total number of squares crossed in the centre of the OF in 30 s OF2
2.2. Test two: maze test
The same 24 females of each line were introduced individually into the start box of a
Ž .
maze at 80 to 86 days of age M1 to M7 . The test duration was 120 s. The maze
Ž55=55=10 cm3.had non-transparent walls and a transparent lid on top Fig. 1b . TheŽ .
lines were tested in rotating order. The testing sequence of all mice was similar for all
Ž .
stimulus male was visible for the experimental female subject when the goal area was entered. The same stimulus male was used during the whole procedure. The maze and the start box were cleaned at the end of every session. On the sixth day of the procedure the maze was rotated 908in the horizontal plane in order to confront the mouse with an
Ž .
extra-maze cue change test M6 . During M1 to M7 the following behavioural parame-ters were measured:
Ž . Ž .
Ø Latency time reaching the goal area s LGA
Ž . Ž .
Ø Latency time entering the goal box s LGB
Ž .
Ø Total time spent between reaching the goal area and entering the goal box s
ŽGA–GB.
Ž
Ø Maximum distance reached as a percentage of the total maze as considered
. Ž .
excluding dead-ends %REACHED
Ž .
Ø Total number of encounters in dead-ends before reaching the goal area DEAD-END
Ž
Ø Total number of returns to the starting area before reaching the goal area
RE-.
TURNS
2.3. Test three: social confrontation test
The same 24 females of each line were subjected to a social confrontation test at 92
Ž 3.
days of age. The test arena was a novel, unfamiliar clean cage 40=20=20 cm . Two females being unfamiliar to each other and no sisters were paired for 10 min. Behaviour was recorded on video. Mice with different coat colours were put together to facilitate the distinction between the animals on video, but were further randomly allocated to one
Ž .
of three interaction groups, each of which consisted of eight pairs of mice: 1 two S-line
Ž . Ž .
females, 2 two C-line females, and 3 an S-line female with a C-line female. Instantaneous sampling was used to measure the occurrence of behavioural elements every 10 s. The behaviours measured are listed in Table 1.
2.4. Test four: runway test
The same 24 females of each line were introduced individually into the start box of a
Ž .
runway at 100 and 101 days of age RW1 and RW2 . The test duration was 60 s. The
Table 1
Ž .
Behavioural elements measured in the social confrontation test after Benus, 1988 Behavioural element Explanation
Fighting Behaviour shown by each of the contestants when locked together: violent kicking, biting and wrestling behaviour
Submissive upright Sitting upright, head into the air, forepaws rigidly stretched out forward Immobility Absence of any movement
Social investigation Sniffing or nibbling any part of the opponent’s body Jumping Jumping, often to a wall
Upright Standing or sitting on hind legs, mostly making sniffing movements, with the nose up into the air
Sniffing Standing still with nose on the floor Locomotion Locomotion, no apparent direction
Ž 3.
runway 200=10=10 cm had non-transparent walls and a transparent lid on top
ŽFig. 1c . The goal box at the end of the runway was covered with saw dust. The lines.
were tested in rotating order. The testing sequence of all mice was similar for both testing days. Latency times to reach the 25, 50, 100, 150 and 200 cm marks of the
Ž .
runway were recorded Fig. 1c .
2.5. Data handling and statistical analysis
Ž .
The SAS program was used for the statistical analysis of all traits SAS, 1985 . Line differences for the individual traits were tested with the model: Yi jsmqLiqe , wherei j
Ž .
msoverall mean, Liseffect of line i control, selection and ei jserror term of
Ž 2.
animal j of line i, e NID 0,i j se . Yi j denotes all traits tested with this model, all as measured on animal j of line i: the cumulative number of squares crossed in 5, 10, 15, 20, 25 and 30 s in OF1 and OF2, the number of lines crossed in the centre of OF2, LGA, GA–GB, %REACHED, DEAD-END and RETURNS in M1 to M7, the frequen-cies of ‘fighting’, ‘submissive upright’, ‘immobility’, ‘social investigation’, ‘jumping’, ‘upright’, ‘sniffing’, ‘locomotion’, ‘grooming’ and ‘miscellaneous’ in the social con-frontation test, and the latency times for reaching 25, 50, 100, 150 and 200 cm of RW1 and RW2.
Trends and line differences in trends for cumulative number of squares crossed in
Ž .
OF1 and OF2 over time 5 to 30 s , LGA, GA–GB, %REACHED, DEAD-END, and
Ž Ž
RETURNS in the maze tests over testing day M1 to M7, excluding M6 extra-maze cue
.. Ž .
change , and latency times in RW1 and RW2 over distance reached 25 to 200 cm are tested by fitting linear regression functions to the data.
Contrasts are generated to compare cumulative number of squares crossed at 5, 10, 15, 20, 25, and 30 s in the open-field test and for reaching 25, 50, 100, 150 and 200 cm
Ž .
in the runway test between testing days OF1, OF2 and RW1, RW2 .
The effect of the extra-maze cue change on day 6 of the maze test is tested by means of t-tests testing ‘H : observed trait values0 sexpected values as estimated from the regression lines’ against the alternative hypothesis that the observed trait values on test day 6 differ from the expected values as estimated from the regression lines.
Latency times of animals that do not reach the goal area in the maze tests are arbitrarily set to 121 s, which is 1 s higher than the full testing time. Average GA–GB is
Ž .
estimated only from animals that reach both GA and GB within time i.e., within 120 s . Latency times for reaching, 25, 50, 100, 150 and 200 cm in the runway tests are estimated for all animals completing the runway within time and excluding individuals that return to the start box.
3. Results
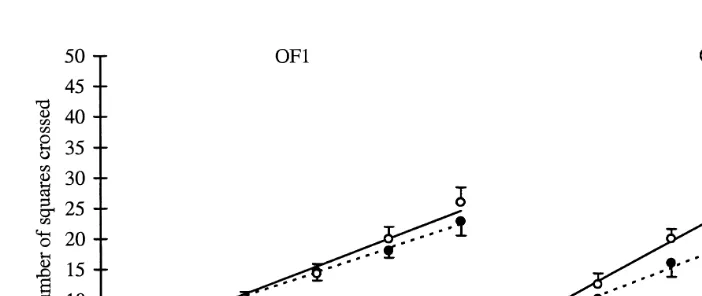
3.1. Test one: open-field test
Fig. 2. Average total cumulative number of lines crossed in 5 to 30 s and standard errors in open-field test 1
ŽOF1 and open-field test 2 OF2 . N. Ž . s24 per line.
number of squares crossed in 5 to 30 s. In OF2, S-line mice cross in total significantly
Ž . Ž .
more squares in 25 and 30 s P-0.05 and more squares in the centre of the OF 8.3
Ž .
than mice of the C-line 1.8; P-0.01 . Females of both lines cross more squares in
Ž .
OF2 than in OF1 P-0.001 .
R2 values of the linear regression functions relating cumulative number of squares
Ž .
crossed to time s are for C- and S-line females 55% and 51% in OF1 and 44% and 48% in OF2, respectively. Females of the selection line cross more squares per second
Ž0.18 and 0.31 in OF1 vs. OF2 than females of the control line 0.16 and 0.23 in OF1. Ž
. Ž .
vs. OF2 , but this is significant in OF2 only P-0.05 .
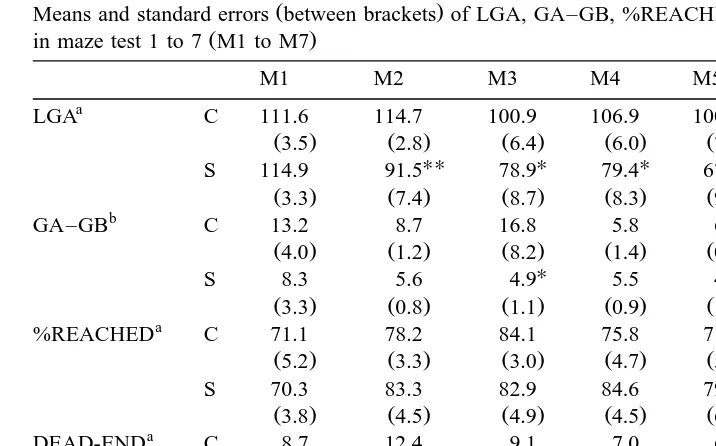
3.2. Test two: maze test
Average LGA, GA–GB, %REACHED, DEAD-END and RETURNS in M1 to M7 are given in Table 2. S-line females reach the goal area significantly faster than C-line females in M2 to M7, but this is significantly only in M2 to M5. R2 values of the linear
Ž Ž
regression functions relating LGA to testing day M1 to M7 excluding M6 extra-maze
..
cue change are for C- and S-line females merely 11% and 9%, respectively. Negative regression coefficients indicate that the mice reach the goal area faster in subsequent
Ž .
tests 5.2 and 6.2 s per test for C- and S-line females, respectively; P)0.05 . Females that fulfilled the maze did not always fulfil the maze or increase their latency times in subsequent tests.
Table 2
Ž .
Means and standard errors between brackets of LGA, GA–GB, %REACHED, DEAD-END and RETURNS
Ž .
in maze test 1 to 7 M1 to M7
M1 M2 M3 M4 M5 M6 M7
a
LGA C 111.6 114.7 100.9 106.9 100.7 81.3 79.2
Ž3.5. Ž2.8. Ž6.4. Ž6.0. Ž7.3. Ž8.4. Ž8.5.
%REACHED C 71.1 78.2 84.1 75.8 71.3 72.1 78.5
Ž5.2. Ž3.3. Ž3.0. Ž4.7. Ž5.6. Ž6.8. Ž6.1.
Before reaching the goal area, S-line females encounter dead-ends in the maze significantly more often than C-line mice in M1; no significant differences between the lines exist for M2 to M7. R2 values of the linear regression functions relating
Ž Ž ..
DEAD-END to testing day M1 to M7 excluding M6 extra-maze cue change are for C- and S-line females 16% and 30%, respectively. Negative regression coefficients
Ž
indicate that the females encounter fewer dead-ends in subsequent tests 0.9 and 1.6
.
dead-ends per test for C- and S-line females, respectively ; regression coefficients are
Ž .
significantly more negative in S- than in C-line females P-0.01 .
Before reaching the goal area, S-line females return more often to the starting area than C-line mice in M1; no significant line differences exist in subsequent tests. No significant trend exists over subsequent maze tests for RETURNS.
Ž .
None of the values for DEAD-END and LGA in M6 extra-maze cue change differ significantly from the expected values as predicted from the regression lines.
3.3. Test three: social confrontation test
Table 3
Ž .
Means and standard errors between parenthesis of frequencies of ‘immobility’, ‘social investigation’, ‘upright’, ‘sniffing’, ‘locomotion’ and ‘grooming’ in the social confrontation test. CsC-line; SsS-linea
Immobility Social investigation Upright Sniffing Locomotion Grooming
Ž . Ž . Ž . Ž . Ž . Ž .
C 0.0 0.0 8.1 0.8 4.5 0.5 13.5 0.7 3.9 0.3 0.1 0.1
UU UU UUU
Ž . Ž . Ž . Ž . Ž . Ž .
S 0.1 0.1 5.5 0.5 5.6 0.6 10.5 0.7 8.0 0.7 0.3 0.1
UU
P-0.01. UUU
P-0.001. a
Ns24 per line.
‘fighting’, ‘submissive upright’, ‘jumping’ and ‘miscellaneous’. No significant differ-ences exist between the lines for ‘grooming’, ‘immobility’ and ‘upright’. S-line mice score significantly higher for ‘locomotion’ and significantly lower for ‘sniffing’ and ‘social investigation’.
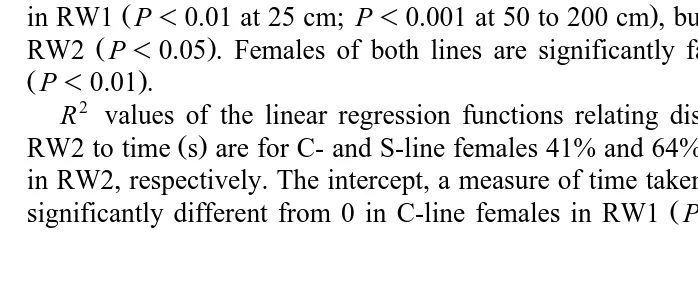
3.4. Test four: runway test
Ž .
Average latency times s for reaching the 25, 50, 100, 150 and 200 cm marks in RW1 and RW2 are given in Fig. 3. In RW1 three, and in RW2 one S-line female are excluded from the analyses because they returned to the start box. S-line females have lower latency times at all distances in RW1 and RW2. This is significant at all distances
Ž .
in RW1 P-0.01 at 25 cm; P-0.001 at 50 to 200 cm , but only at 150 and 200 cm in
Ž .
RW2 P-0.05 . Females of both lines are significantly faster in RW2 than in RW1
ŽP-0.01 ..
R2 values of the linear regression functions relating distance reached in RW1 and
Ž .
RW2 to time s are for C- and S-line females 41% and 64% in RW1 and 64% and 49% in RW2, respectively. The intercept, a measure of time taken before entering the RW, is
Ž .
significantly different from 0 in C-line females in RW1 P-0.001 , but not in S-line
Ž .
Fig. 3. Average latency times s for reaching 25, 50, 100, 150 and 200 cm and standard errors in runway test
Ž . Ž .
females and not in either line in RW2. In both tests, S-line females run significantly
Ž . Ž
faster 0.05 and 0.04 s per cm in RW1 vs. RW2 than C-line females 0.08 and 0.05 s
. Ž .
per cm in RW1 vs. RW2 P-0.01 .
4. Discussion and conclusions
Adult, non-reproductive female mice from a line selected for high litter size at birth
ŽS-line eat more than expected from feed requirements for maintenance and growth.
Ž . Ž .
than mice from a non-selected control line C-line Rauw et al., 1999 . Since growth is virtually absent at maturity, these differences in RFI are mainly explained by differences in maintenance requirements. Several studies have indicated that a higher RFI is related
Ž .
to higher activity levels e.g., Luiting et al., 1991; De Haer et al., 1993 . Differences in activity suggest underlying differences in coping strategies. For this reason, behavioural coping strategies have been investigated in non-reproductive mature C- and S-line females in four behavioural trials to investigate whether coping strategies have been affected as a correlated effect of selection for high litter size.
4.1. Consequences of selection for high litter size for coping behaÕiour in a noÕel
enÕironment
In the open-field test, the total number of squares crossed is a measure of locomotion activity. Passive copers show more immobility than active copers and will therefore show less locomotion. Furthermore, they will be less reluctant to enter the centre of the open field.
In the present study, no differences in locomotion activity exist between the lines in the first open-field test. In the second open-field test, when the situation is more familiar and explorative behaviour is less inhibited, locomotion is increased in both S- and C-line females. In the second open field S-line females are more active than C-line females and are less inhibited from entering the centre of the open field. These results suggest that the novelty response of S-line females is more indicative of an active coping style than that of C-line females.
Ž .
In a maze test, Benus 1988 found that it took passive copers significantly more time to reach the goal box and they made significantly less mistakes in doing so than the active copers. As a consequence, passive copers are expected to have longer latency times, reach a lower percentage of the total maze, encounter dead-ends less often and return less often to the goal area than active copers. The ‘freezing’ reaction in passive copers in social interactions will prolong the time spend between reaching the goal area, from where the male mouse is visible, and entering the goal box.
are less inhibited from entering the goal box after reaching the goal area. The behavioural pattern displayed by S-line females in the consecutive maze tests suggests that these mice react with a response more indicative of an active coping style than that of C-line females.
One of the most fundamental differences between active and passive copers is the
Ž .
degree to which behaviour is guided by environmental stimuli Koolhaas et al., 1997 . Active copers perform very consistently over subsequent trials and show hardly any increase in latency times and number of errors during these runs when an extra-maze cue change is conducted. This is in contrast to passive copers, whose performances are very variable over subsequent trials and are easily disturbed by changes in the
Ž .
environment Benus, 1988 .
In the present study, no line differences are found in the reaction towards the extra-maze cue change, suggesting no differences in dependency on external stimuli. However, the differences found between aggressive and non-aggressive male mice in
Ž .
their reaction to an extra-maze cue change in the study of Benus 1988 were found in mice which all reached the goal box errorless within 15 s before the extra-maze cue change was conducted. This criterion was not fulfilled in the present study.
Coping behaviour in social encounters is mainly described in male mice. Since aggressive behaviour is mediated through testosterone levels, females are not expected to display the same behaviour in a social confrontation. When fighting occurs, active copers are characterised by ‘fight’ or ‘flight’ behaviour, whereas passive copers will
Ž .
exhibit more ‘immobility’ and ‘submissive upright’ Benus, 1988 . Coping behaviour when fighting is absent has not been described clearly in the literature. Passive copers are expected to display more ‘sniffing’, ‘upright’ and ‘social investigation’ in order to gain information about the environment. Active copers are expected to show more ‘locomotion’ activity. ‘Jumping’ may be considered as a way to escape from the stressor and thus more ‘typical’ for active copers.
In the present study, in the social confrontation test, S-line females showed more locomotion activity than C-line females. C-line females were more immobile and investigated the floor and opponent more than S-line females. These results suggest that the behaviour of S-line females in a social confrontation is more related to an active coping style than the behaviour of C-line females. However, since no fighting occurred between C- and S-line females in the present study, this may not be a very good test to distinguish between female active and passive copers.
The runway test measures the locomotion activity, or speed, in a situation where the mice are undisturbed by dead-ends. Active copers will show more locomotion activity and will therefore be faster than passive copers. Moreover, they will be less reluctant to enter the runway and consequently have shorter latency times.
Summarised, the results of the present study suggest that long-term selection for high litter size has, to a certain extent, affected individual coping strategies in adult non-reproductive female mice as a correlated response. The behavioural differences as measured in the four behavioural trials point in the same direction: the results suggest that the novelty response of S-line females is more dominated by an active coping style than that of C-line females. However, more tests, such as additional behavioural tests
Že.g., measurement of circadian rhythmicity of activity , physiological tests measure-. Ž .
ment of stress-response in blood pressure, heart beat, and corticosterone concentrations ,
Ž .
and neurobiological tests e.g., measurement of apomorphine-induced stereotypies are required to be more conclusive on whether selection for high litter size has resulted in mice that adopt the active coping strategy.
4.2. A biological explanation to the relationship between residual feed intake and actiÕity leÕels
The results support the observation that animals with highest RFI have highest activity levels. This relationship can be explained by the Resource Allocation Theory
Ž .
developed by Beilharz et al. 1993 . Resources consumed by physiological processes
Že.g., maintenance, re production, physical activity, reaction to pathogens and stressorsŽ . . Ž
add to give the total amount of resources consumed e.g., feed intake, body tissue
.
mobilisation , since resources consumed by one process cannot be allocated to another process:
Rs
Ž
kA=A.
qŽ
kB=B.
qSŽ
kX i=X ,i.
Ž .
where Rstotal amount of available resources, ksresource conversion factor, kA=A
Ž . Ž
sresources used for maintenance, kB=B sresources used for production and S kX i
.
=Xi sresources used for processes other than maintenance and production. This equation shows a remarkable similarity with the equation for the calculation of RFI
Žaccording to Luiting and Urff, 1991 :.
FCs
Ž
b1=BW0 .75.
qŽ
b2=BWG.
qe,where FCsfeed consumption, BW0.75smetabolic body weight, BWGsbody weight gain, b and b1 2spartial regression coefficients representing maintenance requirements and requirements for production, respectively, and esresidual term representing RFI.
Ž .
When animals are re producing, traits such as egg weight, milk volume, litter size and litter weight should be included as covariates in the model.
This similarity implies that RFI quantifies the total amount of resources available to an animal for other processes than maintenance and production: animals with high RFI have more ‘buffer’ resources left for, e.g., physical activity and the ability to cope with
Ž .
unexpected stresses Luiting et al., 1997 . Indeed, laying hens with low RFI were less
Ž .
adapted to cope with high temperatures Bordas and Minvielle, 1997 , and had a weaker corticosteroid response but maintained elevated corticosterone levels for a longer time
Ž .
population on which the model is formed, an appropriate control population has to be defined. RFI can be used to quantify differences in buffer resources between, e.g., breeds, lines and housing systems. Estimation of RFI is a practical tool since in most
Ž
species body weight, feed intake and output traits such as eggs and milk weight,
.
number, volume are traits that are relatively easy to measure.
Ž .
Rauw et al. 1999 showed that adult non-reproductive males of the S-line have a higher RFI than males of the C-line. Adult males of the S-line show generally more activity in the maze test and the social interaction test, although mostly non-significant
Žunpublished results . These results suggest that with selection on a trait performed by.
females only, males are influenced to a lesser extent or only in the longer term. It is suggested that the fact that particularly females of the S-line increase their RFI during the adult period, compared to C-line mice and males of the S-line, may be an anticipation to the metabolically stressful and energy demanding periods ‘pregnancy’
Ž .
and ‘lactation’ to support a genetically highly increased litter size Rauw et al., 1999 . If this increase in RFI is not sufficient, available metabolic resources may drop consider-ably and the selected animals may be left with inadequate resources to respond to stress factors. Future research will investigate the resource situation and its consequences for behavioural strategies in lactating females.
Acknowledgements
This study has been supported by a grant from the Norwegian Research Council, project number 114258r111, ‘Consequences of selection for high litter size for the ability to cope in a stressful environment’. Kari Kjus is gratefully acknowledged for carrying out the Norwegian mouse selection experiment and her help in providing and maintaining the mice of the present study. Pieter Knap is most gratefully thanked for his useful comments on the manuscript.
References
Beilharz, R.G., Luxford, B.G., Wilkinson, J.L., 1993. Quantitative genetics and evolution: is our understanding of genetics sufficient to explain evolution?. J. Anim. Breed. Genet. 110, 161–170.
Benus, R.F., 1988. Aggression and Coping. Differences in Behavioural Strategies Between Aggressive and Non-aggressive Male Mice. PhD Thesis, Rijksuniversiteit Groningen, The Netherlands, 156 pp.
Benus, R.F., Rondigs, M., 1996. Patterns of maternal effort in mouse lines bidirectionally selected for¨
aggression. Anim. Behav. 51, 67–75.
Bordas, A., Minvielle, F., 1997. Reponse a la chaleur de poules pondeuses issues de lignees selectionnees pour´ ` ´ ´ ´
Ž . Ž .
une faible Ry ou forte Rq consommation alimentaire residuelle. Genet. Sel. Evol. 29, 279–290.´
Braastad, B.O., Katle, J., 1989. Behavioural differences between laying hen populations selected for high and low efficiency of food utilisation. Br. Poult. Sci. 30, 533–544.
Compaan, J.C., van Wattum, G., de Ruiter, A.J.H., van Oortmerssen, G.A., Koolhaas, J.M., Bohus, B., 1993. Genetic-differences in female house mice in aggressive response to sex steroid-hormone treatment. Phys. Behav. 54, 899–902.
Ž .
De Haer, L.C.M., Luiting, P., Aarts, H.L.M., 1993. Relations among individual residual feed intake, growth performance and feed intake pattern of growing pigs in group housing. Livest. Prod. Sci. 36, 233–253. Driscoll, P., Dedek, J., D’Angio, M., Claustre, Y., Scatton, B., 1990. A genetically-based model for divergent
stress responses: behavioral, neurochemical and hormonal aspects. Adv. Anim. Breed. Genet. 5, 97–107. Hessing, M.J.C., Hagelsø, A.M., Van Beek, J.A.M., Wiepkema, P.R., Schouten, W.G.P., Krukow, R., 1993.
Individual behavioural characteristics in pigs. Appl. Anim. Behav. Sci. 37, 285–295.
Hopster, H., 1998. Coping strategies in dairy cows. PhD Thesis, Agricultural University of Wageningen, Wageningen, The Netherlands.
Koolhaas, J.M., de Boer, S.F., Bohus, B., 1997. Motivational systems or motivational states: behavioural and physiological evidence. Appl. Anim. Behav. Sci. 53, 131–143.
Luiting, P., 1990. Genetic variation of energy partitioning in laying hens: causes of variation in residual feed consumption. World’s Poult. Sci. J. 46, 133–152.
Luiting, P., Urff, E.M., 1991. Optimization of a model to estimate residual feed consumption in the laying hen. Livest. Prod. Sci. 27, 321–338.
Luiting, P., Schrama, J.W., Van der Hel, W., Urff, E.M., 1991. Metabolic differences between White Leghorns selected for high and low residual feed consumption. Br. Poult. Sci. 32, 763–782.
Luiting, P., Decuypere, E., De Groot, P.N., Buyse, J., Room, G., 1994. Selection for feed efficiency and consequences for stress susceptibility. 45th Meeting of the EAAP, Edinburgh, UK, 7 pp.
Luiting, P., Vangen, O., Rauw, W.M., Knap, P.W., Beilharz, R.G., 1997. Physiological consequences of selection for growth. 48th Annual Meeting of the EAAP, Vienna, Austria, 21 pp.
Morrison, W.D., Leeson, S., 1978. Relationship of feed efficiency to carcass composition and metabolic rate in laying birds. Poult. Sci. 57, 735–739.
Rauw, W.M., Luiting, P., Verstegen, M.W.A., Vangen, O., 1999. Differences in feed resource allocation in a long-term selection experiment for litter size in mice: II. Developmental trends in body weight against feed intake. Submitted to Anim. Sci.
SAS, 1985. SAS user’s guide: statistics. Version 5. Sas Institute, Cary, NC, USA, 956 pp.
Sluyter, F., Bult, A., Lynch, C.B., van Oortmerssen, G.A., Koolhaas, J.M., 1995. A comparison between house mouse lines selected for attack latency or nest-building: evidence for a genetic basis of alternative behavioral strategies. Behav. Genet. 25, 247–252.
Sluyter, F., van Oortmerssen, G.A., de Ruiter, A.J.H., Koolhaas, J.M., 1996. Aggression in wild house mice: current state of affairs. Behav. Genet. 26, 489–496.
Vangen, O., 1993. Results from 40 generations of divergent selection for litter size in mice. Livest. Prod. Sci. 37, 197–211.
Verbeek, M.E.M., Boon, A., Drent, P.J., 1996. Exploration, aggressive behaviour and dominance in pair wise confrontations of juvenile male great tits. Behavior 133, 945–963.
Von Felde, A., Roehe, R., Looft, H., Kalm, E., 1996. Genetic association between feed intake and feed intake behaviour at different stages of growth of group-housed boars. Livest. Prod. Sci. 47, 11–22.