www.elsevier.comrlocaterapplanim
The spontaneous qualitative assessment of
behavioural expressions in pigs: first explorations of
a novel methodology for integrative animal welfare
measurement
F. Wemelsfelder
a,), E.A. Hunter
b, M.T. Mendl
c,
A.B. Lawrence
aa
Scottish Agricultural College Edinburgh, West Mains Road, Edinburgh EH9 3JG, UK
b
Biomathematics and Statistics Scotland, West Mains Road, Edinburgh EH9 3JZ, UK
c
Department of Clinical Veterinary Science, UniÕersity of Bristol, Langford House, Langford,
Bristol BS40 5DU, UK
Accepted 8 September 1999
Abstract
Qualitative assessments of behaviour integrate and summarize the different aspects of an animal’s dynamic style of interaction with the environment, using descriptors such as ‘timid’ or ‘confident’. Although such qualitative terms are widely used in the study of animal temperament and personality, their use in relation to questions of animal welfare has yet to be formally
Ž .
explored. The terms used in integrative assessment e.g., content, distressed tend to have expressive, welfare-related connotations, and lie at the heart of the lay public’s concern for animal suffering. For this reason they are frequently dismissed as ‘anthropomorphic’ and unscientific. However, in theory it is possible that these terminologies reflect observable aspects of behavioural organization. They may therefore be liable to scientific analysis, and be of use as integrative welfare measurements. A first step in investigating this hypothesis is to examine the inter-observer reliability of assessments of behavioural expression. This study investigated the extent to which 18 naive observers showed agreement when given the opportunity to qualitatively describe, indepen-dently and in their own words, the behavioural expressions of 20 individual growing pigs. Pigs were brought singly into a test pen and given the opportunity to interact with a human squatting in the centre of the test pen. Observers were instructed to first observe each pig and then to write
)Corresponding author. Animal Biology Division, SAC, Bush Estate, Penicuik EH26 0PH, Scotland, UK. Tel.:q44-131-535-3229; fax:q44-131-535-3121; e-mail: [email protected]
0168-1591r00r$ - see front matterq2000 Elsevier Science B.V. All rights reserved. Ž .
down terms which adequately summed up the emergent qualities of that pig’s behaviour. Data thus consisted of 18 sets of individually generated descriptive terms, attributed to 20 pigs. This procedure was repeated a month later with the same observers but using a new group of 20 pigs. To analyze the resulting 36 sets of descriptive terms, pigs in each set were given a score for each
Ž . Ž .
term. This score was either 0 term not used for that pig or 1 term used for that pig . These data
Ž .
were analyzed with Generalized Procrustes Analysis GPA , a multivariate statistical technique
Ž .
which finds a consensus between observer assessment patterns the ‘pig consensus profile’ , and provides a measure of observer agreement. Results show that for each group of 20 pigs, the ‘pig consensus profile’ differed significantly from an analysis of the same data in randomized form
Žp-0.001 , indicating that the consensus profiles were not artifacts of the GPA procedures. It.
can therefore be concluded that observers showed significant agreement in their spontaneous assessment of pig expressions, which suggests that these assessments were based on commonly perceived and systematically applied criteria. The extent to which these shared criteria reflect observable aspects of behaviour now requires further study. q2000 Elsevier Science B.V. All
rights reserved.
Keywords: Animal welfare; Temperament; Personality; Behavioural expression; Qualitative measurement;
Free-Choice-Profiling; Generalized Procrustes Analysis
1. Introduction
The qualitative assessment of behaviour is based upon the integration by the observer of many pieces of information which in conventional quantitative approaches are recorded separately, or are not recorded at all. This may include incidental behavioural events, subtle details of movement and posture, and aspects of the context in which behaviour occurs. For example, a ewe separated from her lamb in the hills will walk about with her ears pricked up, stopping frequently to look around, bleating loudly, all the while appearing agitated, anxious and distressed. Qualitative assessment thus specifies not so much what an animal does, but how it does what it does, i.e., its
Ž
dynamic style of interaction with the environment Thomas and Chess, 1977; Feaver et .
al., 1986; Wemelsfelder, 1997a .
This form of assessment has been developed by scientists mainly to study animal temperament and personality. Assessment in this context is typically of retrospective character; on the basis of recollections of how individual animals have behaved over previous time periods, observers sum up the behavioural style of these animals as for
Ž
example boldrshy, or sociablersolitary e.g., Buirski et al., 1978; Stevenson-Hinde and Zunz, 1978; Feaver et al., 1986; Gold and Maple, 1994; McGuire et al., 1994; Dutton et
.
al., 1997; Coleman and Wilson, 1998; Gosling, 1998 . Such qualifications are inter-preted as ‘traits’ of one or more underlying dimensions of temperament or personality, which in turn are interpreted as ‘predispositions’ for certain response styles. Thus, ‘boldness’, ‘shyness’ and ‘sociability’ are not primarily regarded as concrete be-havioural phenomena which are immediately present for observation, but rather as
Ž abstract ‘intervening variables’ in causal, reductionist accounts of behaviour e.g.,
.
point out that terms for long-term personality traits also reflect temporary emotional Ž
states, and speak of ‘emotional descriptions’ in this context e.g., Buirski et al., 1978; .
Plutchik, 1980 . Nevertheless, these authors, in line with personality theory, conceive of emotions not as concrete phenomena but as ‘‘hypothetical constructs whose properties
Ž .
are inferred on the basis of various kinds of evidence’’ Plutchik, 1980, p. 6 .
We suggest however that qualitative terminologies of behavioural style may have a
Ž .
stronger observational i.e., empirical foundation than is currently recognized, and that such terminologies have an important, as yet unexplored potential as a research tool in the field of animal welfare. As the example of the ewe isolated from her lamb illustrates qualitative assessment, in summarizing the animal’s dynamic style of interaction,
Ž .
describes behaviour as an expressiÕe process Wemelsfelder, 1997b . Expressions such
as calmness or agitation not only appear to exist in retrospective abstraction, they also seem apparent in direct observation at any moment in time. The expressiveness of behaviour can then be seen to fluctuate with changing conditions, showing subtle shifts not easily captured by fixed trait typologies. Fear, anxiety, tension and distress may all appear when the ewe searches for her lamb, shifting into a more calm, relaxed and content state when she finds it. Thus, the qualitative summarizing of an animal’s ongoing behaviour apparently characterizes the animal’s experience of a particular situation, and as such tends to reflect on its welfare. Behavioural science traditionally distrusts such assessments of animal experience, regarding them as ‘anthropomorphic’
Ž .
judgments of uncertain validity Heyes, 1993 . However, in theory it is possible that these assessments are based on direct and biologically valid observation, and may be of
Ž .
use as integrative welfare measurements cf. Morton and Griffiths, 1985 .
A first step in testing this hypothesis is to determine the extent to which assessors agree when asked to observe and describe the behavioural expressions of animals. It is vital that this assessment should both be spontaneous and independent. Only if observers are free and unbiased in their choice of terms is it possible to determine the extent to which their qualitative summaries of behaviour concur. If observers use pre-set rating
Ž .
scales as is habitually done in studies of temperament and personality , they are forced to project preconceived qualifications on to the animal’s behaviour, and the integrative character of qualitative assessment is prejudiced and obstructed. If observers are on the other hand free to generate their own terms, they can observe behaviour unhindered, integrate perceived details of behaviour and context, and then, finally, conceive of a term which in their view best sums up the animal’s expression. This makes it possible to investigate whether individual observers have similar ways of integrating perceived details of behaviour into qualitative descriptors. If good agreement is found, further research into the empirical foundations of qualitative assessment is warranted.
A second aim of this study was to identify a statistical technique capable of dealing with the ‘free-choice-of-variables’ conditions described here, with as little intervention of the experimenter as possible. It was brought to our attention that a statistical
Ž .
technique called Generalized Procrustes Analysis GPA seemed well-suited to this task.
Ž .
GPA is a technique widely used in sensory research see for example Muir et al., 1995 , where it is often associated with an experimental procedure called
‘Free-Choice-Profil-Ž .
ing’ Arnold and Williams, 1985; Oreskovich et al., 1991 . This procedure allows assessors to describe food qualities in their own terms, and GPA is designed to find agreement between assessors by comparing patterns of response in individual data
Ž .
matrices see Section 2 for details . Thus, GPA analysis of observer agreement does not rely on the meanings of observer terms, but on parameters describing how observers apply these terms to distinguish between pigs. This makes it an eminently suitable research tool to investigate the empirical validity of spontaneous assessments of animal expression. If our application of GPA to behaviour data were successful, the proposed method of qualitative assessment could bridge scientific and public understandings of animal welfare, and open up new avenues of research on a range of animal behaviour questions.
2. Methods
This study consisted of two consecutive trials, in each of which 18 observers assessed the behavioural expressions of 20 growing pigs. The same observers were used in both trials, and therefore strictly speaking these trials were not replicates but rather two parts of one study. Part 2 took place 1 month after Part 1 had finished, using a new set of pigs to present to observers. These pigs were housed under identical conditions and of similar age and weight as the pigs in Part 1. Experimental procedures in Part 2 were also identical to those of Part 1. Below therefore we describe the experimental details of Part 1, which also represent those of Part 2.
2.1. Animals and housing
Experimental subjects were 20 Large White=Landrace female growing pigs of
Ž .
around 15 weeks of age and with weights ranging from 25 to 35 kg average 30 kg at the beginning of the experiment. Pigs were housed in the same experimental room, which was maintained at a temperature between 178C and 208C throughout the experi-ment. Two treatment groups were created at the start of the experiment by dividing the pigs into two groups of 10 which were balanced for weight. One group was housed in a
Ž .
pen of 4=3 m. with a bare concrete floor ‘unenriched’ environment , while the other group was housed in a pen of 10=3 m., which was half-filled with straw and contained
Ž
objects for manipulation such as fresh branches, car tires and metal chains ‘enriched’ .
supply of water and food appropriate to their age. Food was provided at 8:30 a.m. each day and pens were cleaned at approximately 9:00 a.m. The bare concrete floors were scraped clean, while soiled straw and branches were removed from the enriched pens and replaced with fresh material.
2.2. Experimental procedure
Pigs were kept in their housing environments without experimental intervention for the first 3 weeks of the experiment. During weeks 4 and 5 they were trained daily to be separated from their pen mates and to spend 7 min in a test pen situated in an adjacent experimental room. This room was kept at the same temperature as the room containing the home pens. The test pen measured 4=4 m with a bare concrete floor, and was surrounded by wooden observation screens. Training schedules were balanced for treatment and time of day.
Ž .
Testing took place in week 6, on two consecutive days 10 pigs per day . Pigs were taken from their home pen and brought into the test pen singly in random order, but never with more than two pigs from the same treatment consecutively. Each pig for 7 min had the opportunity to interact with a human interactor squatting in the centre of the test pen. This human interactor was familiar to the pigs from the previous training sessions but had avoided interacting with the pigs, and the experimental situation was therefore new to the pigs. Guidelines for the interactor’s behaviour could not be rigidly standardized, as individual pigs showed very different patterns of approach and interac-tion. As a general rule, the interactor took a passive role, responding to interactions elicited by the pig. If the pig looked at her or approached she would extend a hand towards it. If the pig remained close and initiated further interaction, she would pat its nose, head or back, or extend her face towards the pig. If the pig became aggressive and inclined to bite she would push it off and remain passive until the pig again initiated interaction.
The same 18 observers were used in both parts of the study. These observers were
Ž .
graduate zoology and psychology students six male and 12 female , none of whom had previous experience in the observation of pigs. In a room adjacent to the experimental area, observers were given approximately 1 h of instruction at the start of this study. They were told that the experiment was part of a research programme aimed at developing a methodology for the assessment of behavioural expressions in animals, and that a first step was to give a group of untrained observers complete freedom in generating terms for the description of pig expressions. Behavioural expression was defined as style of interaction, i.e., the way in which an animal behaves, and observers were given a few examples to underline the behavioural character of this definition. To ensure independence of assessment however, steps were taken to ensure that observers refrained from further discussion of terms during the experiment. At no point were observers given any information about the different environmental backgrounds of the pigs, nor were they at any point able to see pigs and their housing environments on the experimental farm.
4 min, and then, after a signal, had 3 min to write down terms which in their view best summed up the expressive qualities of that pig’s behaviour. They were free to choose as few or as many terms as they wanted for each pig, and to repeat the use of terms or select new terms for each pig as they saw fit. Each individual observer thus generated a set of terms describing 20 pigs. In Part 2, observers were asked to repeat this procedure of assessment with a new set of 20 growing pigs.
2.3. Method of analysis
2.3.1. General outline
Data for each part of the study consisted of 18 sets of individually generated descriptive terms. The terms in these sets differed in number and kind, but were all attributed to the same 20 pigs. To analyse this information, a multivariate statistical technique which does not rely on fixed variables was required. GPA is such a technique ŽGower, 1975; Gower and Dijksterhuis, 1994; Arnold and Williams, 1985 ..
GPA can be thought of as a pattern detection mechanism, and is based on the Ž .
assumption that even if observers use different variables terms for measurement, the Ž .
distances between samples pigs as specified by the various measurements are compara-ble, because the samples are the same. In other words, GPA takes for granted that measurement patterns all dealing with the same samples will converge, and is designed
Ž
to compute the coordinates of the convergent configuration the so-called ‘consensus .
profile’ . Thus, GPA detects the level of consensus between observer assessment
Ž . Ž
patterns not on the basis of fixed variables terms , but on the basis of the
multi-dimen-. Ž
sional inter-sample distances specified by each observer i.e., how each observer uses .
hisrher terms to score pigs .
2.3.2. Statistical procedures
Ž To prepare the 18 sets of individual terms for analysis by GPA, 18 data matrices one
. Ž .
for each observer were created. Each matrix was defined by the number of pigs 20 , and by the total number of terms used by that observer to describe those pigs. Each pig
Ž .
was then given a score for each term; this score was either 0 term not used for that pig
Ž .
or 1 term used for that pig . Thus, each of the 18 data matrices consisted of 20 rows containing 0r1 sequences of varying length and order.
To compare these matrices GPA transforms each matrix into a multidimensional geometric configuration. Each configuration has as many dimensions as it has terms, and the 20 pigs in each matrix are represented as points in this multidimensional space. Columns of zeros are added to individual matrices, so that all observer configurations acquire equal dimensionality. The 18 configurations thus obtained are then matched to
Ž each other by GPA through a series of iterative mathematical transformations
transla-.
tion, rotationrreflection and scaling , while preserving relative intersample relationships
Ž .
by GPA in the so-called Procrustes Statistic. This statistic reflects the degree of
Ž .
similarity as regards projected geometric distances between pigs between transformed observer configurations and the consensus profile. The larger the Procrustes Statistic, the
Ž
more the observers agree about the configuration of pigs but not necessarily about .
descriptive terms, see below . In Appendix A, these successive steps of GPA transforma-tion and testing are illustrated with a simple example, in which two observers each use two terms to describe four pigs.
As indicated above, GPA is designed to find a consensus between any given set of matrices, regardless of how variable the data are. Hence its name: Procrustes was a Greek innkeeper in Attica who managed to always fit his guests into his one-size beds by tying them to the ironwork and either cutting or stretching their legs as necessary ŽOreskovich et al., 1991 . Thus, the danger exists that the established consensus profile. could be an artifact of the statistical technique rather than a significant feature of the data set.
Evaluation of the significance of a computed consensus profile and its
‘goodness-of-Ž .
fit’ is possible through a randomization test Wakeling et al., 1992 . By analyzing the original data in randomized form a large number of times, GPA derives a Procrustes Statistic for a random association between matrices. The significance of the consensus profile can then be tested against this ‘random-association’ statistic, using a Student’s
Ž .
t-test one-tailed . We took a probability of -0.001 to indicate that the consensus profile was a meaningful feature of the data set and not a statistical artifact.
The Procrustes Statistic also provides information about the extent to which each of the individual observers contributed to, or distracted from, the final consensus. GPA provides a Procrustes Statistic for each pair of transformed observer configurations, which can be thought of as a measure of the distance between these observers relative to the consensus profile. A triangular table is formed, giving the distances between each
Ž .
possible pair of observers cf. tables of distances between towns in a road atlas . Ž .
Principle Coordinate Analysis PCO of these relative observer distances then makes it
Ž . Ž
possible to map the observers in preferably two sometimes more dimensions the
. Ž
ObserÕer Plot . Using robust methods i.e., methods which are not influenced by .
outliers it is possible to estimate the centre of distributions of observers together with a standard deviation, and thus to draw a 95% confidence region. Observers lying outside this region are potentially outliers, that is in some sense they may differ from the other
Ž
observers in their assessment of the samples Williams and Langron, 1984; Arnold and .
Williams, 1985; Gains and Thomson, 1990 .
As indicated above it should be kept in mind that the observer distances represented in an observer-plot are relative to that particular group of observers. Axes reflect GPA scaling values and have no absolute meaning. If valid reasons exist for excluding an
Ž .
outlier from analysis e.g., an observer may be of a different professional background , GPA can be re-run and the new consensus profile can be assessed for significance.
A first step towards interpretation is to reduce the number of dimensions of the Ž
consensus profile through conventional Principal Component Analysis see for example .
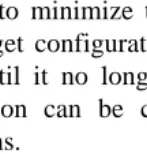
Stevenson-Hinde and Zunz, 1978 . PCA determines which are the principal axes of the consensus profile, and how much of the variation between pigs each of these axes explain. This information is reflected in several two-dimensional Pig Plots which show the distribution of the 20 pigs along the principal axes of the consensus profile. A standard error ellipse can be drawn indicating the reliability of each pig’s position on the two axes. Again at this point these axes are still defined purely in terms of their geometrical properties. Their coordinates reflect relative GPA scaling values, and bear as yet no relationship to semantic referents.
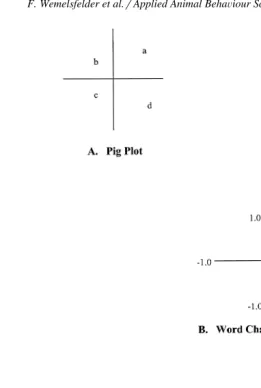
The second step however is indeed to confer semantic meaning unto the principal axes of the consensus profile. This is not done by somehow pooling the terms of individual observers into one common terminology; it is done by calculating how the coordinates of the consensus profile correlate with the coordinates of each of the 18 original individual data matrices. This analysis results in 18 two-dimensional Word
Ž .
Charts one for each observer . In each chart, all terms of a particular observer are
Ž .
correlated to the first two or the 3rd and 4th principal axes of the consensus profile. The higher a term’s correlation with an axis, the more weight it has as a descriptor for that axis. Thus, 18 independent Word Charts for the description of the consensus profile are obtained for comparison and interpretation.
The degree of semantic convergence between these charts indicates the extent to which individual observers concur in their descriptions of the pigs’ behavioural expres-sions. For example, in one observer’s chart the terms confidentrplayful may show the highest correlation with the consensus profile’s main axis, while in another observer’s chart the terms assertiverboisterous take this place. Even though these are different terms, they have similar meaning, and the two observers seem to agree about what they saw. If another observer however would describe the main axis in terms of uncertainr re-stless, disagreement obviously occurred. In principle it is possible to find a valid consensus profile for which observers show poor semantic agreement, and which Ž therefore makes little sense. An important second measure of observer agreement in
.
addition to the Procrustes Statistic therefore is whether the Word Charts of individual observers converge in semantic structure and tone.
main axes that one pig is ‘more’ or ‘less’ confident than another, the numerical values defining a pig’s position in a Pig Plot have no meaning outside that particular plot. GPA first and foremost is designed to compare and evaluate qualitatiÕe assessments of
particular sample sets, and as such seems perfectly suited to the aims formulated in this paper.
3. Results
It is conventional in statistical expositions of GPA to present Sample Plots first and Observer Plots last, however as the central theme of this paper is the inter-observer reliability of spontaneous assessments of behavioural expression, it appears more suitable to present Observer Plots and Word Charts first, followed by Pig Plots.
3.1. ObserÕer Plots
The Procrustes Statistic for the consensus profile of Part 1 is 80.95, meaning that its ‘goodness-of-fit’ explains 80.95% of the total variation between observer matrices. The mean of 100 randomized profiles explains 76.75% of the variation between matrices, with a simulation variation of 0.03. A one-tailed Student’s t-test shows that the
Ž consensus profile of Part 1 differs significantly from the randomized profiles dfs99,
.
ts23.39, p-0.001 . The Procrustes Statistic for the consensus profile of Part 2 is 84.79, while the mean randomized profile explains 83.30% of the variation between observer matrices with a simulation variation of 0.01. The consensus profile of Part 2
Ž
also differs significantly from the randomized profiles one-tailed Student’s t-test, .
dfs99, ts14.47, p-0.001 .
These results show that neither of the consensus profiles is an artifact of GPA procedures. While given the freedom to choose their own vocabularies, observers showed significant agreement in their use of these vocabularies to quantitatively score the pigs’ behavioural expressions.
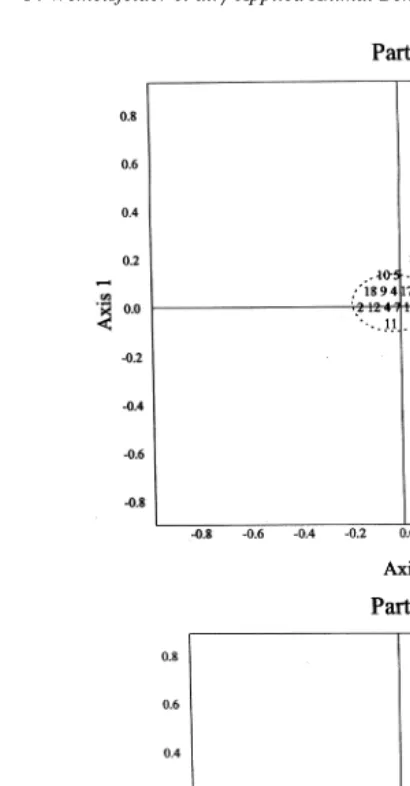
Fig. 1 shows the Observer Plots for Parts 1 and 2 of this study. These plots reflect the relative distance between individual observers as a measure of the level of consensus between individual observer assessments. Numbers represent individual observers, while the dotted circles enclose a 95% confidence region for what may be considered the ‘normal population’ of observer assessments. The Observer Plots of both parts of the study generally indicate good consensus, as most observers fall within this confidence
Ž
region. A few outliers appear nos. 6, 8 and 13 in Part 1, and nos. 10, 13, 16, 18 in Part .
Fig. 1. Observer plots for Parts 1 and 2. Axes reflect GPA scaling-values for relative observer distance. Numbers represent individual observers. The dotted circle reflects a 95% confidence region for what may be considered the ‘normal population’. Observers positioned outside this region may be seen as ‘outliers’.
3.2. Word Charts
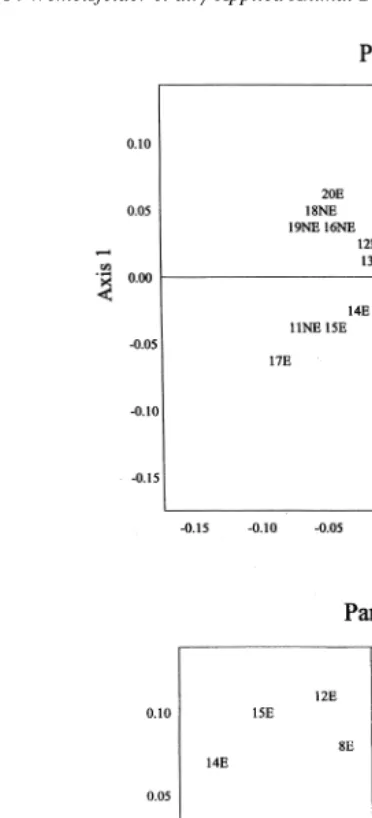
As it is impossible to show the Word Charts of all 18 observers, Fig. 2A and B
Ž .
present as examples the charts of Observer 5 as indicated in Fig. 1 , which describe the consensus profiles of Parts 1 and 2, respectively. The axes of a Word Charts reflect the first two principal axes of the consensus profile, and indicate which of this observer’s terms best correlate with those axes.
‘interested’ and ‘inquisitive’ to ‘disinterested’ and ‘relaxed’. In Part 2, he characterizes the first axis of the consensus profile as ranging from ‘friendly’ and ‘inquisitive’ to ‘restless’ and ‘cautious’, while the second axis in his view ranges from ‘bold’ and ‘playfulrrough’ to ‘relaxed’ and ‘gentle’. Thus, the axes of both consensus profiles as defined by this observer provide a meaningful framework for the description of pig behavioural expression. One anomaly in the Word Chart of Part 2 is the location of ‘happy’ in between ‘anxious’ and ‘agitated’; however, given the relatively low correla-tion of this term with both axes, it does not detract from the overall meaningfulness of the framework.
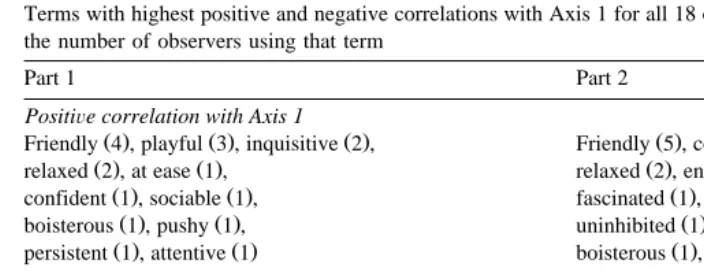
In addition to this particular example some information should be given as to how similar or different the other observer Word Charts were. Table 1 therefore lists for all 18 observers which two terms of their vocabulary showed the highest positive and negative correlation with Axis 1, for both consensus profiles. For example, ‘friendly’ was the best descriptor of the positive end of Axis 1 for four observers in Part 1, and for five observers in Part 2. On the negative end of Axis 1, four people used ‘nervous’ in Part 1, but only one person did so in Part 2.
From this list it is evident that the terms on either side of Axis 1 are similar in tone.
Ž .
A considerable number of observers choose identical terms e.g., ‘friendly’, ‘nervous’ . Ž Where different terms are chosen the meanings of these terms are either very close e.g.,
.
‘confident’r‘uninhibited’, ‘relaxed’r‘at ease’, ‘agitated’r‘restless’ , or are similar in general tone reflecting different aspects of the expressive repertoire. ‘Friendly’ is not the same as ‘relaxed’ or ‘playful’, nor does ‘suspicious’ have the same meaning as ‘distressed’. Yet a friendly pig is likely to appear relaxed rather than tense and to be playful rather than unsettled. Thus, terms in one group, though not always identical, have a complementary relationship: together they provide a coherent and comprehensive characterization of different poles of pig behavioural expression. One term does seem to fall out of line: the use of ‘interested’ in Part 1 at the negative end of axis 1 appears anomalous, especially in contrast to ‘disinterested’. However, it is conceivable that pigs appearing suspicious, unsettled and cautious in their response to a novel stimulus also appear highly interested in that stimulus.
In sum the Word Charts indicate that untrained observers, given complete freedom to generate their own terms, show good semantic agreement in the way they use their terminologies as coherent frameworks for the description of pig behavioural expression.
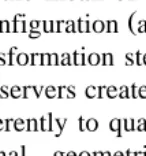
3.3. Pig plots
Fig. 3 shows the Pig Plots for Parts 1 and 2 of the study. These plots reflect the variation between pigs along the first two axes of the pig consensus profiles. Numbers represent individual pigs, while the circle in the right bottom corner reflects a standard error for each pig’s position on the plot. This region is so small as to only encompass one pig at a time, indicating that the position of each individual pig on the plot is reliably fixed by its score on each of the axes of the consensus profile.
Table 1
Terms with highest positive and negative correlations with Axis 1 for all 18 observers. Values in brackets give the number of observers using that term
Part 1 Part 2
PositiÕe correlation with Axis 1
Ž . Ž . Ž . Ž . Ž .
Friendly 4 , playful 3 , inquisitive 2 , Friendly 5 , confident 3 ,
Ž . Ž . Ž . Ž .
relaxed 2 , at ease 1 , relaxed 2 , enthusiastic 2 ,
Ž . Ž . Ž . Ž .
confident 1 , sociable 1 , fascinated 1 , excited 1 ,
Ž . Ž . Ž . Ž .
boisterous 1 , pushy 1 , uninhibited 1 , forceful 1 ,
Ž . Ž . Ž . Ž .
persistent 1 , attentive 1 boisterous 1 , tactile 1
NegatiÕe correlation with Axis 1
Ž . Ž . Ž . Ž . Ž .
Nervous 4 , restless 2 , wary 2 , Wary 6 , distressed 4 ,
Ž . Ž . Ž . Ž . Ž .
timid 2 , uncertain 1 , insecure 1 , restless 2 , agitated 2 ,
Ž . Ž . Ž . Ž . Ž .
unsettled 1 , suspicious 1 , distressed 1 , distracted 1 , nervous 1 ,
Ž . Ž . Ž . Ž . Ž .
anxious 1 , interested 1 , disinterested 1 cautious 1 , disinterested 1
pigs, adding up to a total of 24.1% of the variation between pigs explained. In Part 2, Axis 1 explains 10.9% and Axis 2 8.8% of the variation between pigs, adding up to a total of 19.7% explained. This variation in behavioural expression can be interpreted semantically with the Word Charts as discussed above. For example, in Part 2 pig 20 Žusing terms from the Word Chart shown in Fig. 2B was seen as friendly but playful. and rather rough, whereas pigs 14 and 15 appeared more gentle and relaxed. Pig 18 on
Ž
the other hand was characterized as more cautious but still quite forceful irritated and .
agitated , whereas pig 11 was calmer and appeared mostly uncertain and careful. In Part 1, pig scores on the principal axes were not significantly affected by housing background. There is however a highly significant difference between pigs tested on day
Ž
1 and pigs tested on day 2, in these pigs’ scores on Axis 2 two-tailed Student’s t-test,
. Ž .
dfs18, ts7.36, p-0.001 . Pigs tested on day 1 nos. 1–10 in Fig. 3, Part 1 all show
Ž .
positive values on Axis 2, while pigs presented on day 2 nos. 11–20 in Fig. 3, Part 1 all show negative values, indicating that pigs on day 2 were generally calmer. It is unclear what caused this effect, and a variety of factors may have contributed to it. The two groups of pigs were subsequently analyzed separately. However, these results did not differ significantly from those for the whole group as discussed above, and are therefore not discussed further here.
Ž .
Fig. 2. A Word Chart of Observer no. 5 for Part 1. Axes reflect the correlation of terms with Axes 1 and 2 of the consensus profile. Axis 1 explains 13.7% of the variation between pigs, and according to this observer describes the pigs as ranging from ‘sociable’ and ‘playfulrlively’ to ‘unsettled’ and ‘restricted’. Axis 2 explains 10.4% of the variation and ranges from ‘interested’ and ‘inquisitive’ to ‘disinterested’ and ‘relaxed’.
Ž .B Word Chart of Observer no. 5 for Part 2. Axes reflect the correlation of terms with Axes 1 and 2 of the consensus profile. Axis 1 explains 10.9% of the variation between pigs and according to this observer
Ž .
Ž .
Fig. 3. Pig plots for Parts 1 and 2. Axes reflect GPA scaling-values for relative sample pig distance on Axes 1 and 2 of the consensus profile. Numbers represent individual pigs. EsEnriched pigs, NEsNon-Enriched
Ž .
pigs see Section 2 for explanation . The circle in the right bottom corner reflects the standard error for each pig’s position in the plot.
In Part 2, housing background did have a significant effect on the pigs’ scores on
Ž .
4. Discussion
The results of this paper show that in the two separate parts of this study, 18 observers achieved significant agreement when given complete freedom to describe, in their own terms, the behavioural expressions of twenty female growing pigs. These observers had no previous experience in the observation of pigs, and were given no training in the description of pig expressions prior to the experiment.
Agreement between the spontaneous observer assessments was determined by GPA, a multivariate statistical technique not previously used in the field of animal behaviour. Level of observer agreement was evident in the features defining the GPA ‘consensus
Ž .
profile’: 1 the profile’s significance relative to randomized profiles of the 18 data sets; Ž .2 the semantic convergence of the profile’s 18 descriptive Word Charts, and 3 theŽ . high confidence level of the positions of individual pigs on the profile’s principal axes. But perhaps most importantly, agreement emerged in the fact that computation of the consensus profile transformed loosely generated individual terminologies into
meaning-Ž
ful and subtle transitions of expression e.g., ‘friendly–inquisitive–playful–bold– forceful– irritated – agitated – restless’, or ‘friendly – relaxed – gentle – calm – tense –
.
careful–cautious–restless’, see Fig. 2B . Given that observers had received no prior training, their Word Charts could well have been an unstructured mixture of terms without any apparent meaning. That this was not the case indicates that observers could use their individual terminologies as coherent frameworks for describing pig expres-sions, and that they based their assessment on commonly perceived and systematically applied criteria.
The nature of these shared observer criteria, and the extent to which they reflect observable aspects of behaviour, now requires further investigation. In this first ex-ploratory study of behavioural expression the level of resolution provided by the observers’ assessments is not high. Observers’ terms, clustered around the origin, do not correlate strongly to the two principal dimensions of expression. The consensus profile explains only 22% of the total variation between pigs, and does not differ greatly Žthough highly significantly from a randomized distribution of terms. However, this. lack of resolution is not surprising, given that a very crude onerzero system was used to score pig expressions. Observers could select as many or as few terms as they saw fit, repeat some terms but not others, come up with new ones, or do all of these at the same time. Variables were thus virtually free-floating within the 18 data matrices. It is important to emphasize therefore that even with such disorganization of data and concomitant statistical ‘noise’, observer assessments still showed significant and mean-ingful organization. This indicates that GPA is a sensitive and useful tool for the integrative assessment of animal behaviour and welfare.
approaches, and provide them with a stronger numerical basis. If, as we hypothesize, criteria of qualitative assessment reflect observable aspects of behaviour, levels of data resolution should increase substantially with such measurement refinement. Observer terminologies should correlate more strongly to the main dimensions of expression, which should then explain a higher percentage of variation between pigs. Discussion of
Ž .
the scientific status of categories of behavioural expression i.e., what expressions ‘are’ is premature in the context of the present study, but with such improved results will be more pertinent.
Some critics may insist that irrespective of how successful qualitative assessment may be as a research tool, its dependence on human perception and language renders it
Ž ‘subjective’, and devoid of biological reality. However, to place the human observer the
.
‘subject’ fundamentally out with ‘objective’ reality is untenable, if only for evolution-ary reasons. Human beings, including scientists, are part of reality and act upon it. There is no neutral, ‘perspective-free’ ground; the human observer determines at which level
Ž .
of organization measurements are taken and interpreted conceptually Nagel, 1986 . Thus, qualitative behavioural measurement does not differ fundamentally from standard physiological and behavioural measurement in its dependence on human perception and linguistic ability, but merely reflects a different assessment vantage point. There is no reason in our view to assume that qualitative assessment, any more than other levels of
Ž
assessment, is hindered by deep insurmountable ‘anthropomorphic’ bias cf. Ingold, .
1994; Cenami Spada, 1997; Crist, 1998 . That qualitative assessment is based on human perception does not make it a study of human perception. Human observers and their perceptive powers are used as an assessment tool, and the relevant question is the reliability of that tool.
Indeed qualitative assessment of behavioural expression could be so error-prone as to be fundamentally unreliable. Even if observers agree, they can still be collectively wrong. Famously, when presented with a picture of a chimpanzee’s ‘grinning’ face, a
Ž group of assessors interpreted this expression as a sign of ‘joy and laughter’ Foley,
. Ž
1935 , whereas in fact the baring of teeth signals defensive threat or appeasement van .
Hooff, 1977 . This early study has since become a classic example of the presumed erratic nature of spontaneous, face-value assessments of animal expression. Crucially, however, observers were presented with static and incomplete images of chimpanzees; had they seen a video of a ‘grinning’ chimp in full behavioural display, or been present in the animal’s direct vicinity, they may well have given an accurate interpretation of the
Ž .
animal’s expression cf. Hebb, 1946 .
Ž .
More recently, Mitchell and Hamm 1997 provided large groups of assessors with brief descriptions of the behaviour of various animals in certain contexts, and asked
Ž . assessors to evaluate these animals’ psychological state by indicating their dis agree-ment with several pre-set qualifications. They found that assessors, relying on these descriptions rather than on other parameters such as physical likeness to humans,
Ž
attributed a similar level of psychological ability to a range of species e.g., otter–dog– .
chimpanzee . This, the authors suggest, indicates that psychological qualifications of Ž behaviour are not reliably accurate: ‘‘Clearly the same psychological term e.g.,
.
deception can be applied to behaviors in a variety of species which likely do not share
Ž .
suggest that had assessors actually observed the dynamic details of behaviour either live or from video, and had they been free to choose their own descriptors, they may well have discriminated between the abilities of various species with the required subtlety and precision.
As our own results illustrate, it is through the dynamic style of interactive behaviour that expressions emerge, and that style is to some extent independent of the form behaviour takes. Observers for example classified as ‘confident’ pigs which immediately approached and contacted the interactor, but also pigs which ignored the interactor and strolled around the test pen to explore its corners. Thus, a crucial condition of qualitative assessment is that observers, rather than focus on fixed elements of behaviour, be allowed to freely take in emerging dynamic details of behaviour and context, and integrate these through an appropriate choice of terms.
5. Conclusion
In conclusion, the results of the present study are in agreement with the hypothesis that the spontaneous qualitative assessment of behaviour provides empirical access to behavioural expressions and thus potentially to associated states of welfare in pigs. Further refinement of the proposed methodology is necessary to investigate its potential as an integrative welfare measurement tool.
Acknowledgements
We thank Dave Anderson and Sheena Calvert for their assistance in taking care of the animals and collecting the data. We are very grateful to Dr. Elizabeth Austin for suggesting the use of GPA in the context of this study, and to Simon Williams for his invaluable help in applying GPA to our data. This research was financially supported by the UK Ministry of Agriculture, Fisheries and Food, and by the Scottish Office Agriculture Fisheries and Food Department.
Appendix A
This Appendix provides a step-by-step illustration of the process of iterative transfor-Ž
mation through which GPA determines the best common denominator the ‘Consensus .
Profile’ of individual observer assessments of pig behavioural expression. This illustra-Ž . tion is derived from examples and explanations provided by Arnold and Williams 1985
Ž .
and Oreskovich et al. 1991 , and the reader is referred to these texts for more detailed information.
Standard GPA analysis in the food sciences tends to be based on the use by observers of quantitative rating scales attached to their personal terminologies. In the present paper however, observers were just asked to provide descriptive terms for pig behavioural
Ž .
Neverthe-Ž .
Fig. 4. Assessments of pig behavioural expression provided by observers 1 and 2 for the same 4 Pigs a,b,c,d Axes reflect individual terminologies.
less, for the sake of future reference, this Appendix is based on the standard quantitative scoring system, of which the 0r1 system can be regarded as a simpler version.
A.1. Introduction: a simple example
Ž .
Let us assume as a starting-point that two observers 1 and 2 have scored four pigs Ža, b, c and d on two expressive terms. Fig. 4a shows how Observer 1 scored pigs a, b,. c and d on her chosen terms ‘friendly’ and ‘confident’, while Fig. 4b shows how Observer 2 scored these pigs on his terms ‘assertive’ and ‘relaxed’. Thus, we have two observer configurations which each consist of two dimensions defining the geometric position of four pigs.
The extent to which the two observers agree in their assessment of the four pigs is a function of the similarity of the configurations they have created, and at first glance this similarity does not seem high. However, individuals naturally vary in their ways of naming and scoring items for observation. They may use different terms, they may vary in the level and range of scores they use, but the pattern of scoring underlying those differences may nevertheless be similar.
GPA is designed to detect precisely how similar the scoring patterns underlying individual observer configurations are. It does so through several transformation steps in which it ‘corrects’ individual configurations for various types of variation, and so finds a best common denominator, the consensus profile. Whether this consensus profile is a significant feature of the data set, or an artifact of the process of transformation, is then determined through a randomization test.
Fig. 6. Intermediary Target Configuration for interactive transformation of pig score configurations.
Below we briefly outline these successive steps of transformation and testing, and illustrate them with the simple two-observer example.
A.2. Transformation steps
Ž .
1. The first transformation step is that of TranslationrCentering Fig. 5 . This step accommodates that observers may use different levels of a rating scale to quantify differences between pigs. For example, Observer 1 appears to use only the upper level
Ž .
of her ‘friendly’ scale to score the pigs Fig. 4a . Correction for this difference takes place by subtracting from each individual pig score the mean score for a trait, thus transforming pig scores into deviations from their mean value. These new scores are then centered around a common origin.
After TranslationrCentering, transformation steps become iterative. GPA calculates an Intermediary target configuration, and uses this to compute a sequence of
increas-Ž .
ingly stable solutions i.e., consensus profiles . For the first iteration, the configuration
Ž .
of the first observer is used as a target configuration Fig. 4a . For the second and subsequent iterations, the mean of all transformed observer configurations serves as an
Ž .
intermediary target configuration as illustrated in Fig. 6 .
Ž .
2. The second transformation step is that of RotationrReflection Fig. 7 . This step accommodates that observers create terminologies which, due to differences in semantic content, are used differently to quantify distances between pigs, and therefore differ in their multi-dimensional geometric orientation. For example, the terminologies ‘friendlyrconfident’ and ‘assertiverrelaxed’ are not dissimilar in tone yet do not fully
Ž overlap, and they therefore produce different geometric locations of the pigs notably
. Ž .
pigs b and d . An assertive pig may well appear reasonably friendly pig b , but a Ž .
friendly pig does not have to be assertive pig d . Thus, that pigs b and d occupy
different locations in the configurations of Observers 1 and 2 does not necessarily imply that these observers disagree or contradict each other. They may merely emphasize different, complementary aspects of the pigs’ expressive repertoire. GPA corrects for
Ž .
such differences by rotating and reflecting ‘flipping over’ observer configurations so as Ž
to most closely match the intermediary target configuration note that pigs b and d swap .
location .
Obviously, this step of aligning the geometric axes of observer configurations is the most crucial one in finding a consensus profile of pig behavioural expression. However, this step does not embezzle semantic differences between observer terminologies. Each individual observer’s interpretation of the consensus profile and its main axes is
Ž .
preserved in the individual ‘word charts’ see below and main text . Inspection of these charts could disclose that observers show poor semantic agreement in their characteriza-tion of the consensus profile; in principle it is possible to find a valid consensus profile which semantically makes no sense.
Ž .
3. The third transformation step is that of Scaling Fig. 8 . This step accommodates that observers may use different ranges of the rating scale to quantify the differences between pigs. For example, Observer 2 used a larger range of his rating scales than Observer 1, so his scores are more spread out. Correction for this difference takes place by either ‘stretching’ or ‘shrinking’ observer configurations to match the intermediary target configuration.
A.3. The final consensus profile
A.3.1. Calculation
After rotationrreflection and scaling, the mean of all newly transformed observer Ž .
configurations is taken Fig. 9a . In most cases, this configuration will serve as a new intermediary target configuration for subsequent iterations of rotationrreflection and scaling. GPA strives to minimize the distance between individual observer configura-tions and a given target configuration, and the iterative process of transformation will therefore continue until it no longer effects noticeable change. At that point, a final consensus configuration can be computed by taking the mean of all transformed observer configurations.
A.3.2. Testing itsÕalidity
How well individual observer configurations fit the consensus profile is mathemati-Ž .
cally quantified by GPA in the so-called Procrustes Statistic PS . This Statistic is Ž
calculated for every iteration, and reflects the degree of similarity as regards projected
Ž .
Fig. 9. Final Consensus Profile. A: the mean of transformed pig score configurations pig plot ; B: correlation
Ž .
of terms used by observer 1 to the pig plot Word chart observer 1 ; C: correlation of terms used by observer 2
Ž .
to the pig plot Word chart observer 2 .
.
geometric distances between pigs between transformed observer configurations and the Žintermediary or final consensus profile. The larger the PS, the more the observers.
Ž
agree about the configuration of pigs but not necessarily about descriptive terms, see .
transformation step 2 .
of the transformation process. This cannot be done by referring to statistical tables, but only through a randomization test. The data of all observers are randomized, GPA
Ž .
computations are repeated, and the goodness-of-fit the PS of the randomized profile is calculated. The distribution of the PS from say 100 randomizations provides a
null-dis-Ž . Ž
tribution for testing the significance of the PS from the non-randomized data see main .
text .
A.3.3. Further interpretation
A.3.3.1. ObserÕer Plots. The PS from a GPA analysis of each pair of observers provides
a measure of the distance between them. The matrix of distances between observers can Ž
be used to produce the Observer Plot using Principal Coordinate Analysis see main .
text .
A.3.3.2. Pig Plots. Principal Component Analysis of the co-ordinates of the pig consensus profile determines which two axes of this profile best differentiate between
Ž .
pigs, and individual pigs are then plotted on to these axes see main text . In case of the Ž simple 2-dimensional example given here the pig plot inevitably has two main axes Fig.
. 9a .
A.3.3.3. Word Charts. The axes of the pig plot can then be interpreted semantically by
Ž .
correlating them with the original individual observer configurations see main text . The axes of Observer 1 in the example have, as described under transformation step 2, been rotated and reflected, and so it appears that the use of ‘friendly’ by Observer 1 aligns with that of ‘relaxed’ by Observer 2, and the use of ‘confident’ with that of
Ž .
‘assertive’ Fig. 9b and c .
Thus, GPA has, through several steps of transformation, found the best common denominator of two completely independent assessments of four pigs. This consensus profile, which is itself not based on semantic interpretation, subsequently provides an ‘objective’ basis for a comparison of the different individual observer terminologies, as to how they inter-relate and overlap in their description of the consensus profile. GPA thus is an ideal tool for testing the validity of spontaneous qualitative assessments of behaviour.
References
Arnold, G.M., Williams, A.A., 1985. The use of Generalized Procrustes Techniques in sensory analysis. In:
Ž .
Piggott, J.R. Ed. , Statistical Procedures in Food Research. Elsevier, London, pp. 233–253. Boissy, A., 1995. Fear and fearfulness in animals. Q. Rev. Biol. 70, 165–191.
Buirski, P., Plutchik, R., Kellerman, H., 1978. Sex differences, dominance, and personality in chimpanzees. Anim. Behav. 26, 123–129.
Cenami Spada, E., 1997. Amorphism, mechanomorphism, and anthropomorphism. In: Mitchell, R.W.,
Ž .
Thompson, N.S., Miles, H.L. Eds. , Anthropomorphism, Anecdotes and Animals. SUNY Press, Albany, pp. 37–50.
Clarke, A.S., Boinski, S., 1995. Temperament in non-human primates. Am. J. Primatol. 37, 103–125. Coleman, K., Wilson, D.S., 1998. Shyness and boldness in pumpkinseed sunfish: individual differences are
Crist, E., 1998. The ethological constitution of animals as natural objects: the technical writings of Konrad Lorenz and Nikolaas Tinbergen. Biol. Philos. 13, 61–102.
Dutton, D.M., Clark, R., Dickins, D.W., 1997. Personality in captive chipanzees: use of a novel rating procedure. Int. J. Primatol. 18, 539–552.
Feaver, J., Mendl, M., Bateson, P., 1986. A method for rating the individual distinctiveness of domestic cats. Anim. Behav. 34, 1016–1025.
Foley, J.P., 1935. Judgement of facial expression of emotion in the chimpanzee. J. Soc. Psychol. 6, 31–67. Gains, N., Thomson, D.M.H., 1990. Contextual evaluation of canned lagers using repertory grid method. Int. J.
Food Sci. Technol. 25, 699–705.
Gold, K.C., Maple, T.L., 1994. Personality assessment in the gorilla and its utility as a management tool. Zoo Biol. 13, 509–522.
Ž .
Gosling, S.D., 1998. Personality dimensions in Spotted Hyenas Crocuta crocuta . J. Comp. Psychol. 112, 107–118.
Gower, J.C., 1975. Generalized procrustes analysis. Psychometrica 40, 35–51.
Gower, J.C., Dijksterhuis, G.B., 1994. Multivariate analysis of coffee images: a study in the simultaneous display of multivariate quantitative and qualitative variables for several assessors. Quality and Quantity 28, 165–184.
Hebb, D.O., 1946. Emotion in man and animal: an analysis of the intuitive processes of recognition. Psychol. Rev. 53, 88–106.
Heyes, C., 1993. Anecdotes, training, trapping and triangulating: do animals attribute mental states?. Anim. Behav. 46, 177–188.
Ingold, T., 1994. From trust to domination, an alternative history of human–animal relations. In: Manning, A.,
Ž .
Serpell, J. Eds. , Animals and Human Society: Changing Perspectives. Routledge, London, pp. 1–22. Lyons, D.M., Price, E.O., Moberg, G., 1988. Individual differences in temperament of domestic dairy goats:
constancy and change. Anim. Behav. 36, 1323–1333.
McGuire, M., Raleigh, M.J., Pollack, D.B., 1994. Personality features in Vervet monkeys: the effects of sex, age, social status and group composition. Am. J. Primatol. 33, 1–13.
Mitchell, R.W., Hamm, M., 1997. The interpretation of animal psychology: anthropomorphism or behavior reading? Behaviour 134, 173–204.
Morton, D.B., Griffiths, P.H.M., 1985. Guidelines for the recognition of pain, distress and discomfort in experimental animals and an hypothesis for assessment. Vet. Rec. 116, 431–436.
Muir, D.D., Hunter, E.A., Banks, J.M., Horne, D.S., 1995. Sensory properties of hard cheese: identification of key attributes. Int. Dairy J. 5, 157–177.
Nagel, T., 1986. The View from Nowhere. Oxford Univ. Press, Oxford.
Oreskovich, D.C., Klein, B.P., Sutherland, J.W., 1991. Procrustes analysis and its applications to free-choice
Ž .
and other sensory profiling. In: Lawless, H.T., Klein, B.P. Eds. , Sensory Science: Theory and Applica-tions in Foods. Marcel Dekker, New York, pp. 353–393.
Ž .
Plutchik, R., 1980. A general psychoevolutionary theory of emotion. In: Plutchik, R., Kellerman, H. Eds. , Emotion, Theory, Research and Experience. Academic Press, New York, pp. 3–33.
Rutter, M., 1987. Temperament, personality and personality disorder. Br. J. Psychiatry 150, 443–458. Stevenson-Hinde, J., Zunz, M., 1978. Subjective assessment of individual rhesus-monkeys. Primates 19,
473–482.
Thomas, A., Chess, S., 1977. Temperament and Development. BrunnerrMazel, New York.
van Hooff, J.A.R.A.M., 1977. A comparative approach to the phylogeny of laughter and smiling. In: Hinde,
Ž .
R.A. Ed. , Non-verbal Communication. Cambridge Univ. Press, Cambridge, pp. 209–241.
Wakeling, I.N., Raats, M.M., MacFie, H.J.H., 1992. A comparison of consensus tests for Generalized Procrustes Analysis. J. Sens. Stud. 7, 91–96.
Wemelsfelder, F., 1997a. The scientific validity of subjective concepts in models of animal welfare. Appl. Anim. Behav. Sci. 53, 75–88.
Wemelsfelder, F., 1997b. Investigating the animal’s point of view; an inquiry into a subject-based method of measurement in the field of animal welfare. In: Dol, M., Kasanmoentalib, S., Lijmbach, S., Rivas E., Van
Ž .
den Bos, R. Eds. , Animal Consciousness and Animal Ethics. Van Gorcum, Assen, pp. 73–89. Williams, A.A., Langron, S.P., 1984. The use of free-choice profiling for the evaluation of commercial ports.