THE FUSION OF INDIVIDUAL TREE DETECTION AND VISUAL INTERPRETATION
IN ASSESMENT OF FOREST VARIABLES FROM LASER POINT CLOUDS
V. Kankare a, *, M. Vastaranta a,M. Holopainen a, X. Yu b, J. Hyyppä b, H. Hyyppä c
a
University of Helsinki, Department of Forest Sciences, Finland –[email protected]
b
Finnish Geodetic Institute –[email protected]
c
Aalto University, Research Institute of Modelling and Measuring for the Built Environment, Finland [email protected]
KEY WORDS: Forest inventory, plot-wise measurements, individual tree detection
ABSTRACT:
In this study we searched the obtainable accuracy of forest inventory based on the individual tree detection (ITD) by using fusion of automatic ITD (ITDauto) and visual interpretation of laser point clouds. Current ITD algorithms, mostly based on segmentation of
canopy height models (CHMs), are not able to utilize the whole information included in three-dimensional point clouds. We hypothesized that visual interpretation of the point cloud could provide so-called “best case” tree detection that could be achievable automatically. We refer to this method consisting of ITDauto and visual interpretation as ITDvisual. We assessed the plot level
accuracies of the ITDauto and ITDvisual in boreal managed forest conditions using 322 plots. Based on the results the accuracy of ITD
can be improved with visual interpretation. Omission trees are mainly missing from both ITD-methods. ITDvisual produced more
accurate estimates for all forest variables compared to ITDauto, e.g. RMSE% in volume decreased from 33.3% to 27.8% and bias%
in volume from 4.1% to 2.3%.
Area-based approach (ABA) is becoming more general for operational forest inventories with sparser laser data. ITDvisual would be
justified if it could replace expensive field work in plot-wise measurements needed for ABA. Further research is needed in the use of ITD results as a reference for ABA.
* Corresponding author.
1. INTRODUCTION
Recent developments in laser-scanning techniques have revolutionized remote sensing based forest inventories (FIs). With the capability of directly measuring forest structures, such as canopy height and crown dimensions, laser scanning is increasingly being used for FIs at different levels. FI methods using laser scanning technology are continuously being developed by various research groups and new methodologies are being applied to practical FI and forest management planning.
Operational laser-based FIs are mainly based on airborne laser scanning’s (ALS) area-based approach (ABA) demonstrated in Naesset (2002). In the ABA, features used as predictors are assessed from the laser-derived surface models and canopy height point clouds, which are directly used for forest variable prediction, typically using parametric, non-parametric, regression or discriminant analysis. Individual tree detection (ITD), which is the other main approach in ALS FI, is currently not widely used in practise, although the method was introduced as early as 1999 in the study made by Hyyppä and Inkinen (1999). In the most of the ITD methods, the maximum is used in the canopy height model (CHM) for finding trees and segmentation for tree crown edge detection (Kaartinen and Hyyppä, 2008).
ITD methodology has been widely studied, but is not generally used in practice, due to problems related to tree detection (e.g. see results in Kaartinen and Hyyppä, 2008). Other problems related to the practical use of ITD include higher needed ALS pulse density, which adds costs, the huge amount of
information that would have be stored and also tree species identification accuracy. The main advantage of ITD would be the true stem distribution series that would result better predictions for timber assortments. Prediction of stem distribution from ABA causes inaccuracies in timber assortments and forest value (Holopainen et al., 2010). Other advantage of ITD is the reduced amount of expensive fieldwork which is needed for ABA.
There have been many promising studies in which ITD was used in some special cases. Peuhkurinen et al. (2008) used ITD for preharvest measurements in two mature stands (density ~ 465 stems per hectare). The number of harvestable trees was underestimated by only <3% and saw-wood volume <0.5%. Maltamo et al. (2009) imputed individual tree quality attributes and root-mean-squared errors (RMSEs) for stem volume, proportion of sawlogs, diameter-at-breast height (dbh), height, crown height and height of the lowest dead branch were 11.0%, 8.7%, 5.2%, 2.0%, 7.1% and 25.2%, respectively. Yu et al. (2010) predicted plot level forest variables using random forest technique and calibrated omission and commission errors using linear regression model. RMSE% of 5.7%, 10.8% and 18.6% were achieved for basal-area weighted mean height (Hg), - diameter (Dg) and mean volume (V), respectively.
In Nordic forest conditions tree detection accuracies with automatic ITD (ITDauto) methods have varied from 20% to 90%
(Kaartinen and Hyyppä, 2008). In this study we searched the obtainable accuracy of the practical ITD based FI by using a combination of ITDauto and visual interpretation of laser point
clouds. Current ITD algorithms, mostly based on segmentation of canopy height models, are not able to utilize the all the International Archives of the Photogrammetry, Remote Sensing and Spatial Information Sciences, Volume XXXVIII-5/W12, 2011
information included in laser point clouds. We hypothesized that visual interpretation of the point cloud could provide so-called “best case” tree detection that would be achievable automatically in near future. We refer our method consisting of ITDauto and visual interpretation as ITDvisual. Wall-to-wall forest
inventory needs fully automatic methods. If ITD results are accurate enough, they could be used instead of plot-wise field measurements for ABA. Use of ITD results as a reference data is discussed.
2. METHOD
2.1 Study area and field measurements
The study area is located at Evo, Finland (61.19°N, 25.11°E). The area belongs to the southern Boreal Forest Zone and comprises of approximately 2000 ha mainly managed boreal forest. Field measurements were collected in the summer of 2009. 322 fixed-radius (10 m) circular plots were measured tree-by-tree. Plots were located with Trimble’s GEOXM 2005 Global Positioning System (GPS) device (Trimble Navigation Ltd., Sunnyvale, CA, USA.), and the locations were post processed with local base station data. The following variables were measured for trees with dbh larger than 7 cm: location, tree species, dbh, height and crown class. Main tree species were Scots pine (58.70%), Norway spruce (26.09%) and deciduous trees, mainly birch (Betula L.) (15.21%). The statistics for the forest variables in field measurements are presented in Table 1.
Variable M in M ean M ax SD
Dg, cm 10.0 24.3 62.2 8.4
Hg, m 7.9 19.4 31.7 4.9
BA, m2/ha 4.8 19.7 49.5 7.9
V, m3/ha 52.8 183.2 586.2 98.6
Table 1. Statistical characteristics of the field measurements (322 circular plots).
2.2 Laser scanning measurements
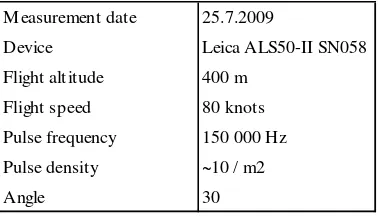
The ALS data were acquired in the summer of 2009, using a Leica ALS50-II SN058 system (Leica Geosystems AG, Heerbrugg, Switzerland). The flying altitude was 400 meters and speed 80 knots. The density of the returned pulses was approximately 10/m2. Summary of the ALS acquisition parameters is presented in Table 2. A digital terrain model (DTM) was computed by the data provider.
M easurement date 25.7.2009
Device Leica ALS50-II SN058
Flight altitude 400 m
Flight speed 80 knots
Pulse frequency 150 000 Hz
Pulse density ~10 / m2
Angle 30
Table 2. ALS acquisition parameters.
2.3 Automatic individual tree detection
Automatic individual tree detection (ITDauto) can be made with
many different algorithms (Kaartinen and Hyyppä, 2008). Most of the algorithms are originally designed for tree detection from high-resolution aerial images (Yu et al., 2004). ITDauto
-algorithm used in this study consisted of 5 steps and is the same as used in Yu, et al. (2010):
1) A raster canopy height model (CHM) was created from normalized (height of the DTM subtracted) ALS-data.
2) The CHM was smoothed with a Gaussian filter to remove small variation on the crown surface. The degree of smoothness was determined by the value of the standard deviation (Gaussian scale) and kernel size of the filter.
3) Minimum curvature was calculated from the smoothed CHM. For a surface such as CHM, a higher value of minimum curvature describes the treetop.
4) The smoothed CHM was scaled based on the minimum curvature computed.
5) Local maxima were then searched in a given neighbourhood. Founded local maxima points were considered as tree tops.
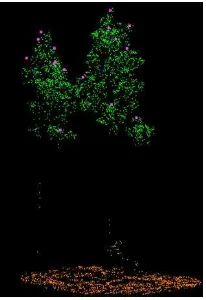
Figure 1. Raw ALS-data with ITDauto detected local maxima
points (tree tops).
2.4 Visual interpretation
After ITDauto was carried out, the tree detection omission and
commission errors were reduced using visual interpretation. Visual interpretation was done using Terrascan-software (Terrasolid Ltd, Helsinki, Finland). ITDauto 3D-locations of the
tree tops were imported to Terrascan. Point clouds for each plot were checked one-by-one in 3D environment that enabled visual tree detection from different view angles. In Figure 2 is an example of commission errors that were reduced in visual interpretation as in Figure 3 omission errors were reduced. International Archives of the Photogrammetry, Remote Sensing and Spatial Information Sciences, Volume XXXVIII-5/W12, 2011
Figure 2. Commission errors reduced in visual interpretation. Purple dots represent automatically detected trees as blue ones
are visually corrected trees.
Figure 3. Omission errors reduced in visual interpretation.
2.5 Calculation of forest variables based on ITD
In ITDvisual, only location of the tree top was determined. That
was the main reason for calculation of the forest variables was based only on laser measured tree height. No calibration of laser height was done. A dbh was predicted for the trees, using the laser-based tree height and model developed by Kalliovirta and Tokola (2005) for boreal forest stand in southern Finland. Volume of the individual tree was calculated with standard Finnish models (Laasasenaho, 1982) based on assumption that tree species is known. Plot level forest variables were calculated from tree level data.
2.6 Accuracy assessment
We assessed the plot level accuracies of the ITDauto and
ITDvisual in boreal managed forest conditions using 322 plots.
The root-mean-squared errors (RMSE) and biases were calculated. The studied forest variables were basal area (BA), volume (V), basal area weighted mean height (Hg) and - diameter (Dg). Three different cases were studied: prediction accuracy 1) for all the plots, 2) for plots divided in groups by main tree species and 3) for plots divided in two classes: young and mature forest. Young and mature forest were divided based on limiting Dg (16 cm).
3. RESULTS
True stem distribution is seen as one of the advantages of the ITD over ABA. Detected trees and trees measured in the field are plotted in young pine forest (Fig. 4) and mature pine forest (Fig. 5). The omission and commission trees detected by ITDvisual are presented in Figure 6. From these figures and from
Table 3, it is seen how ITDvisual increases the accuracy of the
stem distribution but further development is needed. Especially with smaller trees that are mostly still missing also from ITDvisual. Results show that the largest (by quantity) dbh classes
are overestimated with both ITD-methods. One explanation for this is estimation of tree dbh from laser-based tree height which could be improved by using more sophisticated models. The other reason is commission errors in detection of larger trees.
0 10 20 30 40 50 60 70
7 8 9 10 11 12 13 14 15 16 17 18 19 20 21 22 23 24 25
n
dbh, cm
FIELD ITDaut o ITDvisual
Figure 4. True stem distribution combared to trees detected with ITDauto and ITDvisual in young pine forest.
0 5 10 15 20 25
7 12 17 22 27 32
n
dbh, cm
Field
ITDaut o
ITDvisual
Figure 5. True stem distribution compared to trees detected with ITDauto and ITDvisual in mature pine forest.
Figure 6. Omission and commission trees found in visual interpretation.
Overall, ITDvisual produced more accurate estimates for all
forest variables (Table 3). RMSE% in volume decreased from 33.3% to 27.8% and bias% from 4.1% to 2.3%. Main reason for this is reduced commission errors which have been shown to have larger impact on accuracy of forest variables than omission errors (see Yu, et al., 2010).
Prediction accuracy of the Dg is important factor for predicting timber assortments and timber value. Dg RMSE% decreased from 12.9% to 8.4%. ITDvisual resulted less biased estimation
for Dg.
M ethod Variable Bias Bias% RM SE RM SE%
ITDauto Dg, cm -3,1 12,9 5,8 18,3 pine, Norway spruce and deciduous trees (mainly birch), with ITDauto were (RMSE%) of 29.8%, 38.0% and 37.2%,
respectively. Accuracies (Table 4) increased with ITDvisual
-method (e.g. volume accuracy for spruce was 23.0%). Larger bias% for Scots pine and desiduous trees (birch) was mainly caused by comission errors.
M ethod M ain SP n Bias Bias% RM SE RM SE%
ITDauto Pine 189 12,2 7,2 50,7 29,8
Spruce 84 11,9 5,1 58,8 38,0
Dec. 49 -16,9 -12,3 54,3 37,2
ITDvisual Pine 189 10,1 5,9 45,0 28,4
Spruce 84 0,6 0,2 49,4 23,0
Dec. 49 -12,6 -9,2 48,9 32,6
Table 4. Volume (m3/ha) estimation accuracy by tree species (Pine, Spruce or Deciduous trees) for ITDauto and ITDvisual.
ITDvisual increased the prediction accuracy especially in mature
forests compared to ITDauto (Table 5.). RMSE% for volume at
plot level decreased to 27.6% from 34.0% and bias% was decreased in half.
The time consumption in visual interpretation was mainly dependent on the plots tree density. Time used per plot was from two (tree density < 600 stems/ha) to three minutes (tree density up to 1300 stems/ha) including only the checking of the omission and commission errors. Time consumption was not dependent on tree species.
Method Variable Bias Bias% RM SE RMSE% Bias Bias% RM SE RM SE% ITDauto Dg, cm 0,48 -3,52 2,14 15,90 -3,82 14,70 6,52 18,94
Hg, m 0,07 -0,59 0,78 6,60 -0,52 2,54 1,62 7,61 BA, m2/ha -3,10 17,67 5,15 29,51 -0,99 4,94 5,56 31,88 V, m3/ha -18,25 16,24 30,74 29,05 -5,93 3,07 56,35 33,95
ITDvisual Dg, cm 0,80 -5,86 2,43 17,96 -2,50 9,62 5,54 16,70
Hg, m 0,10 -0,78 0,76 6,33 -0,50 2,43 1,48 6,86 BA, m2/ha -2,15 12,28 4,97 29,22 -0,32 1,62 5,31 28,24 V, m3/ha -11,88 10,57 29,79 28,53 -2,90 1,50 49,04 27,64
YOUNG, n=45 M ATURE, n=277
Table 5. Accuracy of the ITD-methods in young and mature forests.
4. CONCLUSIONS AND DISCUSSION
The idea to make visual interpretation from laser point clouds started from the problems with ITDauto in the same study area.
In this case, the problem was normally tree detection (around of 70% of the trees are detected). This kind of error levels are not allowed if true stem distribution series are wanted. ITDauto
was done only using the CHM information and understory trees were not detected. Also the pulse density in these previous studies (Yu et al., 2010; Yu et al., 2011) was relatively low (around 3 hits per m2).
Visual interpretation is not feasible in “wall-to-wall” inventory. We believe that this visual interpretation gives us the accuracy level of tree detection, where automatic methods can develop within few years. Human eye can detect understory trees, separate closely growing, or drop commission errors easily compared to current automatic algorithms.
If ITD is used to produce training data for area-based inventory methods, it is important to get unbiased measurements. Tree detection is the major error source in ITD, but other sources such as modelling dbh and tree species classification are also remarkable (Vastaranta et al., 2011 manuscript). They reported that if tree detection was around 65%, the effect on the error of mean volume was approximately 27%.
Based on our results, it can be noted that even with visual interpretation there is uncertainty in estimation of forest variables. Our observations of the detected stem distributions revealed that more realistic stem distribution can still be achieved with ITDvisual. For forest owners’ point of view, the
prediction accuracy of volume and Dg are important for forest management decision making. ITDvisual results were inferior
compared to Yu, et al. (2010) but calibration of the results used in Yu, et al. (2010) looses information needed in forming true stem distributions. One of ITDvisual’s advantages could be
forming rather accurate true stem distributions. This should be further researched.
To carry out practical ITD in varying forest conditions is still a major challenge. If wall-to-wall mapping is not needed it gives more freedom to utilize methods that needs intensive data processing, visual interpretation etc. Producing ground reference for ABA by means of ITD would be an interesting option. Results of this study provide a base to test that. International Archives of the Photogrammetry, Remote Sensing and Spatial Information Sciences, Volume XXXVIII-5/W12, 2011
REFERENCES
Holopainen, M., Mäkinen, A., Rasinmäki, J., Hyyppä, J., Hyyppä, H., Kaartinen, H., Viitala R., Vastaranta, M. & Kangas, A., 2010. Effect of tree level airborne laser scanning accuracy on the timing and expected value of harvest decisions. Eur. J. For. Res., Doi 10.1007/s10342-009-0282-6.
Hyyppä, J. & Inkinen, M., 1999. Detecting and Estimating Attributes for Single Trees Using Laser Scanner. The Photogramm. J. Fin., 16, pp. 27-42.
Kaartinen H. & Hyyppä J., 2008. EuroSDR/ISPRS Project, Commission II “Tree Extraction”, Final Report; EuroSDR Official Publication No. 53; European Spatial Data Research: Dublin, Ireland.
Kalliovirta, J. & Tokola, T., 2005. Functions for estimating stem diameter and tree age using tree height, crown width and existing stand database information. Silva Fenn., 39(2), pp. 227 248.
Laasasenaho, J., 1982. Taper curve and volume function for pine, spruce and birch. Communicationes Instituti Forestalis Fenniae 108, pp. 1–74.
Maltamo, M., Peuhkurinen, J., Malinen, J., Vauhkonen, J., Packalén, P. & Tokola, T., 2009. Predicting Tree Attributes and Quality Characteristics of Scots Pine Using Airborne Laser Scanning Data. Silva Fenn., 43(3), pp. 507-521.
Næsset, E., 2002. Predicting Forest Stand Characteristics with Airborne Scanning Laser Using a Practical Two-Stage Procedure and Field Data. Remote Sens. Environ., 80, pp. 88-99.
Peuhkurinen, J., Maltamo, M. & Malinen, J., 2008. Estimating species-specific diameter, distributions and saw log recoveries of boreal forests from airborne laser scanning data and aerial photographs: a distribution-based approach. Silva Fenn., 42, pp. 625-641.
Vastaranta, M., Holopainen, M., Yu, X., Hyyppä, J., Rasinmäki, J., Melkas, T., Kaartinen, H. & Hyyppä, H., 2011. Effects of ALS individual tree detection error sources on forest management planning calculations. Manuscript.
Yu, X., Hyyppä, J., Kaartinen, H. & Maltamo, M., 2004. Automatic detection of harvested trees and determination of forest growth using airborne laser scanning. Remote Sens. of Environ., 90, pp. 451-462.
Yu, X., Hyyppä, J., Holopainen, M. & Vastaranta, M., 2010. Comparison of Area-Based and Individual Tree-Based Methods for Predicting Plot-Level Forest Attributes. Remote Sens., 2(6), pp. 1481-1495, doi:10.3390/rs2061481
Yu, X., Hyyppä, J., Holopainen, M., Vastaranta, M. & Viitala, R., 2011. Predicting individual tree attributes from airborne laser point clouds based on random forest technique. ISPRS J. Photogramm. Remote Sens., in press.
ACKNOWLEDGEMENTS
This study was made possible by financial aid from the Finnish Academy project: Improving the Forest Supply Chain by means of Advanced Laser Measurements.