COMPARING IMAGE-BASED METHODS FOR ASSESSING VISUAL CLUTTER IN
GENERALIZED MAPS
G. Touya a*, B. Decherf a, M. Lalanne a, M. Dumont a a
COGIT, IGN, 94165 Saint-Mandé, France – (firstname.lastname)@ign.fr
ISSDQ, Commission II, WG II/2
KEY WORDS: Map Generalization, Clutter, Complexity, Cartography, Legibility, Constraints, Scale
ABSTRACT:
Map generalization abstracts and simplifies geographic information to derive maps at smaller scales. The automation of map generalization requires techniques to evaluate the global quality of a generalized map. The quality and legibility of a generalized map is related to the complexity of the map, or the amount of clutter in the map, i.e. the excessive amount of information and its disorganization. Computer vision research is highly interested in measuring clutter in images, and this paper proposes to compare some of the existing techniques from computer vision, applied to generalized maps evaluation. Four techniques from the literature are described and tested on a large set of maps, generalized at different scales: edge density, subband entropy, quad tree complexity, and segmentation clutter. The results are analyzed against several criteria related to generalized maps, the identification of cluttered areas, the preservation of the global amount of information, the handling of occlusions and overlaps, foreground vs background, and blank space reduction.
1. INTRODUCTION
Map generalization is a process to abstract and simplify geographic information for a legible display at smaller scale. The automation of map generalization is complex that research has focused on for thirty years (Burghardt et al., 2014). Evaluation is a key task to guide auto-evaluating processes, but also assess the final map (Mackaness and Ruas, 2007). Among generalization evaluation problems, the global evaluation of a generalized map legibility and quality is still difficult because many small criteria (e.g. building sizes, symbol overlaps) have to be aggregated (Stoter et al., 2014). Using the notion of clutter to improve global evaluation is a promising idea.
Clutter refers to an excessive amount of information in an image, and/or a disorganization of the information (Rosenholtz et al., 2007). Many clutter measures have been tried in computer vision to capture different aspects of image complexity (Moacdieh and Sarter, 2014). In cartography, clutter measures have been used to capture map complexity (Stigmar and Harrie 2011) or to measure excessive generalization (Jansen and van Kreveld, 2001). We believe that it could be useful to use the notion of clutter for the global evaluation of generalized maps to measure that complexity has been globally and/or locally reduced and that the initial amount and organization of information has been preserved by the automatic generalization processes. We also believe that a single measure, whatever it is, will not allow us to capture all aspects of clutter in generalized maps. So, this paper presents an experiment that computes several clutter measures on generalized maps, to find which measures could be useful in generalization evaluation.
Section 2 presents related work on cartographic generalization evaluation and clutter. Section 3 describes more precisely the methods we compared and section 4 explains what maps are used to compare clutter measures. Section 5 describes the results of the experiments and section 6 concludes.
2. RELATED WORK
2.1 Cartographic Generalization Evaluation
The evaluation of the generalization processes is a key topic in generalization research and main achievements are described by Mackaness and Ruas (2007), and Stoter et al (2014). Evaluation is required for controlling the automatic processes, that are often auto-evaluating and iterative, for tuning an automatic system prior to generalization, and for assessing the quality of an automatic output (Mackaness and Ruas, 2007). It is the latter that we are most interested in.
Some techniques exist for evaluating the satisfaction of a particular constraint in the generalized map, for instance, the minimum area of building to be legible (Bard, 2004). Techniques exist even for the preservation of complex patterns such as building alignments (Stoter et al., 2014). However, automatically evaluating the global quality of the map remains a challenging task. Synthetizing the thousands of constraints in the map is a possible solution (Touya, 2012), but the use of more global metrics could help solving the problem.
2.2 Clutter and Map Complexity
The complexity of a map comprises graphical complexity that derives from the amount of symbols included in the map, and intellectual complexity that derives from the difficulty of understanding the map symbols (MacEachran, 1982, Fairbairn, 2006, Jégou and Deblonde, 2012). The notion of entropy, derived from communication theory (Shannon and Weaver, 1949), is sometimes used for map complexity as it captures the disorganization of the map as a communication system (Bjorke, 1996).
Besides, clutter refers to an excessive amount of information in an image, and/or the disorganization of this information (Rosenholtz et al., 2007). An impressive number of clutter measures exist (Moacdieh and Sarter, 2014), but these clutter measures are not dedicated to maps and generalization ISPRS Annals of the Photogrammetry, Remote Sensing and Spatial Information Sciences, Volume II-3/W5, 2015
evaluation, so may not be directly usable. The vast majority of such methods are image-based, so this paper focuses on them.
The Töpfer’s radical law gives the amount of map objects that should remain after generalization at a given map scale
Although past research showed that the radical law was not the perfect solution to get the ideal amount of information for a legible generalized map, it gives a fair default value. Quite few of the existing methods for measuring clutter (Jansen and van Kreveld, 2001) or map complexity (Bjorke, 1996) are dedicated to map generalization evaluation. Generalized maps have specific characteristics that clutter measures useful for generalization evaluation should capture (Touya et al., 2015):
local over densities,
blank space (it is acceptable to reduce blank space by generalization).
In this paper, we try to show how existing image-based clutter measures can help us or not identifying such characteristics, in order to improve global evaluation techniques.
3. METHODS USED IN THE COMPARISON
The clutter measures used in the comparison are briefly described in this section. The description focuses more on the characteristics that have a significant impact in the context of map generalization. For instance, methods can give a global value of clutter, or identify where clutter occurs in the image; methods can handle colored images or only grayscale images.
3.1 Quad Tree Clutter
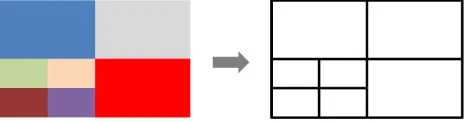
This method has been proposed by Jégou and Deblonde (2012). It computes a quad tree on the image cutting a cell in four each the pixels inside the cell are not homogeneous (Figure 1). This method converts the map into a grayscale image, which loses color contrasts. In each quadrant (i.e. a cell of the quad tree), each pixel grayscale value is compared to its neighbors’ grayscale value. The maximum difference for the pixel is kept and if the maximum between pixel max values is bigger than a threshold, the quadrant is considered as heterogeneous and then cut in four quadrants. The smaller the threshold is, the higher the clutter value is.
Figure 1. Principles of the Quad Tree clutter: the quad tree goes deeper as long as the colors in the cell are not homogeneous
This method is both global, as it gives a clutter value for the image (the number of leaves of the tree), and local as it allows the identification of the most cluttered areas. The method is quite sensitive to the grayscale threshold for cell homogeneity.
3.2 Subband Entropy
This method has been proposed by Rosenholtz et al (2007). Similarly to the jpeg compression, it decomposes the image into wavelets, and measures the disorganization of colors in the image. The method gives only a global clutter value for the whole image but deals with colors computing and summing the entropy for the luminance, and chrominance canals in the
where pi is the probability for a subband pixel of being in bin i
Then, the entropies of each subband are summed. Finally, luminance and chrominance summed entropies are combined with a weighted sum. Similar other methods based on wavelet decomposition and jpeg analogy have been proposed (Jégou and Deblonde, 2012, Ciolkosz-Styk and Styk, 2013).
3.3 Segmentation Based Clutter
This method has been proposed by Bravo and Farid (2008). The principle is to compute a segmentation of the image and to count the number of objects identified by the segmentation (Figure 2). The segmentation method used is scalable and efficient (Felzenszwalb and Huttenlocher, 2004).
Figure 2. (a) Topographic map at 1:15k. (b) segmentation of the map (a random color is assigned to each object)
When the segmentation threshold k increases, the number of segmented objects decreases and Bravo and Farid (2008) identified that it fitted with a power law (Equation 3) whose constant increases in cluttered images. This constant is then used as a measure of clutter.
� = �. �
− . (3)where n is the number of objects in the image k is the segmentation threshold
c is the power law constant and the clutter value
3.4 Edge Density
Edge detection methods seek to identify pixels where color brightness is discontinuous in an image (Figure 3). More edges are supposed to bring more complexity in images, and it was ISPRS Annals of the Photogrammetry, Remote Sensing and Spatial Information Sciences, Volume II-3/W5, 2015
successfully used as a simple clutter measure by Rosenholtz et al (2007). Edges can be used to locally measure clutter or globally by computing the edge density in the image. It can be considered as the image counterpart of the simple “vertex density” map complexity measure from McEachran (1982).
Figure 3. (a) Topographic map at 1:25k. (b) edges of the map (in white)
In our implementation, we used a simple sobel vertical and horizontal kernel for edge detection. Further work should investigate the use of other edge detection techniques.
4. DESCRIPTION OF THE TESTED MAPS
4.1 Scale and Symbolization Scale
Generalization aim is twofold: simplify data to reach legibility by reducing complexity, and preserving as much as possible the initial information. While legibility can be measured by considering only the final map, both complexity reduction and information preservation require an initial state to compare to. When the initial data is symbolized at a scale consistent with its level of detail (Figure 4a), it gives a good idea of the information to preserve, but not for the complexity as the map is legible. Then, the map with the initial data symbolized at the final scale (Figure 4b) is useful to measure how much complexity has to be reduced. As a consequence, initial maps with both initial and final symbolization scale will be used to compare clutter measures.
Figure 4. (a) initial data at 1:15k with a symbols scaled to 1:15k. (b) same data with symbols scaled to 1:25k. (c) data
generalized to 1:25k
4.2 Map Extracts
Two types of maps are used to experiment with the clutter measures: maps before/after generalization (Figure 5a) used in previous generalization research (e.g. Touya and Duchêne, 2011; Touya, 2012), and extracts from official topographic map series at several scales, where generalization was performed manually or semi-automatically (Figure 5b). Images to be compared have similar sizes and resolutions to avoid biases with some of the tested methods.
Figure 5. (a) map extracts from past generalization experiments. (b) maps at different scales extracted from official geoportal
All four clutter measures have been implemented in the open source Java platform Geoxygene (Bucher et al., 2012). The segmentation and edge detection implementations are based on the OpenIMAJ library (Hare et al., 2011).
5. RESULTS
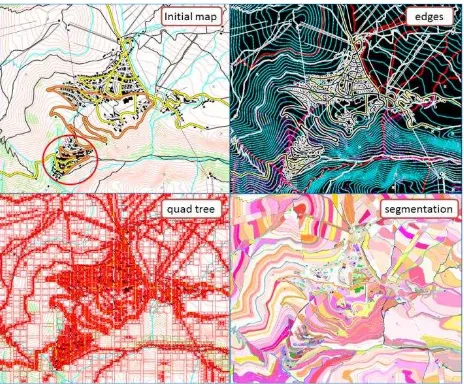
5.1 Identifying Too Cluttered Areas
The identification of too cluttered areas in a generalized map requires a method that does not only give a global clutter value. Contrary to subband entropy, edge density, quad tree complexity and segmentation clutter give some local information about clutter, and can be used to identify the more cluttered areas in the map. The three remaining methods have been tested on a generalized map with a problem in a part of the map resulting in a cluttered area (Figure 6). The analysis is only visual here, but all three methods allow us to identify the area as more cluttered than other parts of the map. However, only the segmentation clutter seems to identify this part as more cluttered to the village area in the center of the map, which appears much cluttered in both edge density and quad tree outputs (Figure 6). The segmentation clutter seems to be the best method to identify generalization based cluttered areas, but this assumption needs further test to be confirmed.
Figure 6. Identification of a cluttered area (circled in red in the initial map)
5.2 Preservation of the Global Amount of Information
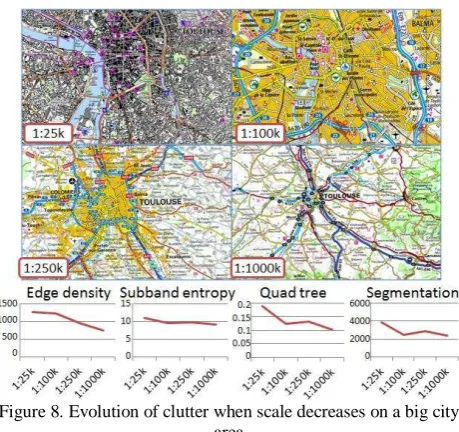
Map generalization is supposed to remain faithful to the initial information, thus preserving more or less the amount of information. The increase of symbol sizes as scale decreases implies a small increase of this amount, counterbalanced by the elimination of the least salient features. However, sometimes generalization requires abstraction transformations that mechanically modify the amount of information in the map: for instance in the test maps, buildings are represented individually at the 1:25k scale, and with built-up areas from the 1:100k scale (Figure 7 and Figure 8). The evolution of clutter, when scale decreases, is analyzed with four official French maps in a rural area (Figure 7), in a large city are (Figure 8), and in a mountain area (Figure 10).
Figure 7. Evolution of clutter when scale decreases
The three examples illustrate that the abstraction gap between 1:25k and 1:100k scales drastically decreases clutter. Subband entropy, quad tree complexity and segmentation clutter share the same pattern of clutter evolution with scale. All four methods seem to be good proxies for assessing the global amount of information in the map.
The edge density method behaves very differently than the other methods. In the rural area, it measures a collapse of clutter at the 1:250k scale, that can be explained by a quite homogeneous background regarding colors (mostly main roads and cities are highlighted in this map). In the city area, edge density clutter does not decrease at the 1:100k scale. One explanation can be that there are so many buildings that they are seen as a homogeneous background, quite similar to the yellow built-up area at 1:100k.
Figure 10 shows that the choices for relief representation (shading, contour lines, hatching…) greatly influence how clutter is measured when image-based methods are used.
Figure 8. Evolution of clutter when scale decreases on a big city area
5.3 Handling of Occlusions and Overlaps
Not surprisingly, the tested image-based clutter measures do not consider occlusion and overlap reduction by generalization as a clutter reduction (Figure 9), because occlusions and overlaps are lost when rasterizing the map without transparency.
Figure 9. Generalization solves occlusions and overlaps but increases image-based clutter
There is an exception with the segmentation method that considers that generalization reduced clutter in this map. This might be because objects are easier to segment in the generalized map. For instance, building size and density increases, and groups of generalized buildings might be segmented in one single feature while buildings are often segmented as single features in the ungeneralized maps (Figure 11).
Figure 10. Evolution of clutter when scale decreases in a mountain area
Figure 11. Generalization increases building size and density enabling the segmentation to create bigger features
5.4 Background and Foreground
In a topographic map, but also in other kinds of maps, some layers are important and lie in the foreground of the map (e.g. roads and buildings), while others lie in the background of the map (e.g. relief as contour lines or shaded). Clutter in foreground layers is much more annoying than clutter in background layers. In order to assess the sensitivity of our four clutter methods to map background, a map (Figure 12) is compared to version without background (contour lines and forests here), with transparency applied to background layers, and with paler shades applied to background colors (Table 1). Removing background clearly reduces clutter, except for edge density. The effects of paler shades and transparency are more random with the different methods. The increase of edge density clutter when background is removed is confirmed in other tested maps, and may be explained by an increase of contrasts in the map without the quite continuous background.
Edge density
Subband entropy
Quad tree
Segmen-tation
initial map 1432 4.91 0.058 1076
no background 2427 2.39 0.028 431
transparency 1543 4.17 0.028 633
paler shades 542 4.95 0.028 927
Table 1. Background influences on clutter
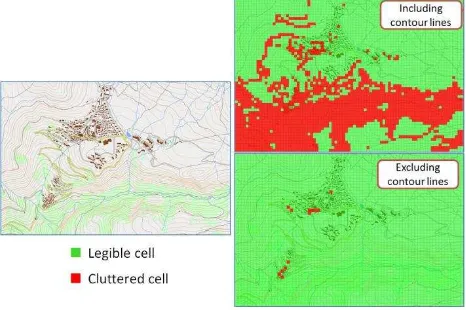
For the sake of comparison, a map complexity measure using vector data (Olsson et al., 2011) has been tested to demonstrate its potential to capture background/foreground differences. Whether symbol overlaps with contour lines are included in the complexity computation, or not, results clearly differ (Figure 12).
Figure 12. A vector based complexity method able to include or exclude background layers
5.5 Reduction of Blank Space
Generalization naturally tends to fill blank space in order to display more information without increasing too much information density (Figure 13). Thus, this kind of crowding information is not necessarily a bad generalization, and this should not influence clutter measures too much.
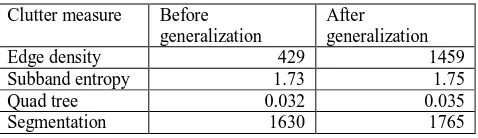
Figure 13. A small town at 1:50k before and after generalization, reducing blank space in the map
Table 2 shows the clutter of both Figure 13 maps. While all four clutter measures increase with generalization, only edge density shows a drastic increase in clutter. So edge density should be used carefully in regards to its blank reduction sensitivity, compared to other clutter measures.
Clutter measure Before
Table 2. Clutter increases due to blank reduction
6. CONCLUSION AND FURTHER WORK
This paper proposed a comparison of four image based clutter measures in the context of the global evaluation of generalized maps. The main contribution of the paper is the experimentation of measuring clutter differently for a large set of generalized based clutter methods for generalization evaluation. The first step would be to test other methods on the same maps, particularly what Moacdieh and Sarter (2014) call the display layout perspective, such as the feature congestion method from Rosenholtz et al (2007), the color clustering method from Lohrenz et al (2009), or the crowding model from van den Berg et al (2009), or methods following the performance cost perspective, based on user tests (e.g. Beck et al., 2010). As such methods measure different aspects of clutter they should handle overlaps or blank reduction differently than the four tested methods. Then, it will be necessary to compare the image based methods with existing (or new) vector based methods (Jansen and van Kreveld, 2001; Olsson et al., 2011) to better quantify and qualify how they measure clutter differently.
These clutter evaluations should also be analyzed in regards to existing global evaluation methods for map generalization (Touya, 2012). Finally, the combination of the clutter methods should be investigated to see if the methods advantages can be smartly combined. For instance, the domain of multiple criteria decision (Figueira et al., 2005) has already been successfully applied to cartography (e.g. Touya and Brando, 2013; Taillandier and Taillandier, 2012).
ACKNOWLEDGEMENTS
This work is partially supported by the French National Research Agency, MapMuxing project [ANR-14-CE24-0011-01].
REFERENCES
Bard, S., 2004. Quality assessment of cartographic generalisation. Transactions in GIS, 8 (1), pp. 63-81.
Beck, M. R., Lohrenz, M. C., Trafton, J. G., 2010. Measuring search efficiency in complex visual search tasks: Global and local clutter. Journal of Experimental Psychology: Applied, 16 (3), pp. 238-250.
Bjørke, J. T., 1996. Framework for entropy-based map evaluation. Cartography and Geographic Information Systems, 23(2), pp. 78-95.
Bravo, M. J., Farid, H., 2008. A scale invariant measure of clutter. Journal of Vision, 8 (1).
Bucher, B., Brasebin, M., Buard, E., Grosso, E., Sébastien, M., Perret, J., 2012. GeOxygene: Built on top of the expertness of the french NMA to host and share advanced GI science research results. In: Bocher, E., Neteler, M. (Editors.), Geospatial free and open source software in the 21st century. Springer, Berlin Heidelberg, pp. 21-33.
Burghardt, D., Duchêne, C. and Mackaness, W. A. (Editors), 2014. Abstracting Geographic Information in a Data Rich World: Methodologies and Applications of Map Generalisation. Springer, Berlin.
Ciolkosz-Styk, A., Styk, A., 2013. Advanced image processing for maps graphical complexity estimation. In 26th International Cartographic Conference, Dresden, Germany.
Fairbairn, D., 2006. Measuring map complexity. The Cartographic Journal, 43 (3), pp. 224-238.
Felzenszwalb, P. F., Huttenlocher, D. P., 2004. Efficient Graph-Based image segmentation. International Journal of Computer Vision, 59 (2), pp. 167-181. multimedia analysis and indexing of images. In: Proceedings of the 19th ACM international conference on Multimedia. MM '11. ACM, New York, NY, USA, pp. 691-694.
Jansen, M. and van Kreveld, M., 1998. Evaluating the consistency of cartographic generalization. In: Proceedings of the 8th International Symposium on Spatial Data Handling, Vancouver, Canada, pp. 668-678.
Jégou, L. and Deblonde, J.-P., 2012. Vers une visualisation de la complexité de l'image cartographique. Cybergeo: European Journal of Geography.
Lohrenz, M. C., Trafton, J. G., Beck, M. R., Gendron, M. L., 2009. A model of clutter for complex, multivariate geospatial displays. Human Factors, 51 (1), pp. 90-101.
MacEachren, A. M., 1982. Map complexity: comparison and measurement. American Cartographer, 9, pp. 31-46.
Mackaness, W. A. and Ruas, A., 2007. Evaluation in the map generalisation process. In: MacKaness, W. A., Ruas, A., Sarjakoski, L. T. (Editors), Generalisation of Geographic Information. Elsevier, London, pp. 89-111.
Moacdieh, N., and Sarter, N., 2014. Display clutter: A review of definitions and measurement techniques. Human Factors: The Journal of the Human Factors and Ergonomics Society.
Olsson, P.-O., Pippig K., Harrie, L. E., and Stigmar, H., 2011. Identifying map regions that are difficult to read. Mapping and Image Science, 3, pp. 22-29.
Rosenholtz, R., Li, Y., Nakano L., 2007. Measuring visual clutter. Journal of Vision, 7(2).
Shannon, C. E., Weaver, W., 1949. The Mathematical Theory of Communication. University of Illinois Press.
Stigmar, H., Harrie, L. E., 2011. Evaluation of analytical measures of map legibility. The Cartographic Journal, 48(1), pp. 41-53.
Stoter, J., Zhang, X., Stigmar, H., Harrie, L., 2014. Evaluation in generalisation. In: Burghardt, D., Duchêne, C., Mackaness, W. (Editors), Abstracting Geographic Information in a Data Rich World. Springer, Berlin, pp. 259-297.
Taillandier, P., Taillandier, F., 2012. Multi-criteria diagnosis of control knowledge for cartographic generalisation. European Journal of Operational Research, 217 (3), pp. 633-642.
Töpfer, F., and Pillewizer, W., 1966. The principles of selection: a means of cartographic generalization. The Cartographic Journal, 3 (1), pp. 10-16.
Touya, G., 2012. Social welfare to assess the global legibility of a generalized map. In Xiao, N., Kwan, M. P., Goodchild, M. F., Shekhar, S., (Editors), Geographic Information Science-7th International Conference, GIScience 2012. Springer, Berlin, pp. 198-211.
Touya, G., Brando-Escobar, C., 2013. Detecting Level-of-Detail inconsistencies in volunteered geographic information data sets. Cartographica: The International Journal for Geographic Information and Geovisualization, 48 (2), pp. 134-143.
Touya, G., and Duchêne, C., 2011. CollaGen: Collaboration between automatic cartographic generalisation processes. In A. Ruas (Ed.), Advances in Cartography and GIScience. Springer, Berlin, Heidelberg, pp. 541-558.
Touya, G., Christophe, S., and Hoarau, C., 2015. Clutter and Map Legibility in Automated Cartography: A Research Agenda. Cartographica, to be published.
van den Berg, R., Cornelissen, F. W., Roerdink, J. B. T. M., 2009. A crowding model of visual clutter. Journal of Vision, 9 (4).