NEW LIGHT-WEIGHT STEREOSOPIC SPECTROMETRIC AIRBORNE IMAGING
TECHNOLOGY FOR HIGH-RESOLUTION ENVIRONMENTAL REMOTE SENSING
–
CASE STUDIES IN WATER QUALITY MAPPING
E. Honkavaara a, *, T. Hakala a, J. Kirjasniemib, A. Lindforsc, J. Mäkynen d, K. Nurminen a, P. Ruokokoski b, H. Saarid , L. Markelin a a
Finnish Geodetic Institute, Department of Remote Sensing and Photogrammetry, Geodeetinrinne 2, P.O. Box 15, FI-02431 Masala, Finland – (eija.honkavaara, teemu.hakala,kimmo.nurminen,lauri.markelin)@fgi.fi
b
Lentokuva Vallas Oy, Taitajankuja 2 A, 33960 PIRKKALA, Finland – (jussi.kirjasniemi, pentti.ruokokoski)@lentokuva.fi c
Luode Consulting Oy, Sandfallintie 85, FI-21600 Parainen, Finland ([email protected]) d
VTT Technical Research Centre Finland, P.O.Box 1000, FI-02044 VTT, Finland – (heikki.saari, jussi.makynen)@vtt.fi
Commission I/4
KEY WORDS: Photogrammetry, Geometry, Radiometry, Hyper spectral, Environment, Classification, High-resolution
ABSTRACT:
A new Fabry-Perot interferometer (FPI) based light-weight spectrometric camera provides new possibilities for environmental remote sensing applications. The sensor collects spectral data cubes with adjustable spectral properties in a rectangular image format, and so stereoscopic data can be obtained by gathering images in block structures with overlapping images. The FPI camera thus enables stereoscopic, spectrometric remote sensing applications with light-weight, low-cost airborne imaging systems. Our objective is to investigate the processing and use of this new imaging technology in a water quality mapping. We carried out imaging campaigns over a small lake in summer and autumn 2012 using a light-weight unmanned airborne vehicle (UAV) and a small manned airborne vehicle (MAV). We present the preliminary results of these campaigns.
* Corresponding author.
1. INTRODUCTION
One of the recent innovations in the field of airborne remote sensing is the Fabry-Perot interferometer (FPI) based light-weight spectrometric camera developed by the VTT Technical Research Centre Finland (VTT) (Mäkynen et al., 2011; Saari et al., 2011). It provides spectral data cubes with a rectangular image format, giving a possibility for production of spectral 3D information when images are collected in image blocks with stereoscopic overlaps. The new FPI technology is highly relevant, because it offers new possibilities for low-cost, flexible, quantitative remote sensing applications from light-weight airborne platforms. An important advantage of the airborne technology with unmanned airborne vehicles (UAVs) or small manned aircrafts (MAVs) is that 3D spectrometric data can be collected even in poor imaging conditions, under clouds, which makes the method truly operational in environmental measuring and monitoring applications.
We are investigating and developing the processing and use of this novel imaging technology in environmental remote sensing. Characteristic to the technology is that the area of interest is covered by a huge number of overlapping, small format, spectral data cubes. Furthermore, the objective is to use this new technology in highly variable imaging conditions, such as cloudy or partially cloudy weather. These aspects set up new requirements for the radiometric and geometric processing in photogrammetric environment.
In our previous investigations we used the FPI camera in precision farming application (Honkavaara et al., 2012a). In this investigation, our objective is to investigate the use of this technology in water quality mapping. Idea is to develop a fast
method to provide high-resolution data from complex environments such as lakes, rivers and harbour areas and places where use of traditional sampling methods is limited. The technique could be potential for the measurement and monitoring of water quality parameters such as type, frequency and intensity of algae blooms, water transparency, turbidity, organic carbon, total phosphorus concentrations, and chlorophyll-a (Lindfors et al., 2005).
We carried out imaging campaigns with the FPI spectral camera using MAV and UAV platforms in summer and autumn 2012. In all of these campaigns, imaging conditions were extremely challenging, which provided highly variable data quality; this was characteristic for the summer 2012 in Finland during the entire season for vegetation remote sensing. We describe our methods and the empirical data sets in Section 2 and we give the preliminary results in Section 3.
2. EXPERIMENTAL DATA
2.1 FPI spectrometric camera
VTT has been developing spectrometric camera, which is based on a Piezoactuated Fabry-Perot interferometer (FPI) with an adjustable air gap (Mäkynen et al., 2011; Saari et al., 2011). The basic principle of the sensor is to provide different spectral layers by changing the FPI air gap. The FPI spectral camera can operate in the wavelength range of 400-1000 nm, with a full width at half maximum (FWHM) of 10-40 nm; the number of bands and their characteristics can be selected flexibly according to the requirements of the application. The latest prototype imager (v. 2012) weighs only about 600 g and is thus
suitable even for very light-weight UAVs, but it can be also operated from MAVs. Components of the imaging system in the airborne use include the camera, a 32 Gbyte compact flash memory card, two irradiance sensors, a GPS receiver, and a LiPo battery (Figure 1). The image size in the typical configuration is 1024 x 648 pixels and the pixel size is 11 μm. Characteristic to the FPI imaging principle is that different layers of the spectral data cube are collected with small time delays, so the layers are not perfectly overlapping (Honkavaara et al., 2012a, b).
Figure 1. The FPI spectrometric imaging system including the camera, a 32 Gbyte compact flash memory card, two irradiance sensors, a GPS receiver and a LiPo battery
2.2 Processing of FPI camera data
We have developed a processing chain for the FPI imagery. The processing steps are as follows:
1. System corrections of the images using the laboratory calibration, spectral correction and dark signal correction. These parameters and algorithms are provided by VTT (Mäkynen et al., 2011; Rainio, 2013).
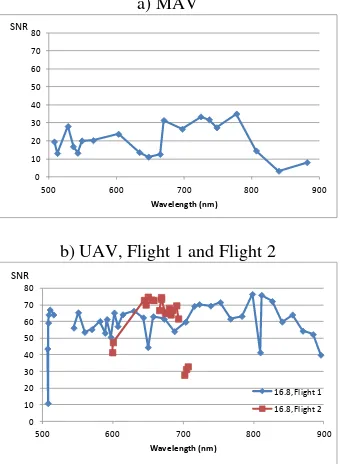
2. Image quality assessment, signal-to-noise ratio calculation (SNR).
3. Pixel transformation from 32 bit float format to 16 bit unsigned integer format.
4. Matching of layers to form spectral data cubes of individual images.
5. Determination of image orientations of reference layers using a self-calibrating bundle block adjustment (Honkavaara et al., 2012a, Rosnell and Honkavaara, 2012).
6. Optionally also a DSM can be calculated (Rosnell and Honkavaara, 2012).
7. Determination of radiometric imaging model to compensate atmospheric and illumination influences, and view/illumination related nonuniformity, as well as reflectance transformation. A radiometric block adjustment method is being developed to determine optimal parameters by utilizing the overlapping images (Honkavaara et al., 2012a, 2012b).
8. Calculation of output products, which include 3D spectral point clouds, digital surface models, spectrometric image mosaics and object bidirectional reflectance data (Honkavaara et al., 2012b).
The processing is implemented at the FGI in a processing environment based on BAE Systems SOCET SET and GXP photogrammetric software. The system corrections are developed by VTT (step 1) and the software for layer matching and radiometric processing is developed by FGI (steps 2-4, 7, 8).
2.3 Test area
The area of interest is a shallow lake Petäjärvi, approximately of size of 1 km2, located in the area of the well-known photogrammetric test field Sjökulla in Southern Finland (60˚ 14'
31" N, 24˚ 23' 03" E) (Honkavaara et al., 2008).
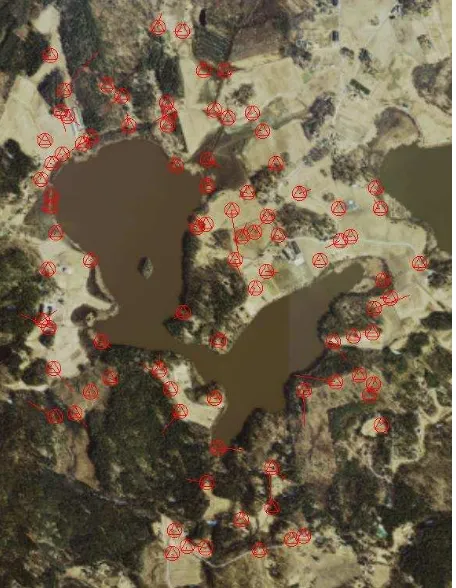
For this study, we georeferenced the imagery using easily identifiable features measured from national orthophotos and we obtained heights for these points from national laser scanning height model (these are all national open access data). For the entire area, we used altogether 90 GCPs (Figure 2).
During the campaign, Luode Oy carried out water quality measurements. For the radiometric reference we had reflectance reference targets. In the UAV campaign portable reference targets were used while in the MAV campaign the permanent reflectance targets at the Sjökulla test field were used. We carried out insitu reflectance measurements using the Avantes hand held spectrometer.
Figure 2. The test area. 3D XYZ ground control points were taken from the national open digital orthoimages and digital height model. © The National Land Survey of Finland. Colour orthophoto Elevation model 10
m. 01/2013,
http://www.maanmittauslaitos.fi/en/NLS_open_data _licence_version1_20120501
2.4 Campaigns with UAV
UAV campaigns were carried out under partially cloudy weather conditions in August 16, 2012 (Figure 3). The FPI camera was operated from a helicopter UAV having a maximum payload of 5 kg. We used a flying altitude of 150 m, which is the maximum allowed altitude for UAV flights in free airspace in Finland. The resulting GSD was 15 cm and the image footprint was 154 m by 97 m. The lake was collected in two parts because of the regulations for flight distances in Finland; the UAV has to be under visible control of the operator during the flight. The eastern part (Area 1) was collected in 5 flight lines and the western part (Area 2) was collected in 10 flight lines.
The spectral camera was operated with many different filter configurations: 400-500 nm, 500-900 nm and 600-750 nm in separate flights; numbers of spectral bands varied between 29 and 42 depending on filters. The camera was operated in a continuous interval mode. Details of the image data are given in Table 1. Two image blocks were collected in Area 1 and three blocks were collected in Area 2.
Figure 3. The FPI spectral camera in a helicopter UAV. Right: Radiometric reference targets in the campaign area.
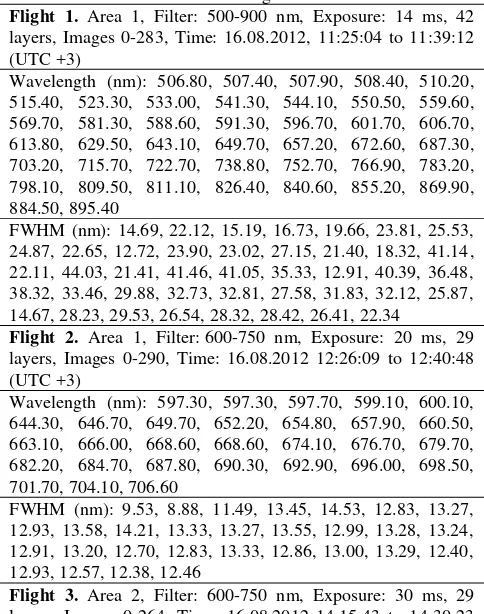
Table 1. Parameters of the UAV flight on 16.8.2012
Flight 1. Area 1, Filter: 500-900 nm, Exposure: 14 ms, 42 layers, Images 0-283, Time: 16.08.2012, 11:25:04 to 11:39:12 (UTC +3)
Wavelength (nm): 506.80, 507.40, 507.90, 508.40, 510.20, 515.40, 523.30, 533.00, 541.30, 544.10, 550.50, 559.60, 569.70, 581.30, 588.60, 591.30, 596.70, 601.70, 606.70, 613.80, 629.50, 643.10, 649.70, 657.20, 672.60, 687.30, 703.20, 715.70, 722.70, 738.80, 752.70, 766.90, 783.20, 798.10, 809.50, 811.10, 826.40, 840.60, 855.20, 869.90, 884.50, 895.40
FWHM (nm): 14.69, 22.12, 15.19, 16.73, 19.66, 23.81, 25.53, 24.87, 22.65, 12.72, 23.90, 23.02, 27.15, 21.40, 18.32, 41.14, 22.11, 44.03, 21.41, 41.46, 41.05, 35.33, 12.91, 40.39, 36.48, 38.32, 33.46, 29.88, 32.73, 32.81, 27.58, 31.83, 32.12, 25.87, 14.67, 28.23, 29.53, 26.54, 28.32, 28.42, 26.41, 22.34
Flight 2. Area 1, Filter: 600-750 nm, Exposure: 20 ms, 29 layers, Images 0-290, Time: 16.08.2012 12:26:09 to 12:40:48 (UTC +3)
Wavelength (nm): 597.30, 597.30, 597.70, 599.10, 600.10, 644.30, 646.70, 649.70, 652.20, 654.80, 657.90, 660.50, 663.10, 666.00, 668.60, 668.60, 674.10, 676.70, 679.70, 682.20, 684.70, 687.80, 690.30, 692.90, 696.00, 698.50, 701.70, 704.10, 706.60
FWHM (nm): 9.53, 8.88, 11.49, 13.45, 14.53, 12.83, 13.27, 12.93, 13.58, 14.21, 13.33, 13.27, 13.55, 12.99, 13.28, 13.24, 12.91, 13.20, 12.70, 12.83, 13.33, 12.86, 13.00, 13.29, 12.40, 12.93, 12.57, 12.38, 12.46
Flight 3. Area 2, Filter: 600-750 nm, Exposure: 30 ms, 29 layers, Images 0-264, Time: 16.08.2012 14:15:43 to 14:30:23
(UTC +3). Spectral settings were the same as in Flight 2. Flight 4. Area 2, Filter: 400-500 nm, Exposure: 25 ms, 34 layers, Images 0-366, Time: 16.08.2012 15:10:32 to 15:31:08 (UTC +3)
Wavelength (nm): 414.80, 416.20, 416.80, 418.70, 420.50, 422.50, 424.40, 426.40, 428.40, 430.30, 432.20, 434.30, 436.50, 438.50, 440.60, 442.70, 445.00, 447.10, 449.20, 451.20, 474.70, 477.20, 480.00, 482.20, 485.90, 487.50, 488.20, 488.90, 489.20, 489.30, 489.30, 489.60, 489.60, 489.70
FWHM (nm): 14.22, 14.81, 14.73, 15.62, 15.12, 14.11, 14.37, 14.38, 14.01, 14.43, 14.07, 14.53, 14.42, 14.40, 14.50, 14.84, 14.83, 14.66, 14.67, 14.39, 15.17, 15.56, 14.70, 14.37, 13.34, 12.31, 12.50, 13.49, 13.69, 11.41, 13.87, 11.60, 12.10, 12.01 Flight 5. Area 2, Filter: 400-500 nm, Exposure: 80 ms, 34 layers, Images 0-134, Time: 16.08.2012 15:57:45 to 16:13:09 (UTC +3). Spectral settings were the same as in Flight 4.
2.5 Campaign with MAV
The MAV campaign was carried out on 25.9.2012. Weather conditions were extremely poor: cloudy and dark, and in some parts of the flight even rainy. The FPI camera was operated from a manned single engine aircraft OH-CNU, Cessna 172 Reims Rocket, by Lentokuva Vallas Oy.
Two image blocks were collected from a flying altitude of 440 m over terrain, with a flight speed of 39 m/s. The area of 8 km2 (2 km x 4 km) was covered by 10 lines, with a 200 m flight line spacing. The average forward overlaps were 63% and side overlaps were 56%. A single flight covered a large area, including the lake Petäjärvi, some agricultural and forest scenes and the Sjökulla test field. The GSD was about 45 cm and the image footprint was about 292 m by 461 m. 20 spectral bands were collected in the spectral region of 500-900 nm. In the blocks, different exposure times of 8 ms and 14 ms were used. We selected to use the data with 14 ms integration time in the investigation, because it suited better for the imaging conditions. Camera was operated with a continuous interval mode with an image interval of approximately 2 s. In this campaign, the FPI camera was operated for the first time from a manned platform. Details of the image data are given in Table 2.
Figure 4. Installation of the FPI spectral camera in the floor opening in the manned aircraft.
Table 2. Parameters of the MAV flight on 25.9.2012
Sjökulla, Filter: 500-900 nm, Exposure: 14 ms, 20 layers, Images 0-443, Time 25.9.2012. 13.29.29-13.49.19 (UTC +3), Solar azimuth: 187.4˚, Solar elevation: 28.5˚
Wavelength (nm): 507.50, 512.10, 527.80, 535.60, 542.20, characterizing the image quality. In particular, with narrow band hyperspectral images SNR is often a central challenge. We calculated the SNR as a ratio of the average gray value and standard deviation in a small image window using homogeneous targets. These SNR values are only indicative because the targets were not perfectly uniform, which increased the noise level and resulted in decrease of SNR.
In the case of MAV image data, we used a white permanent conditions and low atmospheric transmittance; in better conditions better values are obtained.
In the case of UAV images, we calculated SNRs using tarpaulin with a nominal reflectance of 0.2. We used this low reflectance target, because many of the layers were saturated already with a 0.3 reflectance and even lower, which was due to fact that the exposure settings were optimized for measuring dark water object, not for very bright targets. SNR values were for the flight with 500-900 nm filter mostly 50-70 and for the 600-700 nm filter 60-70, which can be considered to be of good quality. The problems close to the edges of the bandpass filter are nm b) UAV with 500-900 and 600-750 nm filters.
3.2 Campaign with MAV
3.2.1 Georeferencing: Georeferencing was performed using three-layer images (layers 4, 10 and 20) collected with simultaneous exposure. In the geometric processing, the apriori orientation information was not of sufficient quality, so the block was organized using interactive support. In the block adjustment, we used altogether 90 GCPs taken from the national open access orthophoto and DSM (Figure 1). For the final orientations, automatic tie point measurement was carried out. The images that contained only water were difficult to integrate in the block, for those, the image orientations were interpolated from the adjacent images.
The standard error of unit weight after the block adjustment was 0.50 pixels. The RMS values of residuals at GCPs were 0.69 m, 0.70 m and 0.18 m in X, Y and Z coordinates, respectively. The RMS values of estimated standard deviations were for the point unknowns 0.22 m, 0.15 m, 0.81 m (X, Y, Z) and for the orientation unknowns 1.02 m, 1.20 m, 0.32 m, 0.155°, 0.132°, 0.028° (X0, Y0, Z0, ω, φ, κ). These values represented successful aerial triangulation and the expected geometric accuracy is 1-2 m, which is compatible to the national topographic data used as the georeference.
3.2.2 Radiometric processing: The variable imaging conditions caused great variations in image radiometry (Figure 6a). The flight started from the western part of the area. At the central part of the block the deterioration of weather is visible: the weather changed from dark and cloudy into darker and rainy. Radiometric block adjustment was carried out. We used only the relative radiometric offset term, because the weather was cloudy and the BRDF correction was not feasible (see details in Honkavaara et al., 2012a). The correction eliminated efficiently the radiometric nonuniformity (Figure 6b).
We used an average coefficient-of-variation value at radiometric tie points (standard deviation of gray values divided by the average grey value in overlapping images) as the uniformity metrics of the block radiometry. Without any radiometric correction, the averaged coefficient-of-variation values in radiometric tie points were 0.10-0.14. When radiometric correction was used, the coefficient-of-variation values improved to 0.06-0.12. The results with corrected data were not as good as our previous results in agricultural application (Honkavaara et al., 2012a). In uniform water areas it appeared that there were some darkening in the individual images towards the edges, which might be due to a light falloff effect caused by the imaging through the camera opening. The current software does not model this phenomenon, but it can be implemented in the future, as well as other correction terms. The uniformity results were not very good, as far as the objective is to obtain reflectance accuracy of 0.05, which suggests that the coefficient-of-variation should be well below 0.05. However, the metrics was calculated nearly using entire areas of individual images, while in the mosaic only central part of each image is used, so in the mosaic the uniformity is likely to be clearly better. In the future, better metrics is needed to assess the uniformity in object level. As the conclusion, the conditions were so extreme that it will not be possible to produce high accuracy reflectance information from the data.
a)
b)
Figure 6. The spectral datacube mosaic with 20 layers collected by the manned aircraft (in the image composite layers 17, 8 and 3 are used) a) no radiometric corrections and b) the corrected image mosaic. North is up and East is right. Data used in georeferencing © The National Land Survey of Finland, Colour orthophoto and Elevation model 10
m, 01/2013,
http://www.maanmittauslaitos.fi/en/NLS_open_data _licence_version1_20120501
0 0.02 0.04 0.06 0.08 0.1 0.12 0.14 0.16 0.18 0.2
500 600 700 800 900
Wavelength (nm)
no rad_ba
Coefficient of variation
Figure 7. Coefficient of variation at radiometric tie points without any radiometric corrections (no) and with radiometric block adjustment with relative offset parameters (rad_ba).
3.3 UAV campaigns
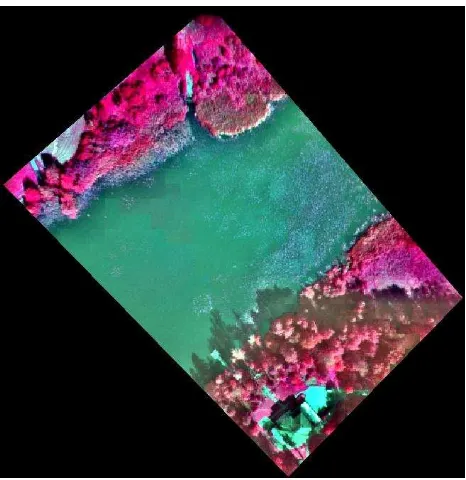
We calculated a small mosaic using the UAV spectral imagery when using the filter 500-900 nm (Figure 8). Image quality appeared to be good and the algae were clearly visible in the images. The data set contains many interesting wavelengths for the assessment of the water quality parameters and these will be evaluated in our forthcoming investigations.
Figure 8. A UAV image mosaic of size of 140 m by 250 m and with a 0.20 m GSD. Georeferencing based on: © The National Land Survey of Finland, Colour orthophoto and Elevation model 10 m, 01/2013, http://www.maanmittauslaitos.fi/en/NLS_open_data _licence_version1_20120501
3.4 Comparison of campaigns from UAV and MAV
It is not feasible to compare image quality from MAV and UAV flights. This is due to the fact that imaging conditions were much poorer in the flight campaign with the MAV. This appeared both as lower level irradiance as well as lower atmospheric transmittance.
The advantage with the MAV campaign was that much larger area could be collected efficiently than with a low altitude UAV. This is expected to lead in many applications to better cost-efficiency. The advantage of the UAV platform was that there were better possibilities for adjusting the flight speed, which was essential for the camera that was used. We used flight speeds of 3 m/s to 10 m/s with the UAV while for the MAV the flight speed was 39 m/s. The flight speed has to be compromised with the GSD. Water quality applications typically work with satellite imagery, with GSDs of 1-10 m, so we expect that good results could be obtained with both data sets.
The final conclusions about the usefulness of the data from different platforms and in different conditions can be made based on results with practical applications. Carrying out these application related evaluations will be the next step in this project.
4. CONCLUSIONS
We presented the preliminary results of campaigns for water monitoring purposes that were carried out using a new FPI spectral camera that was mounted in manned and unmanned platforms. These campaigns included many new features: they were the first water monitoring campaigns with the FPI camera, the FPI camera was operated for the first time from a manned platform, and many filter combinations that have not been used ever before were used. Our first evaluations showed that the technology is very promising.
5. REFERENCES
Honkavaara, E., J. Peltoniemi, E. Ahokas, R. Kuittinen, J. Hyyppä, J. Jaakkola, H. Kaartinen, L. Markelin, K. Nurminen, J. Suomalainen, 2008. A permanent test field for digital photogrammetric systems. Photogrammetric Engineering & Remote Sensing, 74(1): 95-106.
Honkavara, E., Hakala, T., Saari, H., Markelin, L., Mäkynen, J., Rosnell, T., 2012a. A process for radiometric correction of UAV image blocks. Photogrammetrie, Fernerkundung, Geoinformation (PFG) 2/2012, pp. 115-127.
Honkavaara, E., Kaivosoja, J., Mäkynen, J., Pellikka, I., Pesonen, L., Saari, H., Salo, H., Hakala, T., Markelin, L., and Rosnell, T., 2012b. Hyperspectral reflectance signatures and point clouds for precision agriculture by light weight UAV imaging system, ISPRS Ann. Photogramm. Remote Sens. Spatial Inf. Sci., I-7, 353-358, doi:10.5194/isprsannals-I-7-353-2012, 2012.
Lindfors, A., Rasmus, K., Strömbeck, N., 2005. Point or pointless – quality of ground data. International Journal of
Remote Sensing, 26 (2), DOI:
10.1080/01431160410001720261
Mäkynen, J., Holmlund, C., Saari, H., Ojala, K., Antila, T., 2011. Unmanned aerial vehicle (UAV) operated megapixel spectral camera, Proc. SPIE 8186B.
Rainio, K., Instructions for FP_HC_Viewer.exe program. VTT Techical Research Centre of Finland, 10 p. 11.1.2013.
Rosnell, T., Honkavaara, E, 2012. Point Cloud Generation from Aerial Image Data Acquired by a Quadrocopter Type Micro
Unmanned Aerial Vehicle and a Digital Still Camera. Sensors 2012, 12, 453-480.
Saari, H., Pellikka, I., Pesonen, L., Tuominen, S., Heikkilä, J., Holmlund, C., Mäkynen, J., Ojala, K., Antila, T., 2011. Unmanned Aerial Vehicle (UAV) operated spectral camera system for forest and agriculture applications, Proc. SPIE 8174.
6. ACKNOWLEDGEMENTS
This work was carried out in the MMEA research program coordinated by Cleen Ltd. with funding from the Finnish Funding Agency for Technology and Innovation, Tekes.