INTERGRATION OF LiDAR DATA WITH AERIAL IMAGERY FOR ESTIMATING
ROOFTOP SOLAR PHOTOVOLTAIC POTENTIALS IN CITY OF CAPE TOWN
A. K. Adeleke a, * and J. L. Smit b
a Geomatics Division, School of Architecture, Planning and Geomatics, University of Cape Town, Private Bag X3, Rondebosch, 7700, South Africa - [email protected]
b Geomatics Division, School of Architecture, Planning and Geomatics, University of Cape Town, Private Bag X3, Rondebosch, 7700, South Africa - [email protected]
Commission VII, WG VII/6
KEY WORDS: LiDAR Data, Aerial Imagery, Roof Extraction, Solar Photovoltaics
ABSTRACT:
Apart from the drive to reduce carbon dioxide emissions by carbon-intensive economies like South Africa, the recent spate of electricity load shedding across most part of the country, including Cape Town has left electricity consumers scampering for alternatives, so as to rely less on the national grid. Solar energy, which is adequately available in most part of Africa and regarded as a clean and renewable source of energy, makes it possible to generate electricity by using photovoltaics technology. However, before time and financial resources are invested into rooftop solar photovoltaic systems in urban areas, it is important to evaluate the potential of the building rooftop, intended to be used in harvesting the solar energy. This paper presents methodologies making use of LiDAR data and other ancillary data, such as high-resolution aerial imagery, to automatically extract building rooftops in City of Cape Town and evaluate their potentials for solar photovoltaics systems. Two main processes were involved: (1) automatic extraction of building roofs using the integration of LiDAR data and aerial imagery in order to derive its’ outline and areal coverage; and (2) estimating the global solar radiation incidence on each roof surface using an elevation model derived from the LiDAR data, in order to evaluate its solar photovoltaic potential. This resulted in a geodatabase, which can be queried to retrieve salient information about the viability of a particular building roof for solar photovoltaic installation.
* Corresponding author
1. INTRODUCTION
Countries around the world are grappling with the challenge of finding and promoting various sources of sustainable energy, which will align their attitude towards energy consumption with their environmental, social and economic targets (IEA, 2012). Likewise, both developed and emerging countries face similar energy and environmental challenges. South Africa, being among the developing countries is no exception. As a matter of fact, South Africa’s energy demand is projected to double its current levels by 2030 (SA GCIS, 2013).
Various studies have shown that renewable energy sources, especially the solar energy using photovoltaic systems, offer a viable and expedient means of meeting shortfalls in electricity production within a short period of time (Timilsina et al., 2012; Krupa & Burch 2011; Pegels 2010). Also, it has been discovered that in most part of the world, the technical potential of solar energy often exceeds the prevailing total primary energy consumption of such areas, when evaluated (De Vries et al., 2007). The viability of solar energy was recently further made obvious with its implementation in powering an aircraft (Solar Impulse 2): for the first time in history, an aircraft was able to fly day and night, even for longer periods of time, up to 100 hours, without using fuel.
This study was aimed at demonstrating how remote sensing and GIS techniques can be integrated to automatically extract building roofs, and evaluate its potentials for solar photovoltaics in the city of Cape Town. Considering the huge
number of buildings involved, the automatic roof extraction process becomes a vital aspect of rooftop solar photovoltaic evaluation, especially when existing building roof outlines are not readily available as input. In achieving this, LiDAR-derived surface models were integrated with aerial imagery to detect and automatically extract each building roof outline. Then the global solar radiation over each roof surface was estimated using a LiDAR-derived DSM. The final stage involved combining the outputs of the automatic roof extraction process, the solar radiation estimation with other energy exploitation parameters, such as solar panel efficiency to determine an estimate of electricity each building roof can harvest through the solar photovoltaic systems.
2. BACKGROUND 2.1 Solar Energy
Solar radiation can be harnessed and converted to electricity using the photovoltaic cells, which absorbs photons and then release electrons, these can then be captured in the form of an electric current (Knier, 2002). However, there are some key issues affecting the wider use of solar energy, these includes strong spatial and temporal variations, as well as the ability to efficiently quantify the amount of solar radiation incident over a surface (Hofierka & Kanuk, 2009).
on the earth; these could be spatial or temporal. It includes, atmospheric conditions, geometry of the earth and the terrain (Suri & Hofierka, 2004). To determine the solar photovoltaic potential of a building roof, two main stages are involved. The first stage involves extracting the building roof outline in order to determine the roof area; while, the second stage involves calculating the amount of global solar radiation incident upon such roof, so as to estimate its solar photovoltaic potential.
2.2 Automatic Extraction of Building Roofs
The detection and extraction of relevant features from remotely sensed data is fast becoming important in various fields of application, such as city planning, homeland security, disaster management, real estate industry, enumerations and electricity utility among others (Cheng et al., 2008). The accurate extraction of the roof structure from a LiDAR data and/or satellite imagery is vital in estimating the rooftop solar photovoltaic potential of an area or region. However, 100% successful automatic extraction of buildings or rooftops is still an unachievable goal, as a result of scene complexity, incomplete cue extraction and sensor dependency (Sohn & Dowman, 2007).
Building or rooftop detection techniques can be categorized into three groups, namely extraction from imagery, extraction from LiDAR data, or integration of imagery and LiDAR data (Lee et al., 2008). The earliest form of automatic extraction of man-made objects, such as rooftops, buildings and roads from urban scenes were carried out using aerial imagery as input. However, the introduction of LiDAR has indeed offered a favorable alternative for improving the level of automation in building detection and extraction, as compared to image-based extraction (Vu et al., 2009). Even with the improvements brought about with the introduction of LiDAR data, some authors have identified various issues with object extraction using the LiDAR data only. Amongst such, LiDAR data often provide more reliable height information but inconsistent boundary lines, and some regions in LiDAR data do possess null values as a result of the self-occlusion of a building or if water is present (Awrangjeb et al., 2010).
The integration of LiDAR data with imagery however, provides complementary benefits in extracting features, especially building rooftops, as each technique compensates for the shortcomings of the other (Awrangjeb et al., 2010). The combination of LiDAR data with imagery to extract building roofs offers increased options, such as the use of height, spectral and intensity information. Various combinations of such options are then used in extracting any object of interest. Extraction processes using the integration of LiDAR data and imagery can be further differentiated into “Edge Detection and Extraction” approach and “Rule-based Classification” approach. Both approaches make use of elevation models derived from LiDAR data together with the aerial imagery.
Edge detection involves using algorithms to locate discontinuities in intensity values within an image scene. Edge detectors function by searching for areas within an image scene, where brightness changes swiftly within a short distance (Li et al., 2013). Previous studies that have employed edge detection and extraction technique in extracting object of interest includes (Awrangjeb et al., 2010; Awrangjeb et al., 2013; DongHyuk et al., 2008; Sohn et al., 2007).
The rule-based classification involves exploring features of interest in an image scene with a view to determining various characteristics and parameters that can be used to separate or extract them from other features in the image. Once these characteristics has been identified based on the user’s knowledge of the features, rules are set using thresholds of the identified characteristics, for instance texture, to classify such features into appropriate classes. This approach was adopted in this study to detect and extract the building roofs.
2.3 Modelling Solar Radiation
Measuring solar radiation has been an area of interest for a long time, and this is due to its importance, as many human and even plant activities depend on it (Fu & Rich, 2000). It is the amount of solar energy incident upon any surface of the earth. Global solar radiation is the combination of three components namely, direct (beam) radiation, diffuse radiation and reflected radiation (Perez et al., 1987). The direct and diffused radiation amounts to the most significant global solar radiations, while the amount of radiation contributed from the reflected radiation is less, but more prominent for inclined surfaces. It is sometimes omitted in some models (Hofierka & Suri, 2002).
When modelling or estimating the solar potential of a surface, several important parameters must be considered, namely, surface relief or topography, geographic location, shadowing from nearby elevated features, atmospheric attenuation and scattering (Kodysh et al., 2013). There are three main techniques of generating spatially continuous solar radiation values for any surface, based on the data type. These include; ground weather station based model, meteorological satellite based model and GIS-based models. Some of these techniques do have area of correlation or sometimes integrated, but there are individual strength and weakness inherent in each.
The ground station and satellite weather based models are more suited for large-scale studies, because of its typical low resolution and region-wide coverage. The resolution for the solar radiation database derived from these two models ranges from 1km and beyond. The highest range of the resolution (+/- 1km) is made possible as a result of integration with digital surface models (DSM) (Suri et al., 2015). The GIS-based models are more suited for small-scale studies, usually at the municipality level. The resolution of the resultant solar radiation database is usually that of the DSM utilized. Solar radiation models integrated within the GIS provides an efficient and accurate means of estimating solar radiation over any surface. Using these models, surface characteristics such as slope, orientation and shadow are efficiently modeled and considered in providing radiation estimates (Hofierka & Suri, 2002).
scripting and modifications (Camargo et al., 2015). Consequently, the r.sun model was adopted for estimation in this study.
2.4 Evaluating Solar Photovoltaic Potential
There are at least two important criteria necessary in determining suitable area for rooftop solar photovoltaic installations. One of such criteria is the size of usable roof area, which must be large enough to hold significant number of solar panels; the second criteria involves the high efficiency of the roof portion in retrieving solar insolation (Jakubiec & Reinhart 2012). Other parameters considered in evaluating the solar photovoltaic potential include panel efficiency, shading, orientation, tilt or slope, and, often, the losses encountered during conversion from direct current to alternating current. Calculating the solar photovoltaic potential entails determining the geographic potential, the physical potential, and the technical potential. The geographic potential refers to the useful roof area that can accommodate the solar photovoltaic panels, while the physical potential is the viable solar radiation incident on the roof area, and the technical potential refers to the efficiency of the photovoltaic system (Bergamasco & Asinari 2011).
3. METHODOLOGY
The methodology adopted in estimating the solar photovoltaic potential is divided into two stages. The first stage covers the procedure followed in extracting the building rooftops. While the second stage deals with the estimation of the global solar radiation, and the equation to calculate the amount of electricity generated from each building roof.
3.1 Roof Extraction by Rule-based Classification
The complementary advantages of integrating LiDAR data with high-resolution imagery is a useful strategy for extracting neat and smooth building or roof boundaries (Li et al., 2013). It is of the utmost importance that the LiDAR and imagery data were acquired around the same time and possesses similar spatial resolution. Rule-based classification systems are particularly important when ancillary data are to be incorporated in image classification, which becomes difficult for a typical classification technique to implement (Lawrence & Wright, 2001). The most important process involved in any object-based classification analysis is the segmentation, as a suitably segmented image scene makes object classification much easier. Segmentation is the process of splitting an image scene into smaller homogenous pieces based on variations in the pixel grey values, texture or other supplementary data (Jinmei & Guoyu, 2011). The outcome of a segmentation process is determined by parameters such as thresholds and seeds, depending on the application and the data used. Therefore, a few trials might be required before the substantive parameters can be identified and adopted (Bouziani et al., 2010).
The most basic and simplest form of segmentation is called thresholding (Pujol, 2003). Other segmentation algorithms can be sufficiently classified as region-based and boundary-based (Carleer et al., 2005). Segmentation algorithms available within the eCognition developer software were used in this study; this includes multi-resolution segmentation (MRS), contrast split and multi-threshold segmentation. The contrast split segmentation algorithm splits and merges image pixels by their
contrast using a threshold that best exploits the contrast between the dark and the bright image pixels (Definiens, 2007). The MRS algorithm involves a multi-scale image segmentation based on region merging. It begins with each pixel in the image scene as one image object or region and at each level, pairs of image object is merged using a decision threshold based on local homogeneity criteria, to form larger image objects (Baatz & Schäpe, 2000). Basic parameters that affect the MRS algorithm are image layer weight, scale parameter, smoothness and compactness (Definiens, 2007).
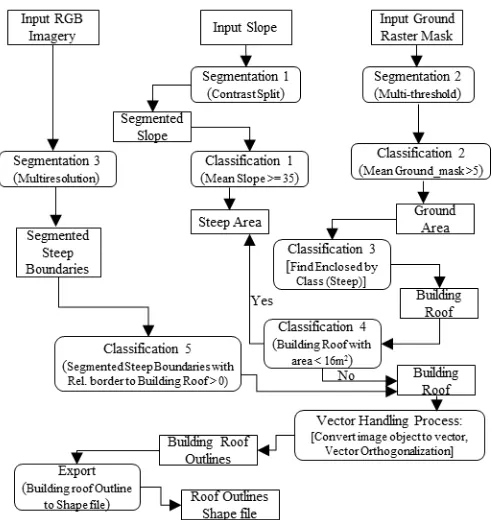
The rule-based classification process offers the possibility of automating the whole building roof extraction process, once a sample rule-set has been designed and tested across the study area. Using series of segmentation and classification techniques, a strategy was adopted to develop rule-sets, similar to the strategy used in Trimble (2010). In developing the strategy for detection and extraction, the slope raster was primarily considered. Slopes are known to be prominent around edges of elevated objects, because of the sharp difference in elevation to the ground. This makes the slope raster to produce high-contrast steep boundaries around elevated objects. This attribute of slope was considered an advantage in detecting and extracting building roofs. The next step involved using a ground raster mask generated from the LiDAR ground points to classify the ground areas. Once the steep and ground areas are classified, the building roof areas are mainly left, enclosed within the steep boundaries. The building roof can then be classified using the “enclosed” classification tool. The last step of the strategy was to remove misclassifications, and refine the building roof classification to obtain an accurate and a smooth outline. This is then exported as a shapefile. A workflow diagram of the strategy is shown in Figure 1 below.
building roof. After the contrast split segmentation, a classification process (Classification 1) was added to assign the segmented steep boundaries into a class (Steep). Since the slope raster was calculated in degrees, its’ pixel values ranges from 0 to 90. The steep zones, characterized by high contrast (bright pixels) starts at pixel value of 35, this was then adopted as the threshold for classifying the steep areas. A classifier with a threshold condition of mean slope >= 35 then classifies the steep areas into the specified class (Steep). The next process involves classifying the ground areas using the ground raster mask as input. A multi-threshold segmentation process (Segmentation 2) was used to create ground object primitive. A classification process (Classification 2) was then added using a threshold condition to classify objects with mean pixel > 5 as ground areas. With the steep and ground area successfully classified, the unclassified areas left on the image scene were mostly building roof area and tiny areas within the tree canopies.
The building roof areas, which are of interest, are all enclosed within the steep area. Therefore, a classification process (Classification 3) was added to the rule-sets to classify areas enclosed by the steep class as building roof. However, the classification result might contain smaller objects that are not the building roof, especially tiny areas within large tree canopies. Therefore, another classification process (Classification 4) was added, using the area attribute as the logic, either to separate previously classified building roof objects into steep areas or to retain them as building roof objects. To clean up the building roof areas, a further segmentation algorithm (Segmentation 3) was added to break up the wide steep boundaries around the building roofs into narrower seams using the aerial imagery and the steep areas as inputs. This would allow the classified building roof area to be expanded into its actual outline as visible on the aerial imagery. The last classification process (Classification 5) was thereafter added to classify steep objects with close proximity to the building roof. The final stages of the rule-sets involved refining the building roof objects into a smoother and accurate shape. The vector handling algorithms were used in this process by first converting the building roof object into a vector thematic layer. A vector orthogonalization and simplification algorithm was then used to smoothen the roof outline edges. Finally, an export process was added to export the building roof outlines as a GIS shape-file.
3.2 Estimating Clear-sky Solar Radiation
The r.sun model incorporated within the GRASS GIS environment was adopted in estimating the global solar radiation for this study. It uses the sum of beam (direct), diffuse and reflected radiation component in clear-sky conditions to estimate the global solar radiation (Hofierka & Suri, 2002). The beam radiation component is estimated by considering the extra-terrestrial irradiance, which is essentially the solar constant and know to be 1,367 W.m-2 (Rigollier, et al., 2000). However, a correction is applied to this constant due to the sun-to-earth distance, which varies marginally across the year (Hofierka & Suri, 2002).
Since the diffuse radiation depends largely on the Linke turbidity factor for any solar altitude, the diffuse radiation increases as the turbidity increases, while the beam irradiance decreases (Hofierka & Suri, 2002). The reflected irradiance of an inclined surface under the clear-sky condition depends on an
isotropic assumption. It is therefore, estimated as the sum of beam and diffuse irradiance proportional to the mean ground albedo and to a fraction of the ground viewed by an inclined surface (Hofierka & Suri, 2002). The r.sun model calculates the beam, diffuse and ground reflected radiation for a given day, location, surface and atmospheric condition. It functions in two modes: Mode 1 calculates the solar irradiance of an area or point for an instant of time (in seconds), and generates raster maps of the selected components, such as beam, diffuse and reflected radiation. Mode 2 computes the daily sum of solar irradiance and the duration of beam irradiation in minutes from the integration of irradiance values calculated for a specified time step, ranging from sunrise to sunset (Hofierka & Suri, 2002).
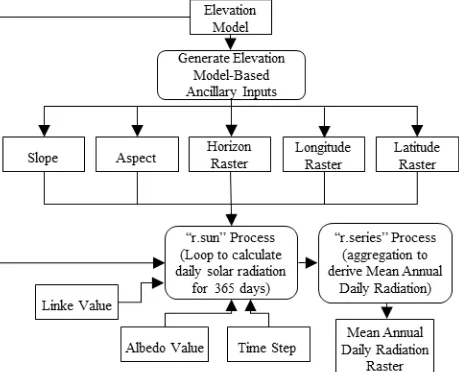
The second mode (Mode 2), which computes the daily sum of solar irradiation [Wh.m-2] was used to compute the global solar radiation in this study. As inputs, the r.sun model uses the DSM raster, DSM-based ancillary rasters (slope, aspect, latitude and longitude raster and horizon raster) and day number. Other parameters, such as albedo value, Linke turbidity coefficient and time steps, can be specified by the user. The workflow diagram for estimating the global solar radiation is shown in Figure 2 below.
Figure 2. Workflow diagram for estimating solar radiation
The r.sun model does not have the capability of calculating the global solar radiation over a period of time. However, a python script can be written to loop the daily radiation calculation over a period of time required, which is a year, for the purpose of this study. A python script was therefore written, which accepts only the DSM raster as input. The script uses the DSM to generate all the required raster input for the solar radiation calculation, these includes, slope, aspect, horizon, latitude and longitude. These then serve as the inputs for the loop solar radiation calculation. On completion of the loop for 365 days of the year, a code to aggregate and derive the mean annual radiation was also added to the script.
3.3 Estimating Solar Photovoltaic Potential
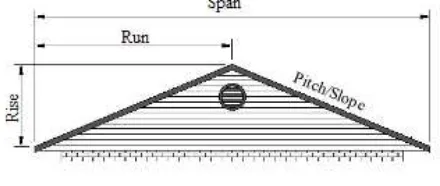
the total roof area (Hofierka & Kanuk, 2009; Jo & Otanicar, 2011). However, it can be argued that the roof outline extracted from the integration of LiDAR and aerial imagery actually represents the roof span area, as seen from the top, and not specifically the real roof area. However, this argument only holds for pitched roofs. The real area of a flat roof is essentially the same as its roof span area, as there is no rise or run. This is better illustrated in Figure 3.
Figure 3. Building roof geometry
Suffice to say, if a pitched roof is flattened to a zero inch pitch or a zero degree slope, its span area will be greater, than when it was still pitched, say at an angle of 350. Therefore, it can be said that the roof span area obtained from the automatic extraction of building roofs underestimates the actual roof area. This underestimation, in essence, would have catered for the area lost to any roof-mounted object or space required between solar panels during installation. Therefore, this study will adopt the roof span area as obtained from the automatic roof extraction process as the useful area in order to estimate the general photovoltaic potential. To calculate the useful roof area (RUA) for the optimum solar photovoltaic potential, all the north facing (north-east to north-west) pixels from aspect calculation will be extracted and converted to an area (polygon). The second step involved in estimating the rooftop solar photovoltaic potential is to determine the mean solar radiation (SMR) incident on each building roof. The processes involved are listed as follows:
• The extracted building roof outline is used to clip the mean solar radiation raster. The output gives the solar radiation estimates within each building roof outline.
• Obtain the mean value of all raster pixel’s value falling within each roof outline.
The final step involved is to determine the amount of energy exploitation involved in converting the solar energy to electricity. Factors considered here include solar panel efficiency and the performance ratio (conversion coefficients), which takes into account sub-factors, such as losses due to temperature and shading, losses due to dust and snow, inverter losses, AC/DC cable losses and other losses. Solar panel efficiency (PE) of 15% was adopted for estimation in this study, this represents the average efficiency of the crystalline silicon-based solar panels, which are more commonly used (Jo & Otanicar, 2011). The performance ratio or conversion coefficient for a typical roof-mounted mono/polycrystalline panel ranges from 0.75 to 0.77 (Hofierka and Kanuk, 2009; Suri and Hofierka, 2004). Therefore, a performance ratio (PR) of 0.76, which is the mean of the range stated above, was adopted for estimation in this study. Combining the three factors stated earlier produces the solar photovoltaic potential of a building roof. The formula adopted in this study to estimate the photovoltaic potential denoted as EOUT is given as:
EOUT = (RUA * SMR * PE * PR) / 1000 (1)
Where EOUT = Electricity Output (kWh)
RUA = Useful Roof Area (m2)
SMR = Mean Annual Solar Radiation (Wh/m2)
PE = Panel Efficiency (%)
PR = Performance Ratio
4. ANALYSIS AND RESULTS
4.1 Study Area
The city of Cape Town in the Western Cape Province of South Africa was chosen for this study. The city was considered ideal, because the primary data required for this study, namely, LiDAR data and aerial imagery, are readily available. The city of Cape Town is a coastal city covering an area of 2,461km2. It lies on the 34th latitude and has an annual average temperature of about 17oC. The average amount of sunshine hour per annum is about 3,100 hours.
4.2 Data Preparation
The LiDAR data and aerial imagery used in this study were sourced from the City of Cape Town municipality. The LiDAR and aerial data were acquired in batches over a space 2 years (2012 - 2014). The LiDAR data has an average point spacing of 60cm, while the aerial imagery has a spatial resolution of 8cm. The registration of the two data had already been done by the vendor. However, a check was carried out by overlaying the LiDAR data and aerial imagery in ERDAS IMAGINE, while feature edges were visually zoomed into to ascertain they aligned with each other. The verification becomes necessary, as the LiDAR data and aerial imagery would be eventually integrated to extract each building rooftop. To allow for faster and easier management of files, due to the large size of the LiDAR data and the aerial imagery. The LiDAR and aerial imagery for the study area were divided into manageable tiles. A tile size of 1 km2 (1,000m by 1,000m) was adopted. Each of the tiles containing buildings was then utilized in the analyses.
The LiDAR data used to create the surface models utilized in this study has been pre-processed and classified into ground and non-ground points by the vendor. The ground points only were then filtered into a new LiDAR file and this was used to generate the ground raster mask. Filtering the ground points into a new file leaves the areas occupied by elevated objects void without points. The ground points were then interpolated by binning without filling the void areas. The resultant ground raster mask consequently has the areas occupied by elevated objects such as buildings and trees as no-data pixels. A pixel size of 1.5m was adopted for the ground raster mask, since the LiDAR data has an average of 60cm point spacing. This will reduce the occurrence of no-data pixels within the ground areas. To generate the DSM required for solar radiation estimation, the pre-processed LiDAR points were interpolated directly through binning. Binning technique of interpolation was considered adequate for LiDAR data, because of its high point density. Other analyses carried out are as follows.
4.3 Building Roof Extraction
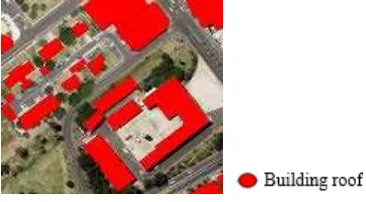
imported into the created project. Aliases were assigned to each band of the inputs for correct identification. The processes outlined in the workflow for building roof extraction as designed in the methodology was followed in the analysis to automatically extract the building roofs. The steep boundaries surrounding the building roofs were first classified; this was followed by the ground areas, leaving basically the elevated objects such as buildings and trees as shown in Figure 4 (a) below. The areas occupied by each building roof are enclosed within the green steep boundaries as shown in Figure 4 (a). This attribute makes the detection and classification of the building roof straightforward. However, this strategy misclassifies some tiny enclosed areas sitting on top of trees as shown in Figure 4 (b) below.
Figure 4. Classification Results
The final stage of the analysis to extract the building roofs involved refining the building roof classification to obtain a smooth outline around each building roof. Processes followed include removing misclassifications, mostly tiny areas of the tree classified as building roof. This was carried out by setting a threshold for the area of the objects. Objects previously classified as building roof with an area less than 16m2 were therefore reclassified as steep objects. The next step dealt with extending the classified building roof to match its actual outline. Therefore, for the first time in the extraction process, the aerial imagery data was put to use. Two major processes were implemented: the first reduced the wide steep object edges to narrow edges, and the second was used to grow the building roof objects into the thin steep edges spectrally similar to it. The final step in obtaining the building roof outline involved converting the building roof objects into vector object, and smoothening out the edges, using the vector handling tools. On completion, the vector objects were exported as a shapefile. Figure 5 below shows a sample of the final building roof classification result.
Figure 5. Final building roof extraction
With the rule-sets developed and tested with sample tiles across the study area, subsequent roof extraction analysis becomes faster. A project is created for the next grid tile, required data
are imported and named correctly, and the saved rule-sets are loaded. The entire parent process is then selected to run, while the extracted building roof outline is saved in the specified folder. The essence of the building roof extraction analysis was to obtain the area of each building roof, as this forms a vital input, required when calculating the photovoltaic potential of a building roof. Also, the roof outline would subsequently be used in defining the extent and boundary of the building roof in solar radiation analysis.
4.4 Estimation of the Global Solar Radiation
The solar radiation analysis was carried out using the open source GRASS GIS 7 software. The primary data source utilized in estimating the global solar radiation was the DSM; other ancillary input data were also generated from this. The elevation model thus constituted the main input data for estimating solar radiation. The GRASS GIS required the creation of a working directory, a location, and a mapset folder before it could be initialized; all the outputs generated thereafter are then saved in the created mapset. Mapset was created for each grid tile, and its name included the grid number for easy identification. The Python script was designed to loop through the whole year and to output the mean annual radiation; this was implemented by launching it in the GRASS GIS environment. Before the script was launched, the DSM raster was imported into the GRASS environment. The computation region for each analysis was set to the imported elevation model. Thereafter, necessary edits were carried out on the Python script, such as specifying the appropriate working directory, the mapset and the imported elevation model. Figure 6 below shows the mean annual global solar radiation raster for a sample area.
Figure 6. Mean annual global solar radiation
The method employed for estimating the global solar radiation adequately models the orientation of the roof via the aspect map, and the tilt of the surface by using the slope map. Also, the shading factor was modelled by using the horizon computation. The shortcomings of having to feed in each input, as required by the r.sun tool, were eliminated by opting for the scripting option. The aspect and slope maps are two important inputs to the estimation of the global solar radiation, as they provide the required detailed surface characteristics of the building roof, which could not be derived directly from the DSM. The estimate obtained using the r.sun tool was based on a clear-sky solar radiation model. The real sky estimates could, however, be derived by applying the sky insolation index. The clear-sky index value ranges from 0 to 1.0, and can be obtained from the NASA website. It is defined as the ratio of radiation above the atmosphere to that which reaches the ground surface during clear-sky days. The correction is applied by multiplying the clear sky solar radiation estimate with the clear-sky insolation index (Hofierka & Suri, 2002).
(a) (b) Building roof
Steep Ground
High: 7229.72 Wh/m2
4.5 Analysis of Solar photovoltaic Potential Estimation Obtaining an estimate for the solar photovoltaic potential of building roofs entails combining results from the two previous analyses, together with the amount of energy exploited while converting solar energy to electricity. The energy exploitation factors are expressed as constants, while the useful roof area and the mean solar radiation values are the variables. Essentially, the attribute table of the extracted building roof outline was utilized as the workspace to carry out the calculation, thereby functioning as a spreadsheet. To estimate the general potential for each building roof, the first step entails adding the energy exploitation parameter fields and values to the building roof table. Next, involves clipping the solar radiation raster with the building roof outline, and obtaining a mean solar radiation value per building. Thereafter, the mean value information is merged with other attributes contained in the building roof table already. Then, the general solar photovoltaic potential was calculated using the formula adopted. A sample result of the general estimate is shown in Table 1 below.
Table 1. General solar photovoltaic potential
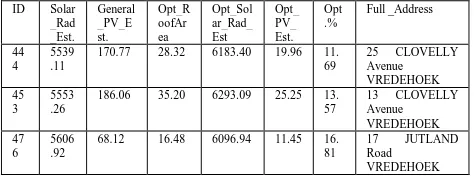
Further analysis were carried out to extract and obtain the optimum sections of the building roof and to determine its optimal percentage. These, and other analyses could be carried out and the information generated added to the database, to make it comprehensive. Finally, to create a user friendly solar photovoltaic database, each building roof was geocoded to obtain its location address. This was carried out using the address database of the city. Coupling the building’s address with its solar photovoltaic potential will present the user with the option to search, view and extract the relevant solar photovoltaic information about a building of interest. A trial search was carried out, to search for buildings with low photovoltaic potential, at a threshold 40%. The search result returned building roofs with optimal percentage less than 40% as shown in Table 2 below.
Table 2. Buildings with low photovoltaic potential
4.6 Validation
The results obtained from the analyses carried out in this study was assessed for accuracy. This was carried out for the building roof extraction process, using the error matrix. While the solar photovoltaics potential estimate was assessed using power
output data from an existing large capacity roof-mounted solar photovoltaic system within the study area.
The accuracy assessment of the building roof classification and extraction was carried out within the eCognition software environment using the “Error matrix based on TTA Mask” option. The error matrix based on training and test area (TTA) mask uses the TTA mask as a reference to check the classification accuracy by comparing the classification with the ground truth based on pixels (Definiens, 2007). Selecting a random grid tile from the processed data, samples for the reference class was generated by digitizing the building roof outlines, steep and ground areas in ArcGIS. These samples were imported into eCognition as a thematic layer and were used to create image objects using the chessboard segmentation tool. Each class was assigned the appropriate and adequate samples, while a TTA mask was generated from the selected samples. The generated mask was then compared with the classification output using the accuracy assessment tool. The error matrix result shows that the building roof classification has a producer accuracy of 99.8%, user accuracy of 99.7%, and kappa index of agreement (KIA) of 97.2%. While the overall accuracy reads 99.2%. The error matrix result shows that the feature extraction processes carried out was very successful and of good accuracy.
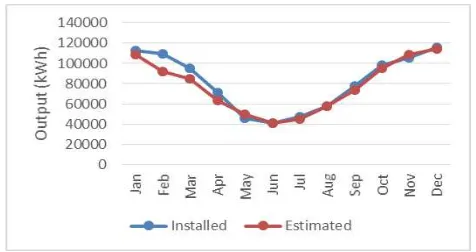
The solar photovoltaic estimate obtained from the analysis was compared with an existing roof-mounted solar photovoltaic system. The installation is currently known to be the largest solar photovoltaic system in Southern Africa, with an installed capacity of 1.2 megawatt. It is also rated among the 30 largest roof integrated solar photovoltaic system in the world, and follows closely, that of Google headquarters, USA (1.6 MW), the Rome Trade Fair, Italy (1.4 MW) and Toyota Parts Centre, Belgium at 1.8 MW capacity. The installation was broken down into two phases, a 700Kw capacity was completed in July 2013 and another 500Kw was completed in August 2014. For an ideal comparison, the existing system should have generated output for at least a year (12 months). This is necessary, since the estimate from this study is based on the mean annual solar radiation to yield a mean daily potential output. A 12 month (August 2013 – July 2014) generation output data for the first phase was provided by the owner (Black River Park) of the facility for verification purpose. These monthly output values from the installed system were compared with estimated monthly value from the study, which yielded a good comparison result as shown in Table 3 and Figure 7 below.
Month Installed
Output (kWH)
Estimated Output (kWh)
Difference
January 112961.742 112223.154 -738.588
February 109775.184 92089.687 -17685.497
March 95305.976 85174.427 -10131.549
April 71361.913 63320.845 -8041.068
May 45323.614 49311.860 3988.246
June 41180.847 40516.378 -664.469
July 47016.077 45033.169 -1982.908
August 57712.564 57965.647 253.083
September 77463.109 73923.606 -3539.503
October 98750.166 94900.372 -3849.794
November 105894.509 108602.656 2708.147
December 116182.517 114631.574 -1550.944
Annual output 978928.218 937693.375 -41234.843
Monthly mean 81577.351 78141.115 -3436.237
Daily mean 2681.995 2569.023 -112.972
Table 3. Comparison between the installed and estimated output
Figure 7. Monthly variation between the installed system and the estimated potential
This validation result shows that the estimates gotten, using the methods adopted in the study, is quite good and can be relied upon for planning and decision making purposes.
5. CONCLUSION
A method to automatically extract building rooftops and evaluate their solar photovoltaic potential has been described, and this has been applied to city of Cape Town, South Africa. The study made obvious how the integration of LiDAR data and aerial imagery could be harnessed, using remote sensing and GIS techniques to evaluate the solar photovoltaic potential at municipal scale. The automatic roof extraction method forms an integral aspect of the entire process, considering the vast number of buildings to be evaluated. Manually digitizing each building roof would have taken a great deal of time and human recourses to accomplish.
Information generated from the solar photovoltaic database could be used as a decision making tool by public authorities, such as municipalities, as well as by private sector, in assessing and determining sets of buildings roofs viable for solar photovoltaic installations. This offers an effective solution, given the planning intricacies involved in the widespread installation of solar photovoltaic systems. Ignoring or avoiding this necessary stage, of evaluation and assessment, could result in a significant loss of time and resources.
From the results generated from this study, it was also observed that the size of a building roof plays a prominent role in the amount of electricity a building roof can harvest, as roof sections facing south could still harvest a tangible amount of solar radiation. Other factors such as the roof pitch could be maneuvered to some extent by varying the tilt of solar panels during installation, except in cases of near vertical building roofs.
REFERENCES
Awrangjeb, M., Ravanbakhsh, M. & Fraser, C.S. 2010. Automatic detection of residential buildings using LIDAR data and multispectral imagery. ISPRS Journal of Photogrammetry
and Remote Sensing. 65(5), pp. 457-467.
Baatz, M. & Schäpe, A. 2000. Multiresolution segmentation: an optimization approach for high quality multi-scale image
segmentation. Angewandte Geographische
Informationsverarbeitung XII, pp. 12-23.
Bergamasco, L. & Asinari, P. 2011. Scalable methodology for the photovoltaic solar energy potential assessment based on available roof surface area: Application to Piedmont Region (Italy). Solar Energy. 85(5), pp. 1041-1055.
Bouziani, M., Goita, K. & He, D. 2010. Rule-based classification of a very high resolution image in an urban environment using multispectral segmentation guided by cartographic data. Geoscience and Remote Sensing, IEEE
Transactions on. 48(8), pp. 3198-3211.
Camargo, L.R., Zink, R., Dorner, W. & Stoeglehner, G. 2015. Spatio-temporal modeling of roof-top photovoltaic panels for improved technical potential assessment and electricity peak load offsetting at the municipal scale. Computers, Environment
and Urban Systems. 52, pp. 58-69.
Carleer, A., Debeir, O. & Wolff, E. 2005. Assessment of very high spatial resolution satellite image segmentations.
Photogrammetric Engineering & Remote Sensing. 71(11), pp.
1285-1294.
Cheng, L., Gong, J., Chen, X. & Han, P. 2008. Building boundary extraction from high resolution imagery and lidar data. International Archives of the Photogrammetry, Remote
Sensing and Spatial Information Sciences. 37, pp. 693-698.
De Vries, B.J., Van Vuuren, D.P. & Hoogwijk, M.M. 2007. Renewable energy sources: Their global potential for the first-half of the 21st century at a global level: An integrated approach. Energy Policy. 35(4), pp. 2590-2610.
Definiens, A. 2007. Definiens developer 7 reference book. Definiens AG, München. Pp. 21-24.
Fu, P. & Rich, P. 2000. The solar analyst 1.0 user manual.
Helios Environmental Modeling Institute. 1616.
Hofierka, J. & Kanuk, J. 2009. Assessment of photovoltaic potential in urban areas using open-source solar radiation tools.
Renewable Energy. 34(10), pp. 2206-2214.
Hofierka, J. & Suri, M. 2002. The solar radiation model for Open source GIS: implementation and applications.
Proceedings of the Open Source GIS-GRASS Users Conference.
IEA 2012. World energy outlook 2012. Available: http://www.worldenergyoutlook.org/publications/weo-2012/ (2014, April 8).
Jakubiec, J.A. & Reinhart, C.F. 2012. Towards validated urban photovoltaic potential and solar radiation maps based on lidar measurements, GIS data, and hourly daysim simulations.
Proceedings of SimBuild, Madison, Wisconsin pp. 1-10.
Lawrence, R.L. & Wright, A. 2001. Rule-based classification systems using classification and regression tree (CART) analysis. Photogrammetric Engineering and Remote Sensing. 67(10), pp. 1137-1142.
Lee, D.H., Lee, K.M. & Lee, S.U. 2008. Fusion of lidar and imagery for reliable building extraction. Photogrammetric