SEGMENTATION AND CLASSIFICATION OF NEPAL EARTHQUAKE INDUCED
LANDSLIDES USING SENTINEL-1 PRODUCT
Saket Kunwara
a
Centre for Policy Analysis and Development-Nepal - [email protected]
KEY WORDS:Sentinel-1, Landslide, Earthquake, SAR Polarimetry, Texture, Segmentation, Classification, Nepal
ABSTRACT:
On April 26, 2015, an earthquake of magnitude 7.8 on the Richter scale occurred, with epicentre at Barpak(28◦12′20′′N,84◦44′19′′E), Nepal. Landslides induced due to the earthquake and its aftershock added to the natural disaster claiming more than 9000 lives. Landslides represented as lines that extend from the head scarp to the toe of the deposit were mapped by the staff of the British Geological Survey and is available freely under Open Data Commons Open Database License(ODC-ODbL) license at the Humanitarian Data Exchange Program. This collection of 5578 landslides is used as preliminary ground truth in this study with the aim of producing polygonal delineation of the landslides from the polylines via object oriented segmentation. Texture measures from Sentinel-1a Ground Range Detected (GRD) Amplitude data and eigenvalue-decomposed Single Look Complex (SLC) polarimetry product are stacked for this purpose. This has also enabled the investigation of landslide properties in the H-Alpha plane, while developing a classification mechanism for identifying the occurrence of landslides.
1. INTRODUCTION
The Nepal Earthquake of April 26, 2015, is compared in terms of damage to the great earthquake of 1934, (Rana, 1935), and is regarded as part of a cycle of major earthquakes that occur due to the tectonic fault running through Nepal. As of 23 Septem-ber 2015, 395 aftershocks of magnitude above4Mw have been reported. Landslides are predicted to plague Nepal in the near fu-ture due to the increase in susceptibility and probability of further earthquake induced events.
The Sentinel-1a satellite developed by the European Space Agency and part of the Sentinel mission provides publicly available SAR (Synthetic Aperture Radar) C-band data products, useful for study-ing natural hazards. The full capabilities of the sentinel mis-sion are illustrated in, (Torres et al., 2012). With the launch of Sentinel-2 and Sentinel-3 satellite system, the complete sen-tinel mission will eventually enable unprecedented monitoring of the earth’s environment, (Kramer, 2012). In this investigation, Ground Range Detected (GRD) data products from the Sentinel-1a satellite is used for generating Gray-Level Co-Occurrence Ma-trix (GLCM) and Gabor features for region growing segmenta-tion. Numerous use of texture measures for segmentation can be found in the literature, however, it has not been explored with data from Sentinel-1a for delineating landslides. The current 12-day repeat cycle of Sentinel-1a and subsequent reduction to 6 days after Sentinel-1b is operational, coupled with SAR not be-ing affected by cloud cover, common durbe-ing the monsoon sea-son in Nepal when landslide occurrences increase, makes the use of Sentinel-1 data highly valuable. Phase information is lost in GRD conversion, but the phase information on Single Look Com-plex (SLC) images can be used by generating Entropy, Alpha and Anisotropic, (Cloude et al., 2002), data. This is accom-plished by decomposing speckle filtered and debursted images using eigenvalue decomposition, (Lee and Pottier, 2009). Though quad polarized polarimetry product has been explored in the past, (Yonezawa et al., 2012), (Yamaguchi, 2012), the dual polarized data from Sentinel-1a has yet to be investigated for delineation of landslides. These studies are conducted in this investigation along with Eigenvalue decomposition from the VV, VH dual po-larimetry product for characterizing landslides properties in the
H-Alpha plane. The specific data products used in this study is given in Table 1.
The landslide events available from the Humanitarian Data Ex-change Program, (Humanitarian Data ExEx-change, 2015), in poly-lines form was used as the ground truth for guiding the creation of the polygonal vector map via segmentation. All polygonal seg-ments intersecting the polylines were denoted as landslide and the disjoint sampled as non-landslides. With the binary target variable thus generated, along with feature vector that included statistical properties such as average, coefficient-variation, first-quartile, maximum, median, minimum, percentile-90, range, stan-dard deviation, sum, third-quartile, variance, from the GLCM, Gabor and Alpha, Anisotropy and Entropy products, a classifier system is applied. Area Under The Receiver Operating Charac-teristic Curve is used as the metric for evaluating occurrences of landslide from non-landslide segments. Performance of Random Forest Classifier and Gradient Boosting Classifier are compared, with appropriate adjustment to the imbalanced dataset. The Sen-tinel Toolbox, (Veci et al., 2014), was used for generating tex-ture and polarimetry featex-tures while Grass, (GRASS Development Team, 2015), is used for region growing segmentation.
The satellite footprint, covers an area of27 180.83km2
, as shown in Figure 1, consisting of the town of Baglung to the west of the epicentre, and Langtang National Park to the east, where in the village of Ghoda Tabala more than 300 lives perished due to a par-ticularly large landslide. In total 3760 landslides were recorded inside this particular footprint, however a smaller region inside this footprint as shown in Figure 1, is used as Area of study. This also coincided with the availability of Digital Elevation Model for the area.
Mission Type Acquisition Pass Track Swath
Sentinel-1A GRD 29-APR-2015 Descending 19 IW Sentinel-1A SLC 29-APR-2015 Descending 19 IW
Figure 1: Satellite footprint Area of study
2. METHODOLOGY
This section briefly gives the underlying principal, along with the associated methodology and discussion for some crucial parame-ter selection in the texture generation and polarimetry product, re-quired by the segmentation step. Similarly segmentation method and model tuning based on Bayesian optimization for the classi-fication mechanisms are then shown, as well as the appropriate method of handling imbalanced dataset.
2.1 Texture Generation
Texture can be quantified using a spatial relation and values of neighbouring pixels in a symmetrical matrix. The Gray-Level Co-Occurrence Matrix (GLCM) thus containing the frequencies of the pairing of pixels with certain values and spatial relation can be further used to generate second-order statistical properties, (Albregtsen et al., 2008).
Gabor filters based on the Human Visual System, is a sinusoidal modulated Gaussian, (Hammouda and Jernigan, 2000), resulting in sensitivity to local orientation and frequencies suitable for tex-ture analysis. This has also been explored for sea-ice textex-ture classification, such as in (Clausiyz and Jernigany, 1995). In this study 0,45,90 and 135 degree oriented Gabor filters are evaluated.
There have been relatively few attempts in using SAR data for texture analysis as compared to spectral or topological data. A comprehensive analysis of using SAR data for generating GLCM was done in (Soh and Tsatsoulis, 1999), for Sea-Ice classifica-tion. In GLCM measures, the quantization Level, window size, and orientation parameters are crucial in governing the quality of segmentation for the given object. Quantization Levels ex-presses the number of gray levels. Higher quantization allows more expressiveness at the cost of computational power. Simi-larly, the window size is specific to the objects that need to be segmented and the resolution of the image. In (Blaschke et al., 2014), (Stumpf and Kerle, 2011) orientation was shown to af-fect the separability of landslides as they tend to have a flow di-rection. Tuning these parameters using the whole pipeline from texture generation to classification is infeasible as each process is computationally intensive. Thus, Jefries-Matusita (JM) dis-tance measure using twenty landslide events delineated manually along with random non-landslides events was utilized to select the best model parameter. The JM distance measure, equation 2, extended from the Bhatacharya distance, equation 1, is com-monly used to determine the separability of a pair of probability distributions.
Amplitude VV
Quantizer Probabilistic Quantizer
Quantization Levels 32
Window size 11x11
Angle All
Displacement 1
GLCM Measure
Contrast,Dissimilarity,Homogeneity, Mean,Variance,Correlation Energy,Entropy,
Angular Second Momentum
Gabor theta={0,45,90,135} Polarimetry
Decomposition Entropy,Anisotropy,Alpha
DEM Measures Accumulation,Aspect,
Curvature,Slope
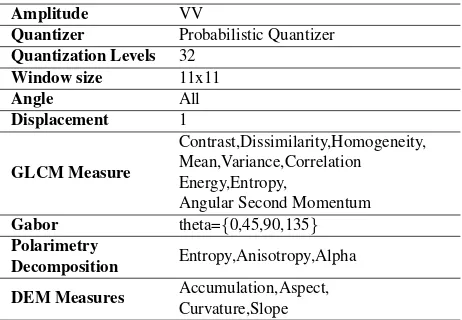
Table 2: Pre-processing features and selected parameters
B= 1 8(x−y)
t
Σx+ Σy 2
−1
(x−y)+1 2ln
|Σx+Σy
2 | |Σx|12|Σy| 1 2
!
(1)
where x= the first signature vector y= the second signature vector Σx= covariance matrix of sample x Σy= covariance matrix of sample y
Jxy= 2
1−e−B (2)
where B= Bhatacharya Distance
The JM distance is asymptotic to 2 when signatures are com-pletely different, and tends to 0 when signatures are identical. Thus, unlike the Bhatacharya distance there is an upper bound and is used in this study to determine the quantization level, win-dow size and orientation parameter for GLCM, so that the seg-mented landslides are separable from the immediate surround-ings. JM measures were also used to select the optimal GLCM second order statistic. Some measures were dropped as its over-all contribution to separability was smover-all and since the addition of layers in segmentation can lead to longer compute time. The best parameters and features for the pipeline, according to JM distance is given in Table 2.
2.2 Polarimetry Decomposition
Here, a brief description of Terrain Observation with Progressive Scans SAR (TOPSAR), de-bursting of Sentinel-1 product, dual polarization, speckle filtering, eigenvalue decomposition leading to H-Alpha classification, as well as analysis of the Nepal earth-quake induced landslides in terms of Entropy, Anisotropy and Al-pha, along with reviews of surface characteristics of landslides in comparison with other nearby scatterers in the H-Alpha plane, is given. While full or quad polarized product provides better char-acterization of surface scatterers, it is unavailable in the Sentinel-1 mission. Only specific dual polarization as shown below are available:
2. VV-VH or VV polarization for all other observation zones (with an exception for the Baltic Sea observed partially in HH-HV during the northern winter, on descending orbits).
Thus, in the context of Nepal, VV-VH or VV polarization is avail-able and in this study dual polarized SLC product in VV and VH modes are utilized, Table 1. The pre-processing pipeline to ex-tract Entropy, Anisotropy and Alpha, along with associated pa-rameters is shown in Figure 2.
Figure 2: H-Alpha Decomposition Pipeline
The dual polarized SLC product used is collected in the Interfer-ometric Swath Mode; the most common mode. Sentinel-1 pro-gressively scans the terrain, in TOPSAR scan mode, (De Zan and Guarnieri, 2006) , where a burst is cyclically switched be-tween multiple adjacent sub-swaths, resulting in a superior signal to noise ratio as compared to ScanSAR mode. Thus to merge the sub-swaths for further processing, de-bursting is performed.
The Image quality is affected by granular noise pattern called speckle noise, as many elementary scatterers in the scene inter-fere with each other’s reflected wave causing pixel-to-pixel vari-ation in intensities, (Lee and Pottier, 2009). This can seriously affect the values of the final decomposition. Lee Sigma filter as-sumes Gaussian distribution and thus computes the average of the pixels falling within the range of a fixed sigma in a window, and replaces the central pixel of the window with the computed value. The window size is a determining factor in the effectiveness of the Lee Sigma filter, given the scene, and subsequently the final decomposition values can be affected by the modification of the filter.
The speckle noise can be suppressed, but it still affects the scat-tering matrix(h[S]i), given by equation 3, to the point that it can not be used to characterize distributed scatterers, whose signature are superimposed inside a resolution cell. Thus decomposing this signature to identify single scattering process formed from it’s el-ementary scatterers is required. A 3x3 hermitian average covari-ance or the coherency matrix(h[T3]i), equation 4, derived from the scattering matrix is used to analyse the distributed scatterers.
h[S]i=
SHH SHV SV H SV V
(3)
h[T3]i= [U3][Σ3][U3]− 1
(4)
Eigenvector decomposition decomposes this Hermitian matrix, to the diagonal matrix ([Σ3]) which contains the eigenvalue(λi) and the unitary matrix ([U3]) contains the eigenvectors(ui). As out-lined in (Cloude et al., 2002), these eigenvalue and eigenvector becomes the basis of Entropy(H), Anisotropy(A) and Alpha(α)¯ given by:
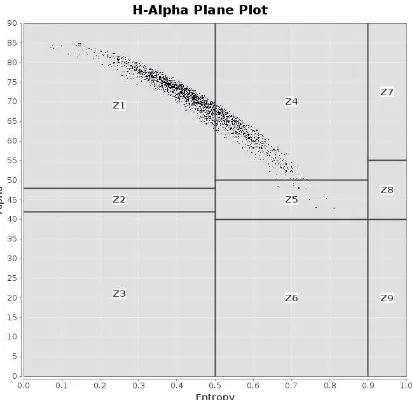
Figure 3: A Landslide(Goda Tabala) in H-Alpha Plane
H =− 3
X
i=1
pilog3(pi) (5)
¯ α=
3
X
i=1
piαi (6)
A=λ2−λ3 λ2+λ3
(7)
where pi=P3λi k=1λk
The Entropy, Anisotropy, and Alpha thus derived is used in the segmentation process given that it’s inclusion improved the JM distance measure. After segmentation, the polygon vector of land-slides and non-landland-slides facilitated the analysis in the H-Alpha plane, where different zones are attributed to different scattering mechanisms, (Cloude et al., 2002).
It has been shown that unsupervised classification based on the H-Alpha plane explicitly distinguishes landslide areas from oth-ers such as forest, water, and snow-covered areas, but does not perform well for farmland, (Yonezawa et al., 2012), using quad polarized ALOS PALSAR data. While, dual polarization, (Shan et al., 2011), has also been shown to be capable of substituting for quad polarization in certain cases. However in this study H-Alpha classification from the dual polarization product alone was found insufficient in studying landslide occurrence thus the added need of texture and DEM measures to delineate landslide before analy-sis in the H-Alpha plane was conducted to characterize landslide.
2.3 Segmentation and classification
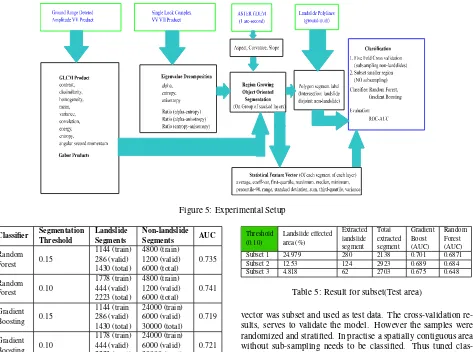
The experiment was set-up, as shown in Figure 5, by stack-ing into a group the pre-processed layers derived from ampli-tude data, which consisted of contrast, dissimilarity, homogene-ity, mean, variance, correlation, energy, entropy, angular sec-ond momentum and gabor filtered product with theta equal to 0,45,90,135 degrees. In addition, pre-processed data from SLC product in the form of Entropy, Alpha, Anisotropy and their ratios were also stacked to the same group. A region growing object ori-ented segmentation was then applied on the stacked group, with various thresholds. From the final segmented result, segments or polygons which intersected with the ground truth polylines, (Humanitarian Data Exchange, 2015), were labeled as landslides and sub-sample of the disjoint as non-landslides. From each la-beled landslide and non-landslide polygons, statistical measures: average, coefficient-variation, first-quartile, maximum, median, minimum, percentile-90, range, standard deviation, sum, third-quartile, and variance were extracted from each layer of the group as feature vector for the final classification pipeline. A Five fold cross-validation, with appropriate strategies to counter the result-ing imbalanced data was performed, Table 3. This also shows the test-valid data splits for each fold. As the cross-validation con-sisted of random sub-sample of non-landslides, a further method of validating the result by sub-setting a smaller area as test-set, but without any sub-sampling, was also conducted, Table 4, 5.
Figure 4: Polyline to polygon landslide segment via segmentation
Object oriented segmentation based on region growing, groups similar pixel, given multi-layered data. The number and size of the segments are determined by a threshold value that affects the merger between segments based on a similarity measure. The threshold value is an important parameter for extracting desired objects. Landslides, for the given grouping of data layers used, were found to be best segmented with a threshold value of 0.1 and 0.15. These values were selected based on the assumption that for good segmentation result, the ground truth polylines should ap-proximately extend from one edge of a segment to another, as shown in Figure 4. Larger segments for the selected threshold were further rejected using area of the segment. It is assumed that the landslides occupy an area less than0.25km2. The polylines falling in these larger segments were either unable to be detected by segmentation or their appearance occurred later than the date of acquisition of the satellite imagery. It was also observed that some segments consisted of more than one polylines, which can be attributed to the similarity of the nearby segments and the con-sequent merger, even though the survey identified them as being separate landslides. In Figure 6, a region in Langtang National Park, where the segmented polygons intersecting with the poly-lines designated as landslides from the survey, is shown as an overlay in Google Earth.
In the classification step, interaction between the respective sta-tistical measures of Alpha, Entropy, and Anisotropy were added to the feature vector. This was driven by the fact that H-Alpha classification, is conducted in the H-Alpha plane where Alpha
Figure 6: Landslide overlay
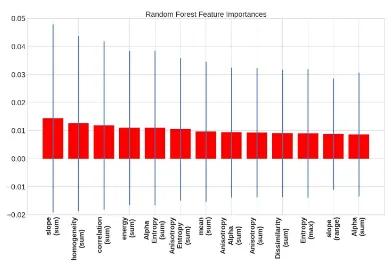
Figure 7: Random forest feature importance
and Entropy are the two orthogonal axis. Use of DEM measures have been found to be a highly discriminating factor in landslide susceptibility (Poudyal et al., 2010). Therefore, 1 arc-second ASTER GDEM was obtained for the area under study and used during the segmentation and classification process.
Hyperopt, (Bergstra et al., 2011), a framework, which facilitates hyper-parameter selection from a search space over possible con-figurations, allowed for the selection of the classifier with tuned parameters. An objective function, such as cross-fold validation that minimizes a cost function for Bayesian optimization needs specifying in hyperopt. The 5 fold cross-validation result with tuned classifier for the area of study is given in Table 3, which consisted of 5.86% landslide affected area, resulting in 1430 seg-ments that could be associated to landslides
The five fold cross-validation evaluated under Area Under The Curve established the separability of the landslides from the non-landslides using the extracted feature vectors. From Figure 7, vi-sualizing the top feature importance from a Random Forest clas-sifier, it can be seen that slope and GLCM texture measures ob-tained from GRD product are discriminating features. The inter-action between Alpha, Entropy and Anisotropy also turned out to be discriminating. In fact, interaction between Entropy and Alpha ranked fifth in feature importance. This result highlights a novel use of polarimetry product in this study of classifying landslide from non-landslide area.
Figure 5: Experimental Setup
Table 3: 5-Fold Cross-validation Result
66500 non-landslides segments. Methods to handle imbalanced data, are illustrated in (Kotsiantis et al., 2006). Bootstrap that reselects training instances and down-sampling the majority class are some appropriate methods of overcoming class imbalance. In, (Stumpf and Kerle, 2011), the authors incrementally increase the the non-landslides segments to determine the ratio between land-slides and non-landland-slides that best discriminates the two classes using Random Forest. In this study it was found that the total composition of landslides and non landslides in the the ratio of 1:4 gave optimal AUC score, though as reported in the literature and further validated here this tends to overestimate the positive class and may have resulted in loss of useful information due to the down-sampling. For Gradient Boosted Classifier, landslides and non-landslides were down-sampled only to the ratio of 1:20, which constituted approximatively half of the total segments. For the Gradient Boosting method, weights of the positive samples were set higher to that of the negative samples to account for the imbalanced data. Furthermore, Hyperopt found 4 to be optimal for themax delta stepparameter, which makes the update step more conservative.
Subset 1 29.36 194 1335 0.7324 0.719
Subset 2 12.58 97 2099 0.7096 0.68
Subset 3 5.63 43 1625 0.673 0.65
Table 4: Result for subset(Test area)
From the Area of study three smaller areas using a rectangular
Threshold
Subset 1 24.979 280 2138 0.701 0.6871
Subset 2 12.53 124 2923 0.689 0.684
Subset 3 4.818 62 2703 0.675 0.648
Table 5: Result for subset(Test area)
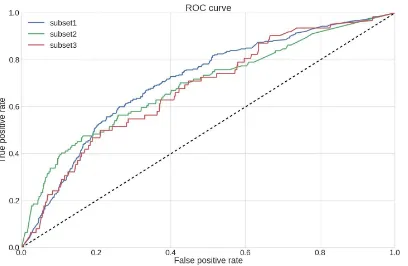
vector was subset and used as test data. The cross-validation re-sults, serves to validate the model. However the samples were randomized and stratified. In practise a spatially contiguous area without sub-sampling needs to be classified. Thus tuned clas-sifiers with dataset containing only the important features were then retrained on the disjoint of this subset and the area under study. The Receiver Operating Characteristic(ROC) curve for the subsets are shown in Figure 8, 9 and the respective feature of the area and performance in Table 4 and Table 5. The AUC scores can be interpreted as fairly acceptable. Given the imbal-anced nature of the data, a reasonable false positive rate can be expected.
Figure 8: Receiver Operating Characteristic Curve(segmentation threshold=0.15) using Gradient Boosting
3. CONCLUSION
Figure 9: Receiver Operating Characteristic Curve(segmentation threshold=0.10) using Gradient Boosting
which further validates the use of polarimetry product in investi-gating landslides. Only 75 top features as obtained from Random forest feature importance was required for the best performing model.
The exact time and date of the landslide can not be obtained from the original survey, instead we have a time frame during which the landslides had occurred. When obtaining satellite imagery, time and date are fixed, therefore the actual landslide may have occurred after the day of acquisition of imagery. Conversely, im-agery from a later date than that of landslide occurrence could be affected by other natural factors such as vegetation growth, lead-ing to different scatterlead-ing phenomenon than that of a landslide. Hence it can be assumed that there maybe errors due to commis-sion and omiscommis-sion in the original ground truth in comparison to the used imagery. Thus, combined with the performance of the classification methods as shown above, the use cases need careful evaluation.
The current availability of all weather Sentinel-1 data in a 12 day repeat cycle means that the proposed method is suitable for con-tinuous monitoring of landslide events. It can be used a priori to create a susceptibility map. Localized polygonal segments of landslide events can be obtained if high false positives are tol-erable. DEM generation from the polarimetry product through Differential Interferometry would be highly valuable. Although this process is computationally intensive, it can be obtained in the future, thus enabling a wider area of study for which landslide mapping has already been done. Furthermore, the quality of the intersection between the polylines and segmented polygons can be ascertained so that each sample in a learning algorithm is as-sociated to a particular weight. This might help improve the AUC score. Incorporating temporal parameters from before and after landslide occurrences and inclusion of soil moisture can also be explored in the future to develop landslide prediction capabilities.
REFERENCES
Albregtsen, F. et al., 2008. Statistical texture measures computed from gray level coocurrence matrices. Image processing labora-tory, department of informatics, university of oslo pp. 1–14.
Bergstra, J., Bardenet, R., K´egl, B. and Bengio, Y., 2011. Imple-mentations of algorithms for hyper-parameter optimization. In: NIPS Workshop on Bayesian optimization, p. 29.
Blaschke, T., Feizizadeh, B. and Holbling, D., 2014. Object-based image analysis and digital terrain analysis for locating landslides in the urmia lake basin, iran. Selected Topics in Ap-plied Earth Observations and Remote Sensing, IEEE Journal of 7(12), pp. 4806–4817.
Clausiyz, D. A. and Jernigany, M. E., 1995. Towards a novel approach for texture segmentation of sar sea ice imagery.
Cloude, S. R., Pottier, E. and Boerner, W. M., 2002. Unsu-pervised image classification using the entropy/alpha/anisotropy method in radar polarimetry. In: NASA-JPL, AIRSAR-02 Work-shop, pp. 04–06.
De Zan, F. and Guarnieri, A. M., 2006. Topsar: Terrain obser-vation by progressive scans. Geoscience and Remote Sensing, IEEE Transactions on 44(9), pp. 2352–2360.
GRASS Development Team, 2015. Geographic Resources Anal-ysis Support System (GRASS GIS) Software. Open Source Geospatial Foundation, USA.
Hammouda, K. and Jernigan, E., 2000. Texture segmentation using gabor filters. Canada: Center for Intelligent Machines, McGill University.
Humanitarian Data Exchange, 2015. https://data.hdx. rwlabs.org/.
Kotsiantis, S., Kanellopoulos, D., Pintelas, P. et al., 2006. Han-dling imbalanced datasets: A review. GESTS International Trans-actions on Computer Science and Engineering 30(1), pp. 25–36.
Kramer, H. J., 2012. Observation of the Earth and its Environ-ment: Survey of Missions and Sensors. Springer Science & Busi-ness Media.
Lee, J.-S. and Pottier, E., 2009. Polarimetric radar imaging: from basics to applications. CRC press.
Poudyal, C. P., Chang, C., Oh, H.-J. and Lee, S., 2010. Land-slide susceptibility maps comparing frequency ratio and artificial neural networks: a case study from the nepal himalaya. Environ-mental Earth Sciences 61(5), pp. 1049–1064.
Rana, B., 1935. Nepal’s great earthquake 1934.
Shan, Z., Wang, C., Zhang, H. and Chen, J., 2011. H-α decom-position and alternative parameters for dual polarization sar data. In: Proc. PIERS, pp. 1386–1390.
Soh, L.-K. and Tsatsoulis, C., 1999. Texture analysis of sar sea ice imagery using gray level co-occurrence matrices. Geoscience and Remote Sensing, IEEE Transactions on 37(2), pp. 780–795.
Stumpf, A. and Kerle, N., 2011. Object-oriented mapping of landslides using random forests. Remote Sensing of Environment 115(10), pp. 2564–2577.
Torres, R., Snoeij, P., Geudtner, D., Bibby, D., Davidson, M., Attema, E., Potin, P., Rommen, B., Floury, N., Brown, M. et al., 2012. Gmes sentinel-1 mission. Remote Sensing of Environment 120, pp. 9–24.
Veci, L., Lu, J., Prats-Iraola, P., Scheiber, R., Collard, F., Fom-ferra, N. and Engdahl, M., 2014. The sentinel-1 toolbox. In: Proceedings of the IEEE International Geoscience and Remote Sensing Symposium (IGARSS), IEEE, pp. 1–3.
Yamaguchi, Y., 2012. Disaster monitoring by fully polarimet-ric sar data acquired with alos-palsar. Proceedings of the IEEE 100(10), pp. 2851–2860.