SYNERGY OF OPTICAL AND SAR DATA FOR MAPPING AND MONITORING
MANGROVES
A. K. Monzon1,2, *, S.R. Reyes1,3, R. K. Veridiano1, R. Tumaneng1,4 and J. D. De Alban1,5
1Fauna & Flora International, Philippines Programme, Tagaytay City, Cavite, 4120 Philippines –[email protected] 2University of Cambridge, Cambridge CB1 2AL, United Kingdom - [email protected]
3Department of Geodetic Engineering, University of the Philippines, Diliman, Quezon City, 1101 Philippines – [email protected]
4Department of Science and Technology – Philippine Council for Industry, Energy and Emerging Technology, Taguig City 1631 Philippines – [email protected]
5Department of Biological Sciences, National University of Singapore, Singapore 117543 - [email protected]
Youth Forum
KEY WORDS: ALOS/PALSAR, R software, image segmentation, mangrove, forest monitoring
ABSTRACT:
Quantitative information on mangrove cover extents is essential in producing relevant resource management plans and conservation strategies. In the Philippines, mangrove rehabilitation was made a priority in relation to disaster risk response and mitigation following the calamities in the coastal communities during typhoon Haiyan/Yolanda; hence, baseline information on the extent of remaining mangrove cover was essential for effective site interventions. Although mangrove cover maps for the country already exists, analysis of mangrove cover changes were limited to the application of fixed annual deforestation rates due to the challenge of acquiring consistent temporal cloud-free optical satellite data over large landscapes. This study presents an initial analysis of SAR and optical imagery combined with field-based observations for detecting mangrove cover extent and changes through a straightforward graphical approach. The analysis is part of a larger study evaluating the synergistic use of time-series L-band SAR and optical data for mapping and monitoring of mangroves. Image segmentation was implemented on the 25-meter ALOS/PALSAR image mosaics, in which the generated objects were subjected to statistical analysis using the software R. In combination with selected Landsat bands, the class statistics from the image bands were used to generate decision trees and thresholds for the hierarchical image classification. The results were compared with global mangrove cover dataset and validated using collected ground truth data. This study developed an integrated replicable approach for analyzing future radar and optical datasets, essential in national level mangrove cover change monitoring and assessment for long-term conservation targets and strategies.
1. INTRODUCTION
Mangrove ecosystems make up 18.1 million ha of the global terrestrial landscape, in which large extents are found in tropical countries (Spalding, 1997). Mangroves are considered as highly productive ecosystems that shelter a wide array of species biodiversity with established ecological importance (Heumann 2011). Coastal communities also benefit from the productivity and resiliency of mangrove ecosystems that provides valuable goods and services (Künzer 2011). In the Philippines, mangroves constitute approximately 4% of the total forest cover (c.2000) and more than 40 species out of the 54 true mangrove species worldwide are found its coastal environment. The Philippines have relatively high mangrove diversity compared with the species found in North and Central America combined (Polidoro et al., 2010). Some of these species are found in the provinces of Quezon, Aurora, Oriental Mindoro, and Cebu to name a few (Maneja 2005).
Historically, in 1920s, mangrove cover in the Philippines was estimated between 400,000 to 500,000 ha (Brown & Fischer 1920). Recent studies such as by Long and Giri (2011) estimated mangrove cover at 256,185 ha using Landsat images in c.2000. Their estimates were marginally higher compared to data published by FAO and DENR data in 2003. Although different approaches and methodologies can cause a difference in the
* Corresponding author
estimation of mangrove cover, it was widely observed across different studies that there is a significant reduction in mangrove cover extent over the last century (Long et al. 2013).
Generating reliable quantitative information on the existing, if not remaining, extent of mangrove forest cover in the country has been more emphasized in the aftermath of the destruction caused by Typhoon Haiyan/Yolanda in 2013, particularly for mangrove rehabilitation in support of strategies for climate change adaptation, which includes biodiversity conservation and improved forest management. There are a number of different approaches to extracting information that are conventionally used to map mangroves including spectral analysis using optical satellite imageries, usage of vegetation indices, band ratios and digital elevation models, among many others (Mougin, Fromard, and Rudant 1995; Aschbacher et al. 1995; Alsaaideh et al. 2011). Optical satellite imagery has been the major source of spatial information. However, despite the availability of various optical data globally, tropical countries like the Philippines has always faced the challenge of having cloud cover across the landscape all throughout the year, which makes acquisition of a good quality optical imagery difficult.
In contrast, radar remote sensing uses spaceborne synthetic aperture radar (SAR) sensors that produces cloud-free imageries. The active signals also interact with the biophysical The International Archives of the Photogrammetry, Remote Sensing and Spatial Information Sciences, Volume XLI-B6, 2016
characteristics of a target area making it more sensitive to structure than object reflectance (Lusch 1999; Brolly and Woodhouse 2012). This makes the utility of SAR more advantageous for forest and mangrove cover mapping (Rosenqvist et al. 2010). With SAR data of global coverage becoming more available to the public, SAR can be an alternative data source.
This paper presents an initial analysis of SAR and optical imagery combined with field-based observations for detecting mangrove cover extent and changes through a straightforward graphical approach. The analysis is part of a larger study evaluating the synergistic use of time-series L-band SAR and optical data for mapping and monitoring of mangroves. The focus will be on looking at multi-temporal backscatter analysis and the Normalised Difference Vegetation Index (NDVI) across three study sites in the Philippine islands.
2. METHODS
2.1 Study Area
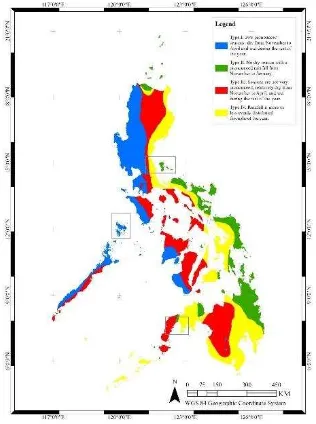
The study focused on three study sites located throughout the country representing various geographical regions and conditions of mangroves ecosystems, specifically Infanta and Burdeos, Quezon; Coron, Palawan; and Payao, Zamboanga Sibugay. Mangrove forests in Coron Palawan are still intact due to its geographic location. Situated in the northern part of Palawan province,the islands of Coron and Busuanga are geomorphologically characterised as having sandy loam, clay (Acrisols) and deep well drained (Nitisol) substrate suitable for terrestrial tropical tree species including mangrove species (Delvaux and Brahy, 2001; FAO et al., 2012; Schoppe et al., 2010). Mangroves in this site exhibited the characteristics of an old growth forest as seen from the biophysical attributes of the mangrove trees found in the sampling sites (see Figure 1). Anecdotal accounts from field guides and communities indicate that one of the primary reasons for the preservation of the old growth mangrove forests is the inaccessibility of these areas; hence making it difficult for local people to engage in forest degradation activities such as charcoal production and fishpond conversion. Additionally, alternative livelihood options are available such as ecotourism being one of the country’s prime tourist spots, which contributes to the likelihood that people are less likely to engage in mangrove forest deforestation and degradation activities.
Figure 1. The location of the three (3) study sites and their corresponding climate types based on the Coronas classification for the radar image analysis of mangroves: (1) the province of Quezon, (2) the municipality of Coron in Palawan and (3) the province of Zamboanga Sibugay. (from http://www.pagasa.dost.gov.ph/index.php/climate-of-the-philippines)
The second site, Infanta and Burdeos in Quezon province, exhibited reduced mangrove cover due to its geographic location and frequent occurrence of typhoons. In fact, Typhoon Nanmadol/Winnie in 2004 have contributed to the apparent loss of the mangrove areas in the municipalities of Polillo and Burdeos. The loss of mangroves was further reinforced due to market demands from harvesting Nipa species that is converted to local wine. The third site, Payao in Zamboanga Sibugay, lies in the southern part of Mindanao Island, which is rarely visited by typhoons hence not much mangrove forest cover loss is observed in the area. Since 2006, reforestation activities have been implemented in Zamboanga Sibugay site, spearheaded by organisations such as the Philippine Tropical Forest Conservation Foundation and Xavier Agricultural Extension Service Foundation, of which their continuous efforts have led to an observed increase in mangrove forest cover in the area over the last ten years.
2.2 Satellite Data
This study utilised the radar images acquired by the Japan Earth Resources Satellite-1 (JERS-1) and the Advanced Land Observing System Phased Array L-band Synthetic Aperture Radar (ALOS/PALSAR). These radar images were obtained through the Kyoto & Carbon (K&C) Initiative, an international collaboration headed by the Japan Aerospace Exploration Agency (JAXA) to support data and information needs of international environmental conventions, carbon cycle science, and conservation of the environment (Rosenqvist et al., 2010).
The JERS-1 and ALOS/PALSAR images were mosaic datasets with 25-meter spatial resolution. The JERS-1 images were comprised of a single HH polarisation band. The ALOS/PALSAR images consisted of dual polarisation bands, HH and HV. Pre-processing of the radar images were implemented following Reyes et al. (2015), with modifications for calculating the normalised radar-cross section for JERS-1 images. The time-series L-band SAR images were acquired in 1996, 2007, 2008, 2009 and 2010.
Landsat cloud-free image composite from the Global Forest Change Maps (2000 & 2013) by (Hansen et al. 2013) was also used to derive the Normalised Difference Vegetation Index (NDVI). This was computed using equation (1) (Tucker 1979):
���� = ����− ��
����+ �� (1)
Where: NDVI = normalised difference vegetation index ����= near infrared channel
�� = red channel
2.3 Field Data
Ground-truth data were collected in the selected study sites. Barangays were identified through coordination with the local government units (LGUs), non-government organisations (NGOs) and focal persons who were able to provide a brief The International Archives of the Photogrammetry, Remote Sensing and Spatial Information Sciences, Volume XLI-B6, 2016
validation of mangrove cover extent and changes. Most of the mangrove areas surveyed were extensive and were at least 50 meters by 50 meters in area. Local guides from the LGUs and NGOs assisted in the survey and provided anecdotal information about the mangrove areas, identifying the different mangrove species in the areas surveyed, age of the mangroves, possible causes of damages in the mangroves and if there are any mangrove planting or rehabilitation efforts in the area. Transect lines of at least 250 meters were established inside large mangrove areas and coordinates were acquired per 50-meter interval using a handheld global navigation satellite system receivers. Photos were taken at each of the four (4) cardinal directions to document the surrounding mangrove species or adjacent land cover type. In some cases where the area was not extensive for establishing a 250-meter transect, points were collected opportunistically.
2.4 Backscattering Analysis
The image analysis of the SAR images was carried out using eCognition v8.1. Satellite image composites consisted of the SAR images (HH, HV and HH/HV) and the Landsat 2003 and 2010 NDVI images. Object-based image analysis was implemented for backscatter analysis. Image segmentation was executed based on the SAR images to generate the image objects. The parameter values were determined by visually inspecting the quality of the image objects from the segmentation result using a combination of different parameters (Flores De Santiago, Kovacs, and Lafrance 2013; Nascimento et al. 2013). Based from the authors’ familiarity with the study sites gained from the conduct of the field assessments, the following parameters were deemed best for the segmentation: scale = 5, shape 0.1 and compactness = 0.9. The combination of these parameters were checked and verified by inspecting the resulting objects and its capability to capture the different features in the satellite images.
The ground-truth data were added as a thematic layer in point shapefile format. The image objects that were congruent with point locations of mangrove areas were used to extract the object statistics from each SAR image layer (HH, HV, HH/HV) per acquisition year and the Landsat NDVI layers (2000 & 2013). The statistics calculated for the backscatter analysis were the mean and standard deviations of each image objects. The statistics from the corresponding objects in the image to the ground-truth data were consolidated and exported using comma separated values (CSV) file format.
The consolidated information of backscatter statistics was then imported inside the R statistical software. Using the ‘ggplot2’ package in R, boxplot and scatterplot graphs were generated to assist in data visualisation and data interpretation (Wickham and Chang 2015). The boxplots were used to illustrate variation in backscatter responses of mangrove areas across the different validation sites per acquisition year. These variations were then analysed if it could be associated to the historically observed changes in these sites. The scatterplot was produced to graph the 2000 (x-axis) and 2013 (y-axis) mean NDVI values calculated from the image objects to visualise if there were significant changes in the mangrove cover that occurred in the sites within the 13-year period. This graph was also useful in discriminating potential outliers in the image objects. Generally, image objects with mean NDVI values greater than 0.40 were treated as mangroves; otherwise, the image objects were treated as non-mangroves and were discarded from the list.
3. RESULTS AND DISCUSSION
In this analysis, there was an average of 25-30 image objects generated per site per year. A total of 269 image objects that were analysed for Quezon, 152 objects for Coron, and 131 image objects for Zamboanga Sibugay were included in the analysis that covered the years 1996, 2007 to 2010. The backscatter responses from each site was expected to vary depending on a number of factors, including, but is not limited to, the following: the type of mangrove cover present, growth stage of the mangroves and amount of water and moisture found during the time of image acquisition. Theoretically, interpretation of radar backscatter responses can be grouped into three major types of scattering mechanism. The occurrence of very high backscatter values (> -5db) indicates the presence of man-made structures that cause high amount of signal returns to the sensor. On the other hand, high backscatter values (-15 < -5 db) indicate the presence of different kinds and stages of vegetation, which may include the shrublands, plantations, natural forests and mangroves, among others. Finally, the third group pertains to areas with flat surfaces deflecting the transmitted signal of the sensor causing minimal returns to the sensor upon acquisition, resulting to low backscatter values (< -15 db). These areas include water bodies, agricultural areas and fishponds, among others.
Collectively, the mangrove areas across all three sites have mean values between -10 to -8 db that was observed to be lower from the backscatter response of terrestrial forests, specified as non-mangroves (Figure 1). This observation reinforces the basic consideration in interpreting radar backscatter related to the biophysical characteristics of the target features. In this case, structures of the tree species in terrestrial forests have more or less cylindrical shape, with heights reaching 10 – 30 meters contributing to stronger signal returns. On the contrary, it was expected that mangrove areas return a slightly lower backscatter response due to varying tree structures and sizes (i.e. Rhizophora sp., Avicennia sp., etc.), moisture content and tide levels present in these types of ecosystems. This is further investigated by looking at the three areas of interest separately.
Figure 2. Mean backscatter values of the ground truth data collected from all three sites (Palawan, Quezon and Zamboanga Sibugay) comparing mangroves and non-mangroves in (top) HH and (bottom) HV polarisations.
The graphs in Figure 2 show the mean backscatter values of the mangrove areas found in the three study sites per year. Overall, it is observed that the HH polarisation shows higher backscatter responses (-16 to -7 db) with more variations in the mean values extracted per year as compared to the HV polarisation. The backscatter values from the HV polarisation show low backscatter responses (-22 to -12 db) and stable mean values across the years. Although all locations where these values were extracted all pertain to mangrove areas, it can also be observed that the mean backscatter values were noticeably distinct, occupying a certain range of values for each site.
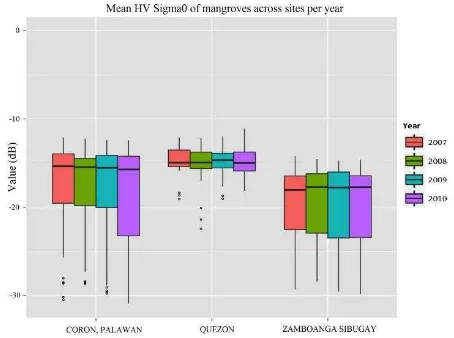
Figure 3. Mean backscatter values for (top) HH and (bottom) HV polarisation for the years corresponding the acquisition years of the SAR image mosaics (JERS-1 and PALSAR-1) using the ground truth points collected from the mangrove areas across three sites, namely: Palawan (Coron), Quezon (Infanta and Burdeos) and Zamboanga Sibugay (Ipil, Kabasalan, Siay and Payao).
The mean HH values of mangrove areas in Coron, Palawan shows a stable backscatter value between -10 to -9 db from 1996 to 2010, whilst its corresponding mean HV values were also stable between -16 to -15 db (Figure 3). This response is attributed to the almost unchanging mangrove areas in Coron, Palawan where mangrove ecosystems remain intact and not easily accessible for charcoal production and land conversion.
Mangroves found in Quezon province returned higher backscatter values compared to Coron, with a range of mean values between -9 to -7 db for HH and around -5 db for HV. Looking at the data temporally, there is an apparent drop of the mean HH values for the mangrove areas in Quezon between 1996 and 2007. It slightly increased from 2007 to 2008, but steadily dropped again from 2008 to 2010. The observed drop in the backscatter values between 1996 and 2007 may have been a result of the destruction caused by the Typhoon Winnie in 2004. True species of mangroves that have been lost were replaced by mangrove associate species, specifically Nipa species since market demands for local wines harvested from Nipa increased.
Lastly, the mangrove areas of Zamboanga Sibugay showed the lowest mean backscatter values for both HH and HV polarisations. The mean HH values were found around -10 db across almost all the years, except for the mean backscatter value of 1996 found at around -12 db. The mean HV values in 2007 to 2010 were found at around -18 db. The mangrove reforestation activities since 2006 in many abandoned fishponds across different municipalities in the province, resulting to the expansion of mangrove areas, was thought to be the primary reason for the increase in the detected backscatter values in this site. However, we note that despite the success of mangrove reforestation in Zamboanga Sibugay, the mangroves were still in its growing stages. Some areas still look more like abandoned fishponds, dominated by mud flats with young mangroves sticking out from the mud. Having a mixed cover of young vegetation and relatively flat surfaces would explain the low mean backscatter values observed in this site.
DNVI derived from the Global Forest Change data by Hansen et al 2013. The scatter plot from Figure 4 visually shows a good fit of the ground truth points on the regression line for points coming from the mangrove areas in Quezon and Palawan. This suggests that the mangrove areas in both these sites experienced little change between the period of 2000 and 2013. On the other hand, the scatter plot for Zamboanga Sibugay shows points found beneath the regression line that indicates a decrease in NDVI values and points above the regression line that indicates an
increase of NDVI value from 2000 to 2013. This may suggest that the mangrove areas have experienced increase and decrease in mangrove cover between 2000 and 2013. Arguably, the areas visited in Zamboanga Sibugay were abandoned fishponds that consist of areas that can still be inundated with water caused by the tides. For cases in which mangroves were newly planted and images were acquired during high tides, this can contribute to the decrease in NDVI.
Figure 4. Scatter plot of the mangrove areas showing the mean NDVI values from Landsat 2000 and 2013 global mosaic data by Hansen et al. 2013.
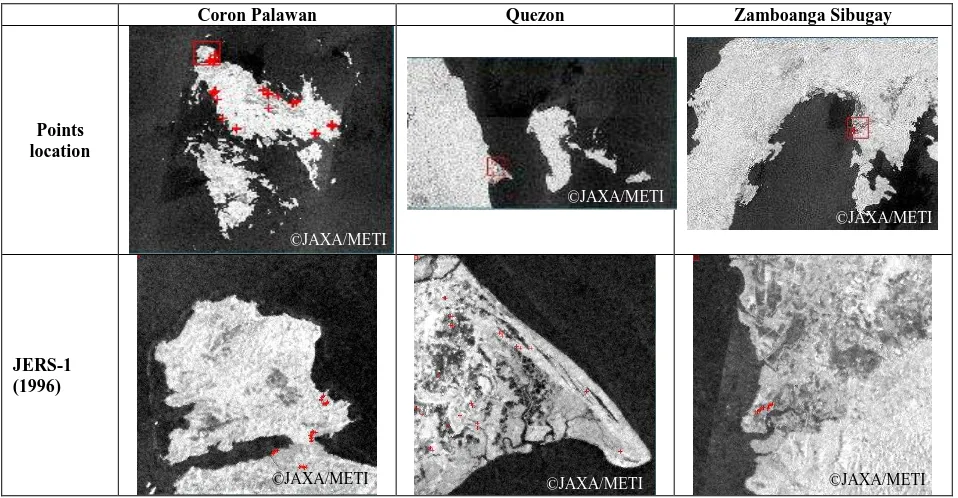
Table 1. Field validated areas in Palawan (Coron), Quezon (Infanta) and Zamboanga Sibugay (Payao) as seen on the different satellite images acquired across different years, temporal-composite image and actual photos from the field. Images by JAXA/METI.
Coron Palawan Quezon Zamboanga Sibugay
Points location
JERS-1 (1996)
©JAXA/METI ©JAXA/METI
©JAXA/METI
©JAXA/METI ©JAXA/METI
©JAXA/METI
PALSAR (2007)
NDVI 2000
NDVI 2013
RGB: (1996 – 2007 – 2010)
Field pictures
©JAXA/METI ©JAXA/METI
©JAXA/METI
©JAXA/METI
©JAXA/METI
©JAXA/METI ©JAXA/METI
©JAXA/METI ©JAXA/METI
©JAXA/METI ©JAXA/METI ©JAXA/METI
©JD De Alban, 2014
©SR Reyes, 2015 ©AK Monzon, 2014
The RGB composite image in Table 1 shows a visual representation of the 1996-2007-2010 ALOS/PALSAR HH band across the three study sites. We can observe that Coron, Palawan has a general bright gray color display which indicates insignificant change across the three year period of the image composite. Infanta, Quezon displays magenta colored areas in the validation sites indicating the presence of mangroves in 1996 and 2010. Ground truth areas in Payao, Zamboanga Sibugay displays green and cyan colored pixels indicating growth. Pictures from the validation sites show the landscape characteristic of the different mangrove areas that corresponds to the observed backscatter responses.
4. CONCLUSIONS
In the aim to highlight radar images as a viable alternative for mangrove cover mapping, this study presented a straightforward approach in interpreting radar images using graphical analysis of the backscatter responses across three different mangrove sites in the Philippines. Understanding the different physical structures present in the mangroves areas across the sites proved to be essential in explaining the causes of high and low backscatter responses in what is considered to be a single land cover type. Well established and undisturbed mangrove areas will have high backscatter responses with structures that would compare to terrestrial forest. Mangrove areas with smaller and irregular tree structures, having relatively more exposed flat surfaces containing water, will tend to have mid-range backscatter responses. Lower backscatter responses was observed in areas where younger mangroves were found, including newly planted mangrove areas on abandoned fishpond areas. Having these considerations in mind, observed changes in the mangrove cover across the years were more pronounced in Zamboanga Sibugay and Infanta, Quezon; whilst Coron, Palawan was found to have less significant changes between the observed years. These observations were further supported by looking into the consistency and changes in the NDVI values across the sites. Using this graphical approach to understanding radar backscatter statistics that directly relates to actual field observations is recommended to assist users in recognising the strengths and potential of radar technologies for land cover mapping. Consequently, this can further develop the motivation to mainstream the use of radar technologies. Future studies can be pursued to further the synergistic approach in using radar and optical image information for improved mangrove and land cover mapping efforts.
ACKNOWLEDGEMENTS
This study was conducted by Fauna & Flora International under the funding support of the Philippine Tropical Forest Conservation Foundation, Inc., and; Biodiversity and Watersheds Improved for Stronger Economy and Ecosystem Resilience (B+WISER) Programme. B+WISER is funded by the United States Agency for International Development and implemented by Chemonics International (Contract No. AID-492-C-13-00002). The authors’ views expressed in this publication do not necessarily reflect the views of the United States Agency for International Development or the United States Government. The authors would also like to thank the following institutions who have assisted in the conduct of the field assessments: local government units of Burdeos and Infanta, Quezon; Coron, Palawan, and; Ipil, Kabasalan, Siay and Payao, Zamboanga Sibugay; Polillo Islands Biodiverisity Conservation Foundation Inc (PIBCFI); Community Centred Conservation (C3); Partnership of Philippine Support Service Agencies (PHILSSA) and Kapunungan sa mga Gagmayang Mangingisda sa
Concepcion (KGMC). This work has been undertaken within the framework of the JAXA Kyoto & Carbon Initiative and through a joint collaboration of Deutsche Gesellschaft für Internationale Zusammenarbeit (GIZ) GmbH, Fauna & Flora International, and Department of Geodetic Engineering of the University of the Philippines. ALOS/PALSAR data have been provided by JAXA Earth Observation Research Center.
REFERENCES
Alsaaideh, B., A. Al-Hanbali, R. Tateishi, and H.N. Thanh. 2011. “The Integration of Spectral Analyses of Landsat ETM+ with the DEM Data for Mapping Mangrove Forests.” In Geoscience and Remote Sensing Symposium (IGARSS), 2011 IEEE International, 1914–17. doi:10.1109/IGARSS.2011.6049499.
Aschbacher, J., P. Tiangco, C.P. Giri, R.S. Ofren, D.R. Paudyal, and Y.K. Ang. 1995. “Comparison of Different Sensors and Analysis Techniques for Tropical Mangrove Forest Mapping.” In Geoscience and Remote Sensing Symposium, 1995. IGARSS ’95.
“Quantitative Remote Sensing for Science and Applications”,
International, 3:2109–11 vol.3.
doi:10.1109/IGARSS.1995.524122.
Brolly, Matthew, and Iain H. Woodhouse. 2012. “A ‘Matchstick Model’ of Microwave Backscatter from a Forest.” Ecological
Modelling 237–238 (0): 74–87.
doi:10.1016/j.ecolmodel.2012.04.014.
Claudia Künzer, A. Bluemel. 2011. “Remote Sensing of Mangrove Ecosystems: A Review.” Remote Sensing, no. 2011-05-04: 878–928.
Delvaux, M., Brahy, V., 2001. "LECTURE NOTES ON THE MAJOR SOILS OF THE WORLD."
FAO, IIASA, ISRIC, ISSCAS, JRC, 2012. "Harmonised World Soil Database."
Flores De Santiago, Francisco, John M Kovacs, and Patrick Lafrance. 2013. “An Object-Oriented Classification Method for Mapping Mangroves in Guinea, West Africa, Using Multipolarized ALOS PALSAR L-Band Data.” International Journal of Remote Sensing 34 (2): 563–86.
Hansen, M. C., P. V. Potapov, R. Moore, M. Hancher, S. A. Turubanova, A. Tyukavina, D. Thau, et al. 2013. “High-Resolution Global Maps of 21st-Century Forest Cover Change.” Science 342 (6160): 850–53. doi:10.1126/science.1244693.
Heumann, B W. 2011. “Satellite Remote Sensing of Mangrove Forests: Recent Advances and Future Opportunities.” Progress in Physical Geography 35 (1): 87–108. doi:10.1177/0309133310385371.
Long, Jordan B., and Chandra Giri. 2011. “Mapping the Philippines’ Mangrove Forests Using Landsat Imagery.” Sensors (Basel, Switzerland) 11 (3): 2972–81. doi:10.3390/s110302972.
Long, Jordan B., Darrell Napton, Chandra Giri, and Jordan Graesser. 2013. “A Mapping and Monitoring Assessment of the Philippines’ Mangrove Forests from 1990 to 2010.” Journal of Coastal Research.
Lusch, David P. 1999. "ntroduction to Microwave Remote Sensing. Michigan State University: Basic Science and Remote Sensing Initiative."
Maneja, Rommel H. 2005. “State of Mangrove Forests in the Philippines.” Poster presentation, Universidade do Algarve. http://www.freewebs.com/arbmwcnetwork/Philippines.pdf.
Mougin, E., F. Fromard, and J.P. Rudant. 1995. “Mapping on Mangrove Forest Using Multisource Data.” In Geoscience and
Remote Sensing Symposium, 1995. IGARSS ’95. “Quantitative
Remote Sensing for Science and Applications”, International, 2:1222–24 vol.2. doi:10.1109/IGARSS.1995.521190.
Nascimento, W.R., Souza-Filho, P.W.M., Proisy, C., Lucas, R.M. and Rosenqvist, A., 2013. Mapping changes in the largest continuous Amazonian mangrove belt using object-based classification of multisensor satellite imagery. Estuarine, Coastal and Shelf Science, 117, pp.83-93.
Polidoro, B.A., Carpenter, K.E., Collins, L., Duke, N.C., Ellison, A.M., Ellison, J.C., Farnsworth, E.J., Fernando, E.S., Kathiresan, K., Koedam, N.E. and Livingstone, S.R., 2010. The loss of species: mangrove extinction risk and geographic areas of global concern. PloS one, 5(4), p.e10095.
Rosenqvist, Ake, Masanobu Shimada, Richard M Lucas, Bruce D Chapman, Philippe Paillou, Laura L Hess, and John Lowry. 2010. “The Kyoto & Carbon Initiative - a Brief Summary.” IEEE Journal of Selected Topics in Applied Earth Observations and
Remote Sensing 3 (4): 551–53.
doi:10.1109/JSTARS.2010.2086270.
Schoppe, S., Matillano, J., Cervancia, M., Acosta, D., 2010. "Conservation Needs of the Critically Endangered Philippine Forest Turtle, Siebenrockiella leytensis, in Palawan, Philippines. Chelonian Conserv." Biol. 9, 145–153. doi:10.2744/CCB-0783.1
Spalding, M., 1997. "The global distribution and status of mangrove ecosystems." International News Letter of Coastal Management-Intercoast Network, 1, pp.20-21.
Tucker, Compton J. 1979. “Red and Photographic Infrared Linear Combinations for Monitoring Vegetation.” Remote Sensing of Environment 8 (2): 127–50.
Walpole, Pedro. 2010. Figuring the Forest Figures. Environmental Science for Social Change.
Wickham, Hadley, and Winston Chang. 2015. ggplot2: An Implementation of the Grammar of Graphics (version 1.0.1). http://cran.r-project.org/web/packages/ggplot2/index.html.