Metabolism in Treatment-Resistant Bipolar Disorder
Terence A. Ketter, Tim A. Kimbrell, Mark S. George, Robert T. Dunn,
Andrew M. Speer, Brenda E. Benson, Mark W. Willis, Aimee Danielson,
Mark A. Frye, Peter Herscovitch, and Robert M. Post
Background: Functional brain imaging studies in
unipo-lar and secondary depression have generally found de-creased prefrontal cortical activity, but in bipolar disor-ders findings have been more variable.
Methods: Forty-three medication-free, treatment-resistant,
predominantly rapid-cycling bipolar disorder patients and 43 age- and gender-matched healthy control subjects had cerebral glucose metabolism assessed using positron emis-sion tomography and fluorine-18-deoxyglucose.
Results: Depressed bipolar disorder patients compared to
control subjects had decreased global, absolute prefrontal and anterior paralimbic cortical, and increased normal-ized subcortical (ventral striatum, thalamus, right amyg-dala) metabolism. Degree of depression correlated nega-tively with absolute prefrontal and paralimbic cortical, and positively with normalized anterior paralimbic sub-cortical metabolism. Increased normalized cerebello-pos-terior cortical metabolism was seen in all patient sub-groups compared to control subjects, independent of mood state, disorder subtype, or cycle frequency.
Conclusions: In bipolar depression, we observed a
pat-tern of prefrontal hypometabolism, consistent with obser-vations in primary unipolar and secondary depression, suggesting this is part of a common neural substrate for depression independent of etiology. In contrast, the cer-ebello-posterior cortical normalized hypermetabolism seen in all bipolar subgroups (including euthymic) sug-gests a possible congenital or acquired trait abnormality. The degree to which these findings in treatment-resistant, predominantly rapid-cycling patients pertain to commu-nity samples remains to be established. Biol Psychiatry 2001;49:97–109 © 2001 Society of Biological Psychiatry
Key Words: PET, cerebral metabolism, bipolar disorders,
depression, rapid cycling
Introduction
A
substantial series of investigations using positron emission tomography (PET) and single photon emis-sion computed tomography (SPECT) to assess regional cerebral flow (rCBF) and glucose metabolism (CMRglu) have most consistently found decreased prefrontal cerebral activity (hypofrontality) in unipolar depressed patients compared to control subjects (for a review see Ketter et al 1996b).A small number of studies in bipolar depressed patients have also found decreased prefrontal CMRglu (Baxter et al 1989; Buchsbaum et al 1984, 1986; Cohen et al 1989, 1992; Goyer et al 1992; Martinot et al 1990; Schwartz et al 1987) and CBF (Ebert et al 1993; Ketter et al 1996b) compared to control subjects; however, some studies indicated that certain prefrontal and temporal areas had increased CMRglu (Cohen et al 1992; Goyer et al 1992; Ketter et al 1994). Global CMRglu in depressed bipolar disorder patients has commonly been decreased (Baxter et al 1985, 1989; Cohen et al 1992; Goyer et al 1992; Martinot et al 1990; Schwartz et al 1987), but has also been noted to be increased (Buchsbaum et al 1986). This heterogeneity could be related to methodologic differ-ences, illness subtypes, state-trait differdiffer-ences, or degree of responsiveness to treatment (Ketter et al 1999).
In a recent study, Drevets and associates (Drevets et al 1997) found decreased rCMRglu and rCBF in the prefron-tal cortex ventral to the genu of the corpus callosum (subgenual prefrontal) in both familial bipolar depressives and familial unipolar depressives. Decreased activity was accompanied by corresponding substantial reductions in gray matter volume in this area of 39% in unipolar and 48% in bipolar patients. Decreased CMRglu in the tem-poral lobes (Goyer et al 1992; Ketter et al 1996b; Martinot et al 1990; Post et al 1987) and basal ganglia (Buchsbaum et al 1986; Cohen et al 1989) has also been reported. From the Department of Psychiatry and Behavioral Science, Stanford University
School of Medicine, Stanford, California (TAKe), Biological Psychiatry Branch, National Institute of Mental Health, Bethesda, Maryland (TAKe, TAKi, MSG, RTD, AMS, BEB, MWW, AD, MAF, RMP), Veterans Admin-istration Medical Center, North Little Rock, Arkansas (TAKi), Medical University of South Carolina, Charleston (MSG), University of California, Los Angeles (MAF), and National Institutes of Health Clinical Center, Bethesda, Maryland (PH).
Address reprint requests to Robert M. Post, M.D., Chief, Biological Psychiatry Branch, National Institute of Mental Health, Bldg. 10, Room 3N212, 10 Center Drive, MSC 1272, Bethesda MD 20892-1272.
Received January 10, 2000; revised June 23, 2000; accepted June 29, 2000.
© 2001 Society of Biological Psychiatry 0006-3223/01/$20.00
In view of these varying findings in bipolar disorders, we obtained fluorine-18-deoxyglucose (18FDG) PET scans in a substantial series of medication-free bipolar disorder patients compared with age- and gender-matched control subjects while performing an auditory continuous perfor-mance task, to better understand how changes in prefrontal and anterior paralimbic rCMRglu relate to clinical param-eters, such as mood state, degree of depression, disorder subtype, and cycle frequency.
Methods and Materials
Subjects, Medications, and Mood Ratings
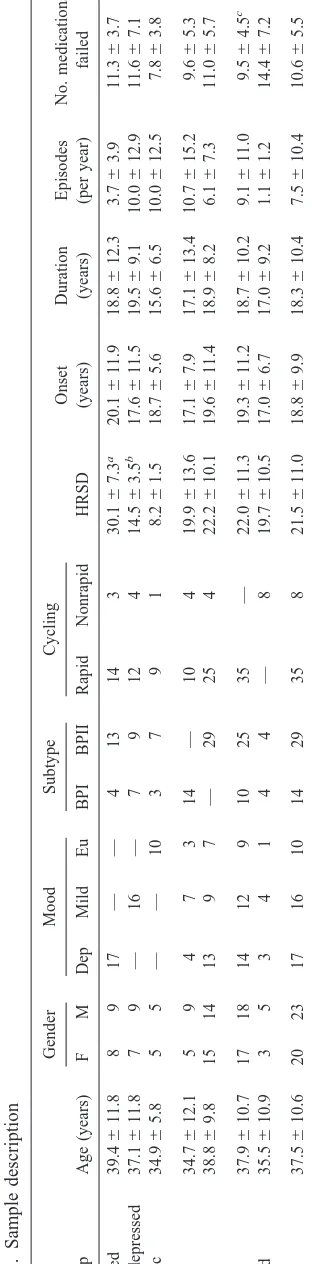
The study was approved by the National Institute of Mental Health (NIMH) Institutional Review Board, and written in-formed consent was obtained from all subjects before participa-tion. We studied 43 inpatients (age range, 21– 65 years) with DSM-IV bipolar disorders that were resistant to standard treat-ments in the community and referred to the NIMH (Table 1). This highly treatment-resistant group of bipolar disorder patients had medians of 19 years of illness duration, 16 manic/hypomanic episodes, 24 depressive episodes, and 4 hospitalizations per patient. Medical and neurologic histories and physical examina-tions were obtained to rule out medical illnesses in patients and in age- and gender-matched healthy control subjects. Both diagnoses in patients and the absence of mental illness in 43 paid healthy control subjects (age range, 20 – 65 years) were con-firmed by the Schedule for Affective Disorders and Schizophre-nia (Endicott and Spitzer 1978). Episodes and hospitalizations as well as the presence of a current rapid cycling pattern (four or more affective episodes in the year before the PET scan) were determined by examination of retrospective lifecharts assessed by the NIMH-Life Chart Methodology (NIMH-LCM) (Leverich and Post 1996, 1998).
Trained clinical research nurses blind to medication status and scans obtained twice-daily global Bunney-Hamburg depression (BH-D) (Bunney and Hamburg 1963), weekly 28-item Hamilton Rating Scale for Depression (HRSD) (Hamilton 1960), Mood Analog, and global Bunney-Hamburg mood ratings, and in 30 patients day-of-scan HRSD and Young Mania Rating Scale (Young et al 1978) ratings. Self-rated Beck Depression Inventory (Beck et al 1961) scores were also obtained weekly.
The patient sample was subdivided using three clinical phe-nomenologic parameters: mood state (depressed, mildly de-pressed, euthymic), bipolar subtype (bipolar I, bipolar II), and rapid-cycling status (currently rapid cycling, non–rapid cycling). No patient had a full acute manic syndrome (mean Young Mania Rating Scale score 3.1 6 3.2, range 0 –13). Patients were classified as euthymic if they had no or only mild symptoms on prospective NIMH-LCM and thus no functional impairment, HRSD scores of 10 or less, and BH-D scores of 3 or less. Those with HRSD scores of 18 or greater and BH-D scores of 7 or greater were considered depressed, and those with HRSD scores ranging from 11 to 17 and BH-D scores ranging from 4 to 6 were classified as mildly depressed. The four instances of
disagree-ment between HRSD and BH-D were dealt with by referring to Table
prospective NIMH-LCM, and HRSD and BH-D ratings for the periods immediately before and after scans to resolve the mood state determination. The mood state (depressed vs. mildly de-pressed vs. euthymic), bipolar subtype (bipolar I vs. bipolar II), and rapid-cycling status (currently rapid cycling vs. non–rapid cycling) subgroups did not differ significantly with respect to age, gender, or subgroup compositions with respect to one another (Table 1).
Patients and healthy control subjects had taken no medications for at least 2 weeks before positron emission tomography (PET) scans. Control subject and patient PET scans were acquired in an interspersed fashion over the duration of the study.
Scanning Procedure
We used a Scanditronix (Uppsala, Sweden) PC1024-7B tomo-graph and (18
FDG) to assess absolute and normalized CMRglu in subjects performing an auditory discrimination continuous per-formance task (CPT) with eyes covered for 30 min as previously described (Ketter et al 1999). Radial arterial cannulation was performed on all subjects to allow quantification of absolute CMRglu. Serial arterial blood samples were obtained so that a time-activity curve for the determination of absolute rCMRglu could be constructed. The conversion of image pixel values from nanocuries per cubic centimeter to milligrams of glucose per hundred grams of tissue per minute (mg/100 3 g/min) was performed as described elsewhere (Kumar et al 1992).
Data Analysis
Image processing was performed using Statistical Parametric Mapping (SPM 95, courtesy of Medical Research Council Cyclotron Unit, Hammersmith Hospital, London UK) software (Friston et al 1995). Stereotactic normalization was performed on the images as previously described (Ketter et al 1999). Whole-brain mean (WBM) activity was calculated for each stereotacti-cally normalized image as the mean of all voxels greater than the background threshold, which was set at 1/8 of the mean of the entire image space, to approximately include gray and white matter only. For use in global analyses, estimated gray matter mean activity was calculated as the mean of all voxels above 70% of each subject’s WBM. Normalized rCMRglu analyses used a voxel-based analysis of covariance (Friston et al 1990), which generated in each voxel the residual of the subject’s rCMRglu from a regression of rCMRglu on WBM across all subjects. Statistically significant focal interscan differences in rCMRglu residuals, assumed to be independent of intersubject global CMRglu changes, were then calculated. Absolute analyses were also performed, without any adjustment to normalize global CMRglu.
Absolute and normalized rCMRglu were compared between groups of bipolar disorder patients and age- and gender-matched healthy control subjects, and between subgroups of patients. The latter analyses were covaried for age and gender to remove possible effects of demographic differences between patient subgroups. Correlations between rCMRglu and clinical measures were also assessed, covarying for age and gender, and, when appropriate, mood. Results were displayed as transverse
statisti-cal parametric maps (SPMs) with significant voxels color coded to correspond to decreasing p-values (starting at p 5.05, not initially corrected for multiple comparisons). Correction for multiple comparisons was applied by only displaying voxels within clusters deemed significant by particle analysis using a
Z-threshold of 1.96 and cluster probability,0.05 (Friston et al
1994).
Demographic and clinical patient data were analyzed using unpaired t-tests for between-group comparisons. Categorical data were analyzed by x2 tests. Means (6standard deviations) are reported, and significance thresholds were set at p5.05, unless noted otherwise.
Results
Among subjects with complete CPT data, 29 patients compared to 34 control subjects had slower mean reaction time [0.9060.18 vs. 0.7560.21 sec, t(61)52.98, p5
.004], but did not otherwise differ significantly on CPT performance parameters.
Mood State Subgroups
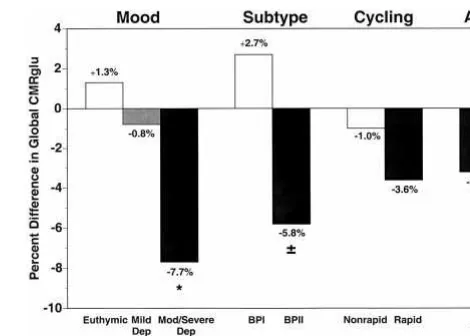
The 17 depressed bipolar patients with HRSD scores greater than 17, compared to 17 age- and gender-matched control subjects had 7.7% lower global metabolism [7.15 6 0.89 vs. 7.75 6 0.80, t(32) 5 2.07, p , .05; Figure 1]. Decreased absolute (but not normalized) re-gional metabolism was seen in widespread prefrontal and anterior paralimbic cortical regions, including inferior (Brodmann areas [BAs] 44, 45, 46), middle (BAs 8, 9, 10, 46), and superior (BAs 9, 10) frontal gyri; superior (BAs 22, 39, 40, 42), middle (BAs 21, 39, 40), and transverse (BA 41) temporal gyri; as well as in inferior parietal lobule (BAs 39, 40), and bilateral lateral cerebellum (Figure 2, top, and Table 2). Decreased absolute (and to a lesser
degree normalized) metabolism was also seen in fascicular (BA 19) and lingular (BAs 18, 19) gyri (Figure 2 and Table 2).
In contrast, increased normalized (but not absolute) metabolism was noted in subcortical regions, including right amygdala, bilateral accumbens, and ventral caudate and putamen, as well as in right anterior superior longitu-dinal fasciculus, bilateral medioposterior thalamus (dorso-medial nucleus, pulvinar), and bilateral (dorso-medial cerebellum (Figure 2, bottom). Thus, in depressed bipolar disorder patients there were three main components to the pattern of differences compared to control subjects, namely 1) widespread prefrontal and anterior paralimbic cortical absolute decreases; 2) subcortical (ventral striatum, thala-mus, right amygdala) normalized increases; and 3) cere-bellar and posterior cortical normalized increases.
The 16 mildly depressed patients with HRSD scores ranging from 11 to 17, compared with 16 control subjects, did not differ significantly in global metabolism (7.316
0.94 vs. 7.3761.11; Figure 1) or in the absolute regional analysis. Increased normalized (but not absolute) metabo-lism was noted in bilateral cerebellum (sparsely), lingular gyrus (BAs 18, 19), cuneus (BAs 18, 31), and hippocam-pus; left postcentral gyrus (BAs 1, 2, 3); left insula and left transverse temporal gyrus (BA 41); and left inferior (BAs 44, 45, 47), middle (BAs 9, 10, 46), and superior (BAs 8, 9) frontal gyri. In contrast, decreased normalized (but not absolute) metabolism was noted in right inferior (BAs 20, 37) and middle (BAs 20, 21) temporal gyri (Table 2).
The 10 euthymic patients, compared with 10 control subjects, did not differ significantly in global metabolism (7.7361.21 vs. 7.6361.00; Figure 1) or in the absolute
regional analysis (Figure 3, top). Increased normalized (but not absolute) metabolism was noted in bilateral cerebellum, lingular gyrus (BA 18), cuneus (BAs 18, 19, 31), and precuneus (BA 7); as well as right inferior frontal gyrus (BA 44), right superior longitudinal fasciculus, right insula, and right inferior parietal lobule (BA 40; Figure 3, bottom, and Table 2).
Direct comparison of the 17 depressed versus 10 euthy-mic patients (covarying for age and gender) revealed no significant global difference but decreased (lower in de-pressed) both absolute and normalized metabolism in left postcentral gyrus (BAs 40, 43), left inferior parietal lobule (BAs 39, 40), and left supramarginal gyrus (BA 40). Also, decreased normalized (but not absolute) metabolism was noted in left precentral (BA 6), left middle frontal (BA 9), and left inferior frontal (BA 44) gyri; bilateral lingular gyrus (BA 18), and cuneus (BA 18). In contrast, increased (higher in depressed) normalized (but not absolute) me-tabolism was seen in right inferior (BAs 45, 46, 47), middle (BAs 8, 9, 10, 46), and superior (BA 9) frontal gyri, bilateral accumbens, and ventral caudate and puta-men (Table 3).
Direct comparison of the 17 depressed versus 16 mildly depressed patients and of the of the 16 mildly depressed versus 10 euthymic patients (covarying for age and gen-der) revealed no global or cerebellar differences but some regional differences (Table 3).
Thus, the metabolic difference patterns obtained from comparing depressed with both euthymic and mildly depressed patients appeared to be attenuated forms of the pattern seen comparing depressed patients with healthy control subjects, in that they included two main compo-nents, namely 1) cortical absolute decreases, and 2) paralimbic subcortical normalized increases, but they lacked the cerebellar, posterior cortical, and posterior thalamic normalized increases seen when comparing de-pressed patients to healthy control subjects.
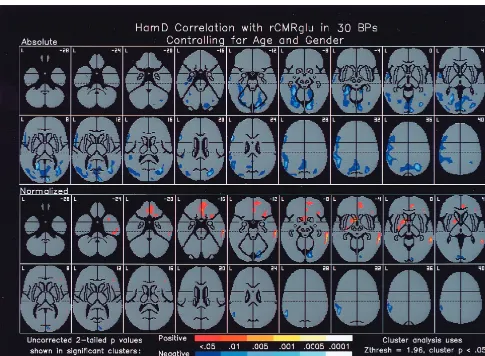
Severity of Depression Correlation
On the day of the scan, HRSD (mean6SD 21.5611.0; n5 30) covarying for age and gender was not signifi-cantly correlated with global metabolism but correlated inversely with absolute (but not normalized) metabolism in prefrontal and anterior paralimbic cortical regions, including left inferior (BAs 44, 45) and middle (BA 9) frontal gyri, left temporal pole (BA 22), and left middle temporal gyrus (BA 21), as well as left hippocampus (Figure 4). On the day of the scan, HRSD also correlated inversely with absolute (and to a lesser extent normalized) metabolism in left inferior parietal lobule (BAs 39, 40), bilateral cuneus (BAs 17, 18), fascicular (BAs 19, 20) and lingular (BAs 18, 19) gyri, and right posteromedial cerebellum.
Figure 2. Regional cerebral metabolism (rCMRglu) in depressed bipolar disorder patients compared with healthy control subjects. Z maps of differences in absolute and normalized cerebral metabolism in 17 depressed bipolar disorder patients compared to 17 healthy control subjects. Legend indicates two-tailed p values. Numbers in upper right corners indicate distances from the intercommissural plane. Absolute prefrontal and anterior paralimbic cortical metabolic decreases and normalized anterior paralimbic subcortical metabolic increases evident in these images may be a state marker for depression in bipolar disorders. Ham-D, Hamilton Rating Scale for Depression; L, left.
4™™™™™™™™™™™™™™™™™™™™™™™™™™™™™™™™™™™™™™™™™™™™™™™™™™™™™
4™™™™™™™™™™™™™™™™™™™™™™™™™™™™™™™™™™™™™™™™™™™™™™™™™™
Conversely, degree of depression correlated positively with normalized metabolism in subcortical anterior paral-imbic regions, including basal forebrain and ventral cau-date and putamen, as well as in subgenual and pregenual anterior cingulate (BAs 24, 32), medial (BAs 10, 11) and right inferior (BAs 45, 46, 47) frontal gyri, and right middle (BAs 20, 21) and inferior (BA 20) temporal gyri. The overall pattern thus largely overlapped the prefrontal and anterior paralimbic cortical absolute decreases and subcortical normalized increases seen in depressed pa-tients compared to control subjects.
Bipolar I and Bipolar II Subgroups
The 14 bipolar I patients compared with 14 healthy control subjects did not significantly differ in global metabolism (7.3560.84 vs. 7.1661.13; Figure 1) and had increased normalized metabolism in bilateral cerebellum (cerebel-lum also had increased absolute metabolism), lingular gyrus (BAs 18, 19), and cuneus (BAs 29, 30, 31; Table 2). The 29 bipolar II patients compared with 29 healthy control subjects tended to have 5.8% lower global metab-olism [7.3461.07 vs. 7.7860.64, t(56)51.78, p,.08; Figure 1], and had decreased absolute (but not normalized) metabolism in right lateral prefrontal cortex, including
superior (BAs 9, 10), middle (BAs 9, 10, 46), and inferior (BAs 44, 45, 46) frontal gyri, as well as right insula and right temporal pole. In contrast, increased normalized (but not absolute) metabolism was noted in left cerebellum (sparse), left lingular gyrus (BAs 18, 19), left cuneus (BAs 29, 30, 31), and bilateral medioposterior thalamus (dorso-medial nucleus, pulvinar; Table 2). This pattern appeared to be an attenuated form of the pattern seen comparing depressed patients to healthy control subjects in that it included two main components, namely 1) anterior paral-imbic and prefrontal cortical absolute decreases, and 2) cerebellar, posterior cortical, and posterior thalamic nor-malized increases.
Direct comparison of the 14 bipolar I with the 29 bipolar II patients (covarying for age and gender) lacked significant differences in global or absolute regional me-tabolism but showed increased (higher in bipolar I) nor-malized metabolism in supragenual anterior cingulate (BA 32), right middle frontal gyrus (BA 9), and right inferior parietal lobule (BA 40) in the bipolar I patients (Table 3). Thus, comparison of bipolar I and II subgroups with one another lacked the cerebello-posterior cortical normalized metabolic increases seen when comparing these patient subgroups to healthy control subjects.
Table 2. Summary of rCMRglu in Bipolar Subgroups Compared to Healthy Control Subjects
Subgroup Cerebellum
Lingular
gyrus Cuneus
Thalamus
(DM, Pulv) Basal ganglia Temporal lobe
Frontal
lobe Other
17 BPdep 1Med;2Lata 1;2a — 1 1NA,Cd,Pu 1R Am;2Cxa 2Cxa 2IPLa
16 BPmild 61 1 1 — — 1Hi,L TTG;2R Cx 1L Cx 1L Ins
10 BPeu 1 1 1 — — — 1R IFG 1R Ins, R IPL
14 BPI 1;1a 1 1 — — — — —
29 BPII 61L 1L 1L 1 — 2R TPa 2R Cxa 2R Insa
35 Rapid 1 1 1 1 — — — —
8 Nonrapid 1 — — — — 1R Hi — —
43 All BP 1 1 1 1 — 1L TP, L Cx 1L IFG —
All data globally normalized exceptaabsolute. Note that all patient subgroups compared to control subjects have cerebello-posterior cortical normalized increases. DM,
dorsomedial nucleus; Pulv, pulvinar; Med, medial; Lat, lateral; BPdep, BPmild, BPeu, bipolar depressed, mildly depressed, euthymic; NA, accumbens; Cd, caudate; Pu, putamen; R, right; L, left; Am, amygdala; Cx, cortex; IPL, inferior parietal lobe; Hi, hippocampus; TTG, transverse temporal gyrus; Ins, insula; IFG, inferior frontal gyrus; TP, temporal pole.
Table 3. Summary of rCMRglu in Bipolar Subgroups Compared to One Another
Subgroups Cerebellum
Lingular
gyrus Cuneus
Thalamus (DM, Pulv)
Basal ganglia
Temporal lobe
Frontal
lobe Other
17 BPdep vs. 10 BPeu — 2 2 — 1NA,Cd,Pu — 2L MiFG, L IFG
1R Cx
2L IPL;2L IPLa
17 BPdep vs. 16 BPmild — 2;2a 2 — 1L Cd, L Pu 2L Hi, L TP 1R IFG,
1R MeFG, AC
2L Ins
16 Bpmild vs. 10 BPeu — — — — — — 1R MeFG,AC —
14 BPI vs. 29 BPII — — — — — — 1R MiFG, AC 1R IPL
35 Rapid vs. 8 nonrapid — — — — — 1MeFG, AC —
Normalized data exceptaabsolute. Note that no patient subgroups compared to one another have cerebellar differences. DM, dorsomedial nucleus; BPdep, BPeu, BPmild,
Rapid-Cycling and Non–Rapid-Cycling Subgroups
The 35 rapid cycling patients, compared with 35 control subjects, had nonsignificantly (3.6%) lower global metab-olism (7.26 6 0.92 vs. 7.53 6 1.03; Figure 1) and no differences in absolute but increased normalized (but not absolute) metabolism in bilateral cerebellum, lingular gyrus (BAs 18, 19), cuneus (BAs 29, 30, 31), and medioposterior thalamus (dorsomedial nucleus, pulvinar; Table 2).
The eight non–rapid-cycling patients, compared with eight control subjects, had similar global metabolism (7.7061.26 vs. 7.7860.72; Figure 1) and no differences in absolute but increased normalized (but not absolute) metabolism in bilateral cerebellum and right hippocampus (Table 2).
Direct comparison of the 35 rapid cycling and eight non–rapid-cycling patients (covarying for age and gender)
revealed no significant global difference but increased (higher in rapid cycling) normalized (but not absolute) metabolism in right greater than left medial frontal gyrus (BAs 8, 9, 10), and supragenual and pregenual anterior cingulate (BAs 24, 32; Table 3). Thus, comparison of rapid and non–rapid-cycling subgroups with one another lacked the cerebello-posterior cortical normalized meta-bolic increases seen when comparing these patient sub-groups to healthy control subjects.
All Patients
The heterogeneous group of all 43 bipolar patients, com-pared with 43 healthy control subjects, had nonsignifi-cantly (3.2%) lower global metabolism (7.34 6 0.99 vs. 7.58 6 0.96; Figure 1) and no significant absolute rCM-Rglu differences but increased normalized metabolism in bilateral cerebellum, lingular gyrus (BAs 18, 19), cuneus
(BAs 29, 30, 31), and medioposterior thalamus (dorsome-dial nucleus, pulvinar), as well as left temporal pole (BA 38), left middle (BA 21) and left inferior (BA 20) temporal gyri, and left inferior frontal gyrus (BAs 45, 46, 47; Table 2). Thus, comparison of all patients to healthy control subjects yielded cerebello-posterior cortical normalized metabolic increases seen with all comparisons of patient subgroups with healthy control subjects, but not with comparisons of patients subgroups with one another.
Discussion
We found that bipolar disorder patients in the depressed phase compared to healthy control subjects (and to a lesser extent compared to mildly depressed or euthymic patients) had decreased global and prefrontal and anterior paralim-bic cortical absolute (but not normalized) metabolism, and increased normalized metabolism in subcortical structures, including ventral striatum, thalamus, and right amygdala. This pattern was also evident in bipolar II patients com-pared to control subjects (Table 2, right) and in the degree of depression correlation but not in other patient subgroup versus control subject (Table 2, right) or patient versus patient subgroup (Table 3, right) comparisons, suggesting some specificity of this pattern to the depressed state.
Euthymic patients compared to control subjects had increased cerebello-posterior cortical (cerebellum, lingular gyrus, cuneus) normalized metabolism, with similar pat-terns (in some comparisons also involving thalamic in-creases) present in all patient subgroup versus control subject comparisons (Table 2, left) but not in patient versus patient subgroup comparisons (Table 3, left) or the degree of depression correlation. This is consistent with the notion that such cerebello-posterior cortical relative metabolic increases could represent a trait marker, which might be congenital, or a “scar” acquired over the course of many episodes. Unipolar patients may display this pattern in the depressed but not euthymic state, more consistent with a state marker (Kimbrell et al, unpublished data).
Our finding that global cerebral metabolism in bipolar disorder patients is decreased when depressed, but not when euthymic, is consistent with prior reports. Global cerebral metabolism was decreased in six reports of bipolar depression (Baxter et al 1985, 1989; Cohen et al 1992; Goyer et al 1992; Martinot et al 1990; Schwartz et al 1987), and in four studies (Kishimoto et al 1987; Kumar et al 1993; Raichle et al 1985; Schlegel et al 1989) of unipolar depression. One study reported increased global metabolism in bipolar depressed patients (Buchsbaum et al 1986). Also, global cerebral metabolism in hypomanic or euthymic bipolar patients did not differ from healthy control subjects but was increased compared to bipolar patients in depressed or mixed states (Schwartz et al
1987). In rapid-cycling bipolar patients, global cerebral metabolism (Baxter et al 1985) and blood flow (Speer et al 1997) oscillated as mood state changed. Taken together, these data are consistent with global cerebral metabolism being decreased in bipolar depression and varying across mood states; however, many factors could contribute to such a phenomenon. For example, plasma thyroid stimu-lating hormone levels may correlate inversely with global cerebral blood flow and metabolism in mood disorder patients (Marangell et al 1997).
The observed decrease in global cerebral metabolism in bipolar depression could confound findings in the normal-ized analysis, particularly for the subcortical normalnormal-ized increases, which could merely represent areas that failed to be decreased to the same extent as the global decrease. This is less of a concern for the finding of increased normalized cerebello-posterior cerebral metabolic in-creases, as these were evident in other subgroup compar-isons in which there was no significant global difference between patients and control subjects; however, even in the absence of global differences, increased normalized posterior activity in patients could be related to decreased anterior–posterior gradients.
The metabolic pattern we observed in depressed bipolar disorder patients compared to control subjects (and to a lesser extent compared to mildly depressed or euthymic patients, and in the correlation with degree of depression) of decreased prefrontal and anterior paralimbic cortical absolute metabolism, and increased subcortical (ventral striatum, thalamus, right amygdala) normalized metabo-lism implicates some of the classic neural substrates hypothesized to be involved in affective modulation in general, and bipolar illness in particular. Dysregulated function of basal ganglia– corticothalamic loops as de-scribed by Alexander and colleagues (Alexander et al 1986, 1990) could account for such complementary abso-lute cortical decreases and relative subcortical increases. Activation of the right amygdala has been associated with affective arousal, with increased activity occurring with both euphoric and dysphoric affects, as opposed to the left amygdala, in which activity tends to increase with sadness or fear and decrease with happiness or euphoria (George et al 1995; Ketter et al 1996a). In bipolar depression, we have thus observed relative activation of anterior paralim-bic subcortical regions classically linked to affective modulation (Ketter et al 1996b), such as amygdala, ac-cumbens, and ventral striatum.
a condition often considered more treatment-resistant than depressive disorders; however, decreased normalized basal ganglia and thalamic activity has been reported in some studies of bipolar disorder patients (Baxter et al 1985; Buchsbaum et al 1986, 1997; Cohen et al 1989). Variability in findings could be due to methodological differences, such as normalizing activity to posterior structures (Buchsbaum et al 1986), partial volume effects in view of the small size of these structures compared to cortical regions, the type of task performed during scan acquisition, or the highly treatment-resistant nature of our patient sample.
In contrast, depressed bipolar patients had absolute deactivation of prefrontal and anterior paralimbic cortical regions, including inferior, middle, superior, and medial frontal gyri, anterior and midcingulate, and superior, middle, and transverse temporal gyri. This is consistent with reports of decreased activity in such regions not only in bipolar depression (Baxter et al 1989; Buchsbaum et al 1984, 1986, 1997; Cohen et al 1989, 1992; Drevets et al 1997; Ebert et al 1993; Goyer et al 1992; Ketter et al 1996b; Martinot et al 1990; Post et al 1987; Schwartz et al 1987) but also in many studies of unipolar depression (Austin et al 1992; Baxter et al 1989; Bench et al 1992; Biver et al 1994; Curran et al 1993; Drevets et al 1997; Ebert et al 1991; Edmonstone et al 1994; Hagman et al 1990; Hurwitz et al 1990; Kanaya and Yonekawa 1990; Kimbrell et al, unpublished data; Kishimoto et al 1987; Kuhl et al 1985; Kumar et al 1993; Lesser et al 1994; Mayberg et al 1994; O’Connell et al 1989; Philpot et al 1993; Schlegel et al 1989; Upadhyaya et al 1990; Yazici et al 1992) and secondary depression (Bromfield et al 1992; Caparros-Lefebvre et al 1996; Mayberg et al 1990, 1991, 1992; Renshaw et al 1992; Ring et al 1994; Volkow et al 1991). This convergence suggests the possibility of a common pathway to depressive symptoms to some extent independent of illness etiology (primary vs. secondary) and subtype (unipolar vs. bipolar). A few studies have reported increased prefrontal and anterior paralimbic ac-tivity, perhaps due to distinctive phenomenologic, patho-physiologic, and treatment response characteristics of samples. For example, such increases have been noted in patients with familial pure depressive disease (Drevets et al 1992) and patients with subsequent antidepressant responses to sleep deprivation (Ebert et al 1991; Volk et al 1997; Wu et al 1992), fluoxetine (Mayberg et al 1997), and carbamazepine (Ketter et al 1999).
Depressed bipolar disorder patients also had increased normalized subcortical paralimbic metabolism, consistent with a limbic-cortical dysregulation model of depression, wherein dorsal neocortical hypofunction could lead to ventral paralimbic overactivity or vice versa (Mayberg 1997).
Posterior regions, compared to anterior regions, have been less emphasized in mood disorder models or imaging studies; however, the consistent increases we observed in cerebello-posterior cortical normalized metabolism sug-gest possible relevance to bipolar disorders as a trait marker, if it can be demonstrated in additional studies that these normalized posterior increases are not merely sec-ondary to absolute anterior cortical decreases.
The cerebellum, through limbic and brain stem connec-tions, may have a role in mood regulation (Berntson and Torello 1982; Haines et al 1984; Snider and Maiti 1976). Case reports and case series have noted affective symp-toms in patients with cerebellar pathology (Cutting 1976; Lauterbach 1996; Schmahmann and Sherman 1998; Stark-stein et al 1988; Yadalam et al 1985). Cerebellar electrode implantation and subsequent chronic cerebellar stimula-tion for neurologic disorders can yield decreased anxiety and improved mood (Riklan et al 1977) and has also been reported helpful in some patients with psychiatric (espe-cially depressive) disorders, although methodologic prob-lems have limited the utility of this approach (Heath et al 1981). Hence, a “cerebellar cognitive affective syndrome” due to disrupted cerebellar modulation of cerebello-pari-eto-temporo-limbic-prefrontal circuits has been proposed (Schmahmann and Sherman 1998).
In healthy volunteers, resting cerebellar (and brainstem) rCBF correlated with harm-avoidance (George et al 1994), and lateral cerebellar (and occipito-temporo-parietal) CBF increases appeared related to emotional responses to ex-teroceptive sensory (film) stimuli (Reiman et al 1997).
Cerebellar atrophy has been reported in mood disorders. Thus, in four of seven (DelBello et al 1999, Heath et al 1982, Lippmann et al 1982, and Nasrallah et al 1982 but not Coffman et al 1990, Dewan et al 1988 or Yates et al 1987) studies of bipolar, two of four (Escalona et al 1993 and Shah et al 1992 but not Pillay et al 1997 or Yates et al 1987) studies of unipolar, and one study (Weinberger et al 1982) of mood disorder patients, vermian or cerebellar atrophy tended to occur compared to healthy control subjects. Such changes could confound our functional cerebellar findings; however, such a confound would be expected to yield decreased activity due to the decreased volume, rather than the increased activity which we observed.
compared to euthymic patients had attenuated cognitive task-related rCBF changes in left cerebellum (and right orbitofrontal, right brainstem, and right medial thalamus) (Blumberg et al 1999).
The practice of normalizing regional data to activity in cerebellum (rather than in hemisphere, slice, or whole brain) in brain imaging studies of mood disorder patients (Amsterdam and Mozley 1992; Bonne et al 1996, 1999; Dube´ et al 1993; Jaracz et al 1996; Kanaya and Yonekawa 1990; Kocmur et al 1998; Mozley et al 1996; Vasile et al 1997) may thus need to be reconsidered. If cerebellar activity is increased in mood (and particularly in bipolar) disorder patients compared to healthy control subjects, then this referencing technique could exaggerate the de-gree of perceived hypofrontality in patients.
Bipolar II compared to bipolar I patients had somewhat greater CMRglu deficits. This could be related to multiple factors, such as bipolar II patients having numerically (but not statistically) higher proportions of subjects who were depressed (13/29 [45%] versus 4/14 [29%]) and rapid cycling (25/29 [86%] vs. 10/14 [71%]), and numerically (but not statistically) higher HRSD, duration, and number of medications failed. In addition, comparisons with con-trol subjects involving the 29 bipolar II patients had greater power than those involving the 14 bipolar I patients, owing to the larger sample size.
The data presented have a number of important limita-tions. Our sample is a highly treatment-resistant group of predominantly rapid-cycling (81%) bipolar disorder pa-tients who were referred to the NIMH, a tertiary center for clinical research studies, because of resistance to agents generally utilized in the community, including lithium and, more recently, carbamazepine and valproate (Frye et al 2000). As such, the abnormalities outlined could relate primarily to relatively late-stage, treatment-resistant, rap-id-cycling bipolar disorder patients, and determination whether these same abnormalities are evident earlier in illness course, in non–treatment-resistant, or in non–rapid-cycling patients requires further investigation. In addition, structural abnormalities in bipolar disorder patients, such as lateral ventricular enlargement and cerebellar atrophy, the use of stereotactic and global normalization, and partial volume effects could have confounded our findings.
Patients and control subjects were engaged in an audi-tory continuous performance task, which has the asset of occupying both patient and healthy control subjects with a similar set of mental operations, but may distract patients from negative affects or ruminations that are important components of the disorder, or introduce spurious meta-bolic changes in neural substrates not central to affective modulation or other aspects of cognitive–somatic function in bipolar illness.
Conversely, the data presented in this article have certain strengths. We have studied a relatively substantial number of bipolar disorder patients who have been med-ication-free for at least 2 weeks and monitored in a highly controlled environment. In contrast to some other reports, we assessed not only normalized but also absolute regional cerebral glucose utilization through the use of arterial cannulization. Depressed, mildly depressed, and euthymic patients were included in the analysis, giving preliminary insights into possible alterations related to both state and trait phenomena in these treatment-resistant bipolar disor-der patients.
In summary, in bipolar depression we found widespread anterior (prefrontal and temporal) cortical absolute hypo-metabolism, consistent with previous observations in pri-mary unipolar and secondary depression, suggesting a relationship to the depressed state, and a common pathway to depressive symptoms independent of illness etiology (primary vs. secondary) and subtype (unipolar vs. bipolar). Moreover, depressed bipolar disorder patients also had increased normalized subcortical (amygdala, accumbens, and ventral striatum) metabolism, consistent with a lim-bic– cortical dysregulation model of depression. In con-trast to the findings related to depression, we also observed normalized cerebello-posterior cortical hypermetabolism in all (including euthymic) patient subgroups compared to control subjects, but not in comparisons of patient sub-groups with one another, suggesting a possible trait abnormality for bipolar disorders. In addition, we noted increased thalamic normalized metabolism in several pa-tient versus control subject but no papa-tient versus papa-tient subgroup comparisons, suggesting basal ganglia–thalamo-cortical circuit dysfunction as a possible trait abnormality. Thus, depressed state and bipolar disorder trait may be the clinical phenomena with the greatest impact on scan patterns, appearing more robust than the effects of cycling pattern or bipolar subtype. Further studies are required to determine whether these putative state and trait patterns are replicated in bipolar disorder patients with shorter duration and less treatment-resistant illness, and using other behavioral and methodologic paradigms.
Support was received from the Stanley Foundation (TAKe, TAKi, MWW, AD).
References
Alexander GE, Crutcher MD, DeLong MR (1990): Basal gan-glia-thalamocortical circuits: Parallel substrates for motor, oculomotor, prefrontal and limbic functions. Prog Brain Res 85:119 –146.
organi-zation of functionally segregated circuits linking basal gan-glia and cortex. Annu Rev Neurosci 9:357–381.
Amsterdam JD, Mozley PD (1992): Temporal lobe asymmetry with iofetamine (IMP) SPECT imaging in patients with major depression. J Affect Disord 24:43–53.
Austin MP, Dougall N, Ross M, et al (1992): Single photon emission tomography with 99 m
Tc-exametazime in major depression and the pattern of brain activity underlying the psychotic/neurotic continuum. J Affect Disord 26:31– 43. Baxter LR Jr, Phelps ME, Mazziotta JC, et al (1985): Cerebral
metabolic rates for glucose in mood disorders. Studies with positron emission tomography and fluorodeoxyglucose F 18.
Arch Gen Psychiatry 42:441– 447.
Baxter LR Jr, Phelps ME, Mazziotta JC, et al (1987): Local cerebral glucose metabolic rates in obsessive-compulsive disorder. A comparison with rates in unipolar depression and in normal controls. Arch Gen Psychiatry 44:211–218. Baxter LR Jr, Schwartz JM, Phelps ME, et al (1989): Reduction
of prefrontal cortex glucose metabolism common to three types of depression. Arch Gen Psychiatry 46:243–250. Beck AT, Ward CH, Mendelson M, et al (1961): An inventory
for measuring depression. Arch Gen Psychiatry 4:561–571. Bench CJ, Friston KJ, Brown RG, et al (1992): The anatomy of
melancholia—focal abnormalities of cerebral blood flow in major depression. Psychol Med 22:607– 615.
Berntson GG, Torello MW (1982): The palleocerebellum and the integration of behavioral function. Physiol Psychol 10:2–12. Biver F, Goldman S, Delvenne V, et al (1994): Frontal and parietal metabolic disturbances in unipolar depression. Biol
Psychiatry 36:381–388.
Blumberg HP, Stern E, Ricketts S, et al (1999): Rostral and orbital prefrontal cortex dysfunction in the manic state of bipolar disorder. Am J Psychiatry 156:1986 –1988.
Bonne O, Krausz Y, Aharon Y, et al (1999): Clinical doses of fluoxetine and cerebral blood flow in healthy volunteers.
Psychopharmacology (Berl) 143:24 –28.
Bonne O, Krausz Y, Gorfine M, et al (1996): Cerebral hypoper-fusion in medication resistant, depressed patients assessed by Tc99 m HMPAO SPECT. J Affect Disord 41:163–171. Bromfield EB, Altshuler L, Leiderman DB, et al (1992): Cerebral
metabolism and depression in patients with complex partial seizures. Arch Neurol 49:617– 623.
Buchsbaum MS, Cappelletti J, Ball R, et al (1984): Positron emission tomographic image measurement in schizophrenia and affective disorders. Ann Neurol 15:S157–S165. Buchsbaum MS, Someya T, Wu J, et al (1997): Neuroimaging
bipolar illness with positron emission tomography and mag-netic resonance imaging. Psychiatr Ann 27:489 – 495. Buchsbaum MS, Wu J, DeLisi LE, et al (1986): Frontal cortex
and basal ganglia metabolic rates assessed by positron emis-sion tomography with [18
F]2-deoxyglucose in affective ill-ness. J Affect Disord 10:137–152.
Bunney WE, Hamburg DA (1963): Methods for reliable longitudi-nal observation of behavior. Arch Gen Psychiatry 9:280 –294. Caparros-Lefebvre D, Girard-Buttaz I, Reboul S, et al (1996):
Cognitive and psychiatric impairment in herpes simplex virus encephalitis suggest involvement of the amygdalo-frontal pathways. J Neurol 243:248 –256.
Coffman JA, Bornstein RA, Olson SC, et al (1990): Cognitive impairment and cerebral structure by MRI in bipolar disorder.
Biol Psychiatry 27:1188 –1196.
Cohen RM, Gross M, Nordahl TE, et al (1992): Preliminary data on the metabolic brain pattern of patients with winter seasonal affective disorder. Arch Gen Psychiatry 49:545–552. Cohen RM, Semple WE, Gross M, et al (1989): Evidence for
common alterations in cerebral glucose metabolism in major affective disorders and schizophrenia.
Neuropsychopharma-cology 2:241–254.
Curran SM, Murray CM, Van Beck M, et al (1993): A single photon emission computerised tomography study of regional brain function in elderly patients with major depression and with Alzheimer-type dementia. Br J Psychiatry 163:155–165. Cutting JC (1976): Chronic mania in childhood: Case report of a possible association with a radiological picture of cerebellar disease. Psychol Med 6:635– 642.
DelBello MP, Strakowski SM, Zimmerman ME, et al (1999): MRI analysis of the cerebellum in bipolar disorder: A pilot study. Neuropsychopharmacology 21:63– 68.
Dewan MJ, Haldipur CV, Lane EE, et al (1988): Bipolar affective disorder. I. Comprehensive quantitative computed tomography. Acta Psychiatr Scand 77:670 – 676.
Dolan RJ, Bench CJ, Brown RG, et al (1992): Regional cerebral blood flow abnormalities in depressed patients with cognitive impairment. J Neurol Neurosurg Psychiatry 55:768 –773. Drevets WC, Price JL, Simpson JR Jr, et al (1997): Subgenual
prefrontal cortex abnormalities in mood disorders. Nature 386:824 – 827.
Drevets WC, Videen TO, Price JL, et al (1992): A functional anatomical study of unipolar depression. J Neurosci 12:3628 – 3641.
Dube´ S, Dobkin JA, Bowler KA, et al (1993): Cerebral perfusion changes with antidepressant response in major depression.
Biol Psychiatry 33(6A):47A.
Ebert D, Feistel H, Barocka A (1991): Effects of sleep depriva-tion on the limbic system and the frontal lobes in affective disorders: A study with Tc-99 m-HMPAO SPECT.
Psychia-try Res 40:247–251.
Ebert D, Feistel H, Barocka A, et al (1993): A test-retest study of cerebral blood flow during somatosensory stimulation in depressed patients with schizophrenia and major depression.
Eur Arch Psychiatry Clin Neurosci 242:250 –254.
Edmonstone Y, Austin MP, Prentice N, et al (1994): Uptake of
99 m
Tc-exametazime shown by single photon emission puterized tomography in obsessive-compulsive disorder com-pared with major depression and normal controls. Acta
Psychiatr Scand 90:298 –303.
Endicott J, Spitzer RL (1978): A diagnostic interview: The schedule for affective disorders and schizophrenia. Arch Gen
Psychiatry 35:837– 844.
Escalona PR, Early B, McDonald WM, et al (1993): Reduction of cerebellar volume in major depression: A controlled MRI study. Depression 1:156 –158.
Friston KJ, Frith CD, Liddle PF, et al (1990): The relationship between global and local changes in PET scans. J Cereb
Blood Flow Metab 10:458 – 466.
Friston KJ, Worsley KJ, Frackowiak RS, et al (1994): Assessing the significance of focal activations using their spatial extents.
Hum Brain Mapp 1:210 –220.
Frye MA, Ketter TA, Leverich GS, et al (2000): The increasing use of polypharmacotherapy for refractory mood disorders: 22 years of study. J Clin Psychiatry 61:9 –15.
George MS, Ketter TA, Parekh PI, et al (1994): Personality traits correlate with resting rCBF. In: American Pychiatric
Associ-ation 1994 Annual Meeting New Research Abstracts.
Wash-ington, DC: American Psychiatric Association, 173. George MS, Ketter TA, Parekh PI, et al (1995): Brain activity
during transient sadness and happiness in healthy women.
Am J Psychiatry 152:341–351.
Goyer PF, Schulz PM, Semple WE, et al (1992): Cerebral glucose metabolism in patients with summer seasonal affec-tive disorder. Neuropsychopharmacology 7:233–240. Hagman JO, Buchsbaum MS, Wu JC, et al (1990): Comparison
of regional brain metabolism in bulimia nervosa and affective disorder assessed with positron emission tomography. J Affect
Disord 19:153–162.
Haines DE, Dietrichs E, Sowa TE (1984): Hypothalamo-cerebellar and cerebello-hypothalamic pathways: A review and hypothesis concerning cerebellar circuits which may influence autonomic centers affective behavior. Brain Behav Evol 24:198 –220. Hamilton M (1960): A rating scale for depression. J Neurol
Neurosurg Psychiatry 12:56 – 62.
Heath RG, Franklin DE, Walker CF, Keating JW Jr (1982): Cerebellar vermal atrophy in psychiatric patients. Biol
Psy-chiatry 17:569 –583.
Heath RG, Rouchell AM, Llewellyn RC, Walker CF (1981): Cerebellar pacemaker patients: An update. Biol Psychiatry 16:953–962.
Hurwitz TA, Clark C, Murphy E, et al (1990): Regional cerebral glucose metabolism in major depressive disorder. Can J
Psy-chiatry 35:684 – 688.
Jaracz J, Rajewski A, Junik R, et al (1996): The assessment of regional cerebral blood flow using HMPAO-SPECT during depressive episode and in remission. Psychiatr Pol 30:757–769. Kanaya T, Yonekawa M (1990): Regional cerebral blood flow in
depression. Jpn J Psychiatry Neurol 44:571–576.
Ketter TA, Andreason PJ, George MS, et al (1996a): Anterior paralimbic mediation of procaine-induced emotional and psychosensory experiences. Arch Gen Psychiatry 53:59 – 69. Ketter TA, George MS, Andreason PJ, et al (1994): RCMRglu in unipolar versus bipolar depression. In: American Psychiatric
Association 1994 Annual Meeting New Research Abstracts.
Washington, DC: American Psychiatric Association, 172. Ketter TA, George MS, Kimbrell TA, et al (1996b): Functional
brain imaging, limbic function, and affective disorders.
Neu-roscientist 2:55– 65.
Ketter TA, Kimbrell TA, George MS, et al (1999): Baseline cerebral hypermetabolism associated with carbamazepine response, and hypometabolism with nimodipine response in mood disorders. Biol Psychiatry 46:1364 –1374.
Kishimoto H, Takazu O, Ohno S, et al (1987): 11
C-Glucose metabolism in manic and depressed patients. Psychiatry Res 22:81– 88.
Kocmur M, Milcinski M, Budihna NV (1998): Evaluation of brain
perfusion with technetium-99 m bicisate single-photon emission tomography in patients with depressive disorder before and after drug treatment. Eur J Nucl Med 25:1412–1414.
Kuhl DE, Metter EJ, Riege WH (1985): Patterns of cerebral glucose utilization in depression, multiple infarct dementia, and Alzheimer’s disease. In: Sokoloff L, editor. Brain
Imag-ing and Brain Function, Vol 63. New York: Raven, 211–226.
Kumar A, Braun A, Schapiro M, et al (1992): Cerebral glucose metabolic rates after 30 and 45 minute acquisitions: A comparative study. J Nucl Med 33:2103–2105.
Kumar A, Newberg A, Alavi A, et al (1993): Regional cerebral glucose metabolism in late-life depression and Alzheimer disease: A preliminary positron emission tomography study.
Proc Natl Acad Sci U S A 90:7019 –7023.
Lauterbach EC (1996): Bipolar disorders, dystonia, and compul-sion after dysfunction of the cerebellum, dentatorubrotha-lamic tract, and substantia nigra. Biol Psychiatry 40:726 –730. Lesser IM, Mena I, Boone KB, et al (1994): Reduction of cerebral blood flow in older depressed patients. Arch Gen
Psychiatry 51:677– 686.
Leverich GS, Post RM (1996): Life charting the course of bipolar disorder. Curr Rev Mood Anxiety Disord 1:48 – 61.
Leverich GS, Post RM (1998): Life charting of affective disor-ders. CNS Spectrums 3:21–37.
Lippmann S, Manshadi M, Baldwin H, et al (1982): Cerebellar vermis dimensions on computerized tomographic scans of schizophrenic and bipolar patients. Am J Psychiatry 139:667– 668.
Little JT, Ketter TA, Kimbrell TA, et al (1997): Anterior paralimbic blood flow decreased after venlafaxine response.
Biol Psychiatry 41(suppl 7S):79S– 80S.
Loeber RT, Sherwood AR, Renshaw PF, et al (1999): Differ-ences in cerebellar blood volume in schizophrenia and bipolar disorder. Schizophr Res 37:81– 89.
Marangell LB, Ketter TA, George MS, et al (1997): Inverse relationship of peripheral thyrotropin-stimulating hormone levels to brain activity in mood disorders. Am J Psychiatry 154:224 –230.
Martinot JL, Hardy P, Feline A, et al (1990): Left prefrontal glucose hypometabolism in the depressed state: A confirma-tion. Am J Psychiatry 147:1313–1317.
Mayberg HS (1997): Limbic-cortical dysregulation: A proposed model of depression. J Neuropsychiatry Clin Neurosci 9:471– 481.
Mayberg HS, Brannan SK, Mahurin RK, et al (1997): Cingulate function in depression: A potential predictor of treatment response. Neuroreport 8:1057–1061.
Mayberg HS, Lewis PJ, Regenold W, Wagner HN Jr (1994): Paralimbic hypoperfusion in unipolar depression. J Nucl Med 35:929 –934.
Mayberg HS, Starkstein SE, Morris PL, et al (1991): Remote cortical hypometabolism following focal basal ganglia injury: Relationship to secondary changes in mood. Neurology 41:266. Mayberg HS, Starkstein SE, Peyser CE, et al (1992): Paralimbic frontal lobe hypometabolism in depression associated with Huntington’s disease. Neurology 42:1791–1797.
Mozley PD, Hornig-Rohan M, Woda AM, et al (1996): Cerebral HMPAO SPECT in patients with major depression and healthy volunteers. Prog Neuropsychopharmacol Biol
Psy-chiatry 20:443– 458.
Nasrallah HA, McCalley-Whitters M, Jacoby CG (1982): Corti-cal atrophy in schizophrenia and mania: A comparative CT study. J Clin Psychiatry 43:439 – 441.
O’Connell RA, Van Heertum RL, Billick SB, et al (1989): Single photon emission computed tomography (SPECT) with [123I]IMP in the differential diagnosis of psychiatric disor-ders. J Neuropsychiatry Clin Neurosci 1:145–153.
Philpot MP, Banerjee S, Needham-Bennett H, et al (1993): 99 mTc-HMPAO single photon emission tomography in late life
depression: A pilot study of regional cerebral blood flow at rest and during a verbal fluency task. J Affect Disord 28:233–240. Pillay SS, Yurgelun-Todd DA, Bonello CM, et al (1997): A
quantitative magnetic resonance imaging study of cerebral and cerebellar gray matter volume in primary unipolar major depression: Relationship to treatment response and clinical severity. Biol Psychiatry 42:79 – 84.
Post RM, DeLisi LE, Holcomb HH, et al (1987): Glucose utilization in the temporal cortex of affectively ill patients: Positron emission tomography. Biol Psychiatry 22:545–553. Raichle ME, Taylor JR, Herscovitch P, Guze SB (1985): Brain circulation and metabolism in depression. In: Greitz T, Ingvar DH, Widen L, editors. The Metabolism of the Human Brain
Studied with Positron Emission Tomography. New York:
Raven, 453– 456.
Reiman EM, Lane RD, Ahern GL, et al (1997): Neuroanatomical correlates of externally and internally generated human emo-tion. Am J Psychiatry 154:918 –925.
Renshaw PF, Johnson KA, Worth JL, et al (1992): New onset depression in patients with AIDS dementia complex (ADC) is associated with frontal lobe perfusion defects on HMPAO-SPECT scan. In: American College of
Neuropsychopharma-cology Scientific Abstracts 1992. Nashville: American
Col-lege of Neuropsychopharmacology, 94.
Riklan M, Cullinan T, Cooper IS (1977): Tension reduction and alerting in man following chronic cerebellar stimulation for the relief of spasticity or intractable seizures. J Nerv Ment Dis 164:176 –181.
Ring HA, Bench CJ, Trimble MR, et al (1994): Depression in Parkinson’s disease. A positron emission study. Br J
Psychi-atry 165:333–339.
Schlegel S, Aldenhoff JB, Eissner D, et al (1989): Regional cerebral blood flow in depression: Associations with psycho-pathology. J Affect Disord 17:211–218.
Schmahmann JD, Sherman JC (1998): The cerebellar cognitive affective syndrome. Brain 121:561–579.
Schwartz JM, Baxter LR Jr, Mazziotta JC, Gerner RH, Phelps ME (1987): The differential diagnosis of depression.
Rele-vance of positron emission tomography studies of cerebral glucose metabolism to the bipolar-unipolar dichotomy. JAMA 258:1368 –1374.
Shah SA, Doraiswamy PM, Husain MM, et al (1992): Posterior fossa abnormalities in major depression: A controlled magnetic resonance imaging study. Acta Psychiatr Scand 85:474 – 479. Snider RS, Maiti A (1976): Cerebellar contributions to the Papez
circuit. J Neurosci Res 2:133–146.
Speer AM, Upadhyaya VH, Bohning DE, et al (1997): New windows into bipolar illness: Serial perfusion MRI scanning in rapid-cycling bipolar patients. In: American Psychiatric
Association 1997 Annual Meeting New Research Abstracts.
Washington, DC: American Psychiatric Association, 111– 112.
Starkstein SE, Robinson RG, Berthier ML, Price TR (1988): Depressive disorders following posterior circulation as com-pared with middle cerebral artery infarcts. Brain 111:375–387. Upadhyaya AK, Abou-Saleh MT, Wilson K, et al (1990): A study of depression in old age using single-photon emission computerised tomography. Br J Psychiatry Suppl 157:76 – 81. Vasile RG, Sachs G, Anderson JL, et al (1997): Changes in regional cerebral blood flow following light treatment for seasonal affective disorder: Responders versus nonre-sponders. Biol Psychiatry 42:1000 –1005.
Volk SA, Kaendler SH, Hertel A, et al (1997): Can response to partial sleep deprivation in depressed patients be predicted by regional changes of cerebral blood flow? Psychiatry Res 75:67–74. Volkow ND, Fowler JS, Hitzemann R, Wolf AP (1991): Abnor-mal dopamine brain activity in cocaine abusers. In: American
College of Neuropsychopharmacology Scientific Abstracts 1991. Nashville: American College of
Neuropsychopharma-cology, 30.
Weinberger DR, DeLisi LE, Perman GP, et al (1982): Computed tomography in schizophreniform disorder and other acute psychiatric disorders. Arch Gen Psychiatry 39:778 –783. Wu JC, Gillin JC, Buchsbaum MS, et al (1992): Effect of sleep
deprivation on brain metabolism of depressed patients. Am J
Psychiatry 149:538 –543.
Yadalam KG, Jain AK, Simpson GM (1985): Mania in two sisters with similar cerebellar disturbance. Am J Psychiatry 142:1067–1069.
Yates WR, Jacoby CG, Andreasen NC (1987): Cerebellar atro-phy in schizophrenia and affective disorder. Am J Psychiatry 144:465– 467.
Yazici KM, Kapucu O, Erbas B, et al (1992): Assessment of changes in regional cerebral blood flow in patients with major depression using the99 m
Tc-HMPAO single photon emission tomography method. Eur J Nucl Med 19:1038 –1043. Young RC, Biggs JT, Ziegler VE, Meyer DA (1978): A rating
scale for mania: Reliability, validity and sensitivity. Br J