www.elsevier.nlrlocateraqua-online
The use of allozymes and shell morphology to
distinguish among sympatric species of the rock
oyster Saccostrea in Thailand
A.J. Day
a,), A.J.S. Hawkins
a, P. Visootiviseth
ba
Plymouth Marine Laboratory, Prospect Place, Plymouth, PL 1 3DH, UK
b
Faculty of Science, Mahidol UniÕersity, Rama VI Rd., Phyathai, Bangkok 10400, Thailand
Accepted 22 December 1999
Abstract
Three hundred and fifty-five Saccostrea oysters from 12 sites throughout Thailand were scored
Ž .
for allozyme variation at eight enzyme loci Aat-1, Ap, Est-2, Lap, Mdh-1, Mpi, Pgi and Pgm .
Allelic variation within Lap, Pgi, Pgm and Mpi loci was concordant. Principle component
Ž . Ž .
analysis PCA of these four loci identified two principal components PC1 and PC2 that resolved individuals into three discrete clusters corresponding to different species. Oysters were assigned to different species by diagnostic alleles at Lap, Mpi and Pgi loci, and correct identification confirmed by a comparison of observed genotype frequencies in putative single-species samples with those expected under Hardy–Weinberg equilibrium. We identified one of these species as
Saccostrea commercialis, based on identical mobility’s at all eight loci to a reference sample of
that species from Australia. The other two species we identified as S. cucullata and S. manilai by comparison of relative allozyme mobility’s and shell morphology traits with data published for these species. S. commercialis and S. manilai were found in sympatry in coastal and estuarine sites throughout the Gulf of Thailand. S. cucullata was restricted to offshore islets.
Ten measurements were made on the shells of a subset of oysters from seven sites. Observations were also made of adductor scar colour and chomata spacing. Principal component analysis of shell morphometrics of ninety oysters identified by allozymes revealed three principal components that varied between species. These reflected variation in overall size, degree of ‘‘cupping’’ of left valve, and relative size of the umbo cavity. The most useful character for species identification was the size of the umbo cavity, which was large in S. cucullata and S.
)Corresponding author. Tel.:q44-1752-633-100; fax:q44-1752-633-101.
Ž .
E-mail address: [email protected] A.J. Day .
0044-8486r00r$ - see front matterq2000 Elsevier Science B.V. All rights reserved.
Ž .
( )
A.J. Day et al.rAquaculture 187 2000 51–72
52
commercialis, but almost non-existent in S. manilai. Mean umbo depths were 1.49 cm for S. cucullata, 0.7 cm for S. commercialis and 0.42 cm for S. manilai. Colour of the adductor scar was
also of taxonomic value, with 75% of S. cucullata having black scars, while scars were white or brown in the other two species.q2000 Elsevier Science B.V. All rights reserved.
Keywords: Saccostrea; Shell morphology; Taxonomy; Thailand
1. Introduction
Rock oysters of the genus Saccostrea are widely distributed around the coast of Thailand occurring both offshore and in near-shore brackish environments on substrates that vary from rocks to the stilt roots of mangroves. In spite of the diverse habitats that these oysters occupy and their highly variable shell morphology, most populations have been thought to be a single species. However, authors have disagreed whether to call
Ž . Ž
this species Saccostrea cucullata Born Amornjaruchit, 1988; Yusuk, 1988;
Natee-. Ž .
wathana, 1995; Sanpanich, 1998 or S. commercialis Iredale and Roughley
ŽBrohmanonda et al., 1988; Tookwina, 1991 . Two other species, S. echinata Quoy and. Ž
. Ž .
Gaimard and S. mordax Gould , have also been included in species lists for offshore
Ž . Ž
islands in the Andaman Sea Nielsen, 1976 and the Gulf of Thailand Bussarawit,
.
1995 , respectively. The identification of these species is also problematic as a number of authors consider S. mordax and S. echinata to be synonyms for S. cucullata
ŽThomson, 1954; Morton and Morton, 1983 ..
Saccostrea species are grown commercially so that incorrect identification of species
has economic implications. Culture of rock oysters in Thailand has relied almost entirely upon natural spatfall. However, oyster harvests have declined in recent years, and this
Ž
decline has been attributed to a shortage of spat Jarayabhand and Thavornyutikarn,
.
1995 . One of the responses to this perceived shortfall was the introduction in 1985 of a programme of selective breeding on rock oysters that were presumed to be S. cucullata
ŽJarayabhand and Thavornyutikarn, 1995 . Such programmes could well fail if brood-.
stock are not conspecific. Transplantation of rock oysters has also been used to re-stock
Ž .
culture areas Musig, 1987 . If environmental conditions are not appropriate for the introduced oysters, heavy mortalities and low yields may result. For example, S.
commercialis thrives in estuarine environments whereas most other Saccostrea species
including S. cucullata require fully marine conditions. Correct selection of oysters for conditions prevailing at culture sites necessarily depends on their correct identification. Allozyme electrophoresis is often effective at identifying shellfish. For example, use of allozymes allowed recognition of a previously unknown sibling species of S.
Ž .
malabonensis from the Philippines Buroker et al., 1979b . However, it is relatively
2. Materials and methods
2.1. Sampling
Ž
Samples of Saccostrea oysters as defined by the possession of chomata, Stenzel,
.
1971 were collected from 12 sites in six provinces throughout Thailand during
Ž .
September 1995 and April 1996 Table 1 . All samples came from natural populations, where they were collected from a single rock or from within an area of less than 4 m2. The exception to this rule was the sample from Ko Samet, where due to low numbers,
Ž .
oysters were collected from approximately 50 m of shoreline. Fig. 1, Table 2 . Within 4 h of collection, the adductor muscle was excised from each oyster and stored in liquid nitrogen for subsequent allozyme electrophoresis. Shells were retained for morphometry from a subset of seven locations which included two sites from Chumphon and one site
Ž .
from each of Trat, Chon Buri and Surat Thani in the Gulf of Thailand , and Trang and
Ž . Ž .
Satun in the Andaman Sea Table 2 . All shells were cleaned of remaining tissues, and any that had been damaged by their removal from the substrate discarded.
2.2. Electrophoresis
Tissue samples were homogenised in 75 ml of 0.05 M Tris–HCl pH 7.0
contai-Ž .
ning 20% dimethyl sulphoxide DMSO , and stored at y708C prior to starch-gel electrophoresis. When two or more zones of activity were visible for a single enzyme, loci were numbered according to mobility such that for a particular enzyme a locus la-belled — 2 would migrate further towards the anode than a locus lala-belled — 1. In practise, for each enzyme with multiple loci, one locus consistently stained for more
Table 1
Abundance of three Saccostrea speciesa in samples collected from sites throughout Thailand in 1995 and
1996, which were used for analysis of allozymes
b
Site no Site Name S. commercialis S. manilai S. cuccullata Hybrids
Ž .n Ž .n Ž .n Ž .n
Resolved into species by allozyme variation at three marker loci, Lap, Pgi and Mpi.
b
( )
A.J. Day et al.rAquaculture 187 2000 51–72
54
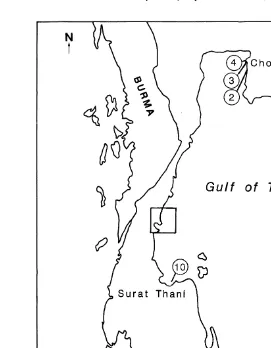
Fig. 1. Locations of sites sampled in Thailand in 1995 and 1996 for species of Saccostrea.
individuals than the others. We include data only for these ‘‘reliable’’ loci. Allelic
Ž .
variation was scored at eight enzyme loci, aspartate aminotransferase Aat-1 , esterase
ŽEst-2, utilising fluorescent stain , leucine aminopeptidase Lap , malate dehydrogenase. Ž .
ŽMdh-1 , mannose phosphate isomerase. ŽMpi , peptidase. ŽAp, substrate gly–leu ,.
Ž . Ž .
phospho-glucose isomerase Pgi and phospho-glucose mutase Pgm . All enzyme loci
Ž .
Table 2
Sample sizes of Saccostrea spp collected from sites throughout Thailand in 1995 and 1996, which were used for analysis of allozymes and morphology
Site no Sea Province Site Name Allozymes Morphology
Ž .n Ž .n
1 Gulf of Thailand Trat Ko Chang 31 12
2 Chon Buri Ban Si Racha 21 6
3 Chon Buri Bang Saen 1. 44 –
4 Chon Buri Bang Saen 2. 28 –
5 Chumphon Ko Samet 40 –
6 Chumphon Ban Sam Saeb 24 –
7 Chumphon Ban Pak Nam 26 18
8 Chumphon Ko Jorakae 19 –
9 Chumphon Ko Talu 37 21
10 Surat Thani Ko Prab 42 18
11 Andaman Sea Satun Ko Patra 22 13
12 Trang Ban Kantang 21 8
from Australia. One sample was purchased from a commercial hatchery in Sydney the other sample came from a natural population on Magnetic Island in Queensland. We do not follow the numbering system for loci or alleles that was used for Saccostrea species
Ž .
by Buroker et al. 1979b . This study used different buffer systems, including different substrates and tissues for certain loci. Therefore, we cannot be certain of homology of
Ž .
alleles or loci with Buroker et al. 1979b . Alleles were labelled 1, 2, 3 etc. in order of increasing mobility considering all individuals together. The presence of more than one
Saccostrea species in our samples was evident by the association within individuals of
allelic variation at four loci, Lap, Mpi, Pgm and Pgi. Forty-eight tests for deviations of
Ž .
genotypes from Hardy–Weinberg expectations HWE were carried out for these marker loci within the original 12 samples to identify those that were mixtures of different species. The large number of alleles present at these loci necessitated the pooling of rare
Ž .
alleles to avoid low expected numbers of genotypes with dfsn ny1r2, where n is
Ž .
equal to the number of alleles after pooling Pamilo and Varvio-Aho, 1984 . Signifi-cance levels were adjusted for the number of tests using the sequential Bonferroni
Ž .
method of Hochberg 1988 .
Ž .
A principal component analysis PCA was carried out on all alleles at the putative marker loci, Lap, Mpi, Pgi and Pgm, to identify those most useful for distinguishing between taxa. For all individuals, the presence or absence of each allele at these loci was
Ž .
scored as 0 or 1 McDonald et al., 1991 .
2.3. Morphological analyses
For each individual, the colour of the adductor muscle scar was noted as either black
Ž .1 or other colour 2 , and arrangement of chomata as complete 1 or incomplete 2 .Ž . Ž . Ž .
Measurements of 10 quantitative characters were made using a vernier caliper that was
Ž . Ž . Ž .
( )
A.J. Day et al.rAquaculture 187 2000 51–72
56
Ž
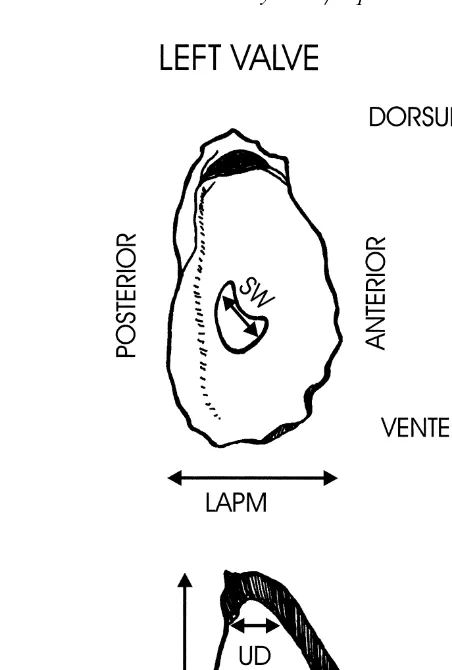
Fig. 2. Morphological measurements made on shells of Saccostrea spp from Thailand. Note LTRT, which is
.
not illustrated in the total depth of shell with both valves fitted together .
Žcupped valve L were; anterior–posterior RAPM, LAPM and dorsal–ventral RDVM,. Ž . Ž . Ž .
LDVM measurements of each valve, and the depth of each valve when laid on a flat
Ž .
surface RT, LT . Measurements taken on the left valve only included the umbo depth
Ž .
measured as the depth of the shell from the middle of the hinge plate UD , and width of
Ž . Ž .
the adductor muscle scar SW . The length of the hinge plate HL was measured on the right valve. In addition, the overall depth of both valves fitted together was measured
ŽLTRT ..
The power of morphometrics to distinguish between species was tested for by
Ž .
ANOVA and PCA. Stepwise discriminant analysis SDA was used both on the original raw data and on principal components to determine those morphological measurements, which were most successful at classifying individuals to species. All statistical analyses
Ž .
3. Results
3.1. Assignment of indiÕiduals to species types
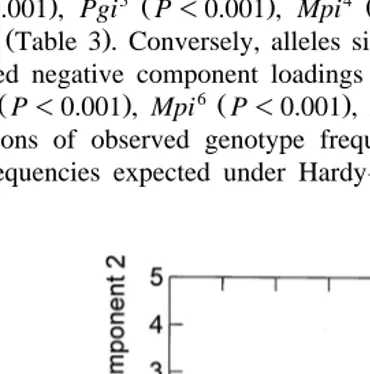
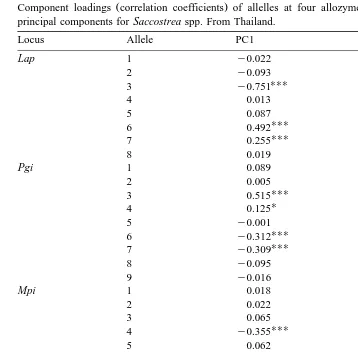
PCA of allelic variation at the Lap, Pgi, Pgm and Mpi loci generated 10 principal components. Plots of all principal components against one another revealed that PC1 and
Ž
PC2 together resolved individuals into three discrete clusters Fig. 3; boundaries represent 95% confidence intervals which were plotted after assigning individuals to
.
species, see below . PC1 explained 21.7% of the total genetic variance and described differences between two groups of oysters that we labelled ‘P’ and ‘B’. Alleles significantly correlated with PC1 for group ‘P’ possessed positive component loadings
6 Ž . 7 Ž . 3 Ž . 4 Ž .
and were Lap P-0.001 , Lap P-0.001 , Pgi P-0.001 , Pgi P-0.05 ,
7 Ž . 4 Ž . Ž .
Mpi P-0.05 and Pgm P-0.001 Table 3 . Conversely, alleles significantly correlated with PC1 for group ‘B’ possessed negative component loadings, and were
3 Ž . 6 Ž . 7 Ž . 4 Ž . 6
Lap P-0.001 , Pgi P-0.001 , Pgi P-0.001 , Mpi P-0.001 , Pgm
ŽP-0.001 and Pgm. 7ŽP-0.001 . PC2 explained 16.9% of the total genetic variance. and split group ‘P’ into two subgroups ‘A’ and ‘C’. Alleles significantly correlated with
6 Ž .
PC2 for group ‘A’ possessed positive component loadings and were Lap P-0.001 ,
4 Ž . 5 Ž . 4 Ž . 3 Ž . 4
Pgi P-0.001 , Pgi P-0.001 , Mpi P-0.001 , Pgm P-0.05 and Pgm
ŽP-0.001. ŽTable 3 . Conversely, alleles significantly correlated with PC2 for group.
7 Ž . 1 Ž
‘C’ possessed negative component loadings and were Lap P-0.001 , Pgi P
-. 3 Ž . 6 Ž . 8 Ž . 7 Ž .
0.01 , Pgi P-0.001 , Mpi P-0.001 , Mpi P-0.001 and Pgm P-0.001 . Comparisons of observed genotype frequencies in our original 12 samples with
Ž .
genotype frequencies expected under Hardy–Weinberg equilibrium HWE identified
( )
A.J. Day et al.rAquaculture 187 2000 51–72
58 Table 3
Ž .
Component loadings correlation coefficients of allelles at four allozyme loci with taxonomically useful principal components for Saccostrea spp. From Thailand.
Locus Allele PC1 PC2
samples from three sites which were mixtures of ‘A’, ‘B’ or ‘C’. Significant deviations
Ž
from HWE were observed for all four loci in sample five from Chumphon Lap, 0.001;
.
Pgi, P-0.05; Pgm, P-0.01; Mpi, P-0.01 , for the Lap locus alone in sample six
Ž . Ž .
Examination of genotypes within samples that were in Hardy–Weinberg equilibrium revealed that alleles Lap1, Lap2 and Lap3 co-occurred within samples 4 and 7, which lacked any of Lap fast alleles 6–8. The absence of ‘P’ alleles at the Pgi locus
Ž 1 3. Ž .
Pgi –Pgi identified by PCA confirmed that these samples were monomorphic for
species ‘B’. Conversely, only Lap alleles 4–8 were present in ‘P’ samples 2, 8, 9, 11
Ž 7 9.
and 12. Pgi alleles unique to the ‘B’ species Pgi –Pgi were absent from all these samples. Samples two and three, which were also in Hardy–Weinberg equilibrium, consisted predominantly of species ‘B’, but included three and two individuals respec-tively of ‘P’ type. Lap4 and Lap5 were found at frequencies of )0.1 in both ‘B’ and ‘P’ samples, as were Pgi4, Pgi5and Pgi6, and therefore were regarded as non-diagnos-tic.
We identified individuals in mixed samples as species ‘B’ if they possessed only
Lap1–Lap3, Pgi7–Pgi9 and non-diagnostic alleles at these two loci. Two hybrids were found after sorting for ‘B’ species as described above. One individual from sample one
ŽTrat province was heterozygous for ‘B’ and ‘P’ alleles at the Lap locus a 3. Ž r6
. Ž .
heterozygote . The other hybrid from sample six Surat Thani province possessed a ‘B’ allele at the Lap locus, being a 2r4 heterozygote, while at the same time possessing a ‘P’ allele at the Pgi locus, being a 3r5 heterozygote. The presence of ‘‘non-diagnostic’’ alleles such as Pgi4 – 5, Lap4 – 5 and Mpi1 – 5, that can be found in two or more species prevented the further classification of hybrids. When non-diagnostic alleles occurred at all marker loci for a given individual, identification of any kind was impossible. In sample ten, there were four individuals that fell into this category.
The next step in classifying remaining individuals was an examination of genotype frequencies within ‘P’ samples that were in HWE. Alleles for the Lap, Mpi, Pgi and
Pgm loci that were identified from PCA analysis as being markers for species ‘C’ were
common in samples eight and nine while markers for species ‘A’ were common in
Ž .
samples 2, 11 and 12 refer Table 3 . However, only Mpi alleles were restricted to either ‘A’ or ‘C’ samples. Mpi4 was present only in ‘A’ samples 2, 11 and 12, and Mpi alleles 7–9 were present only in ‘C’ samples eight and nine. In addition to the unique alleles listed above, Mpi6 was found to be common in species ‘C’ samples but rare in
Ž . 1 5
species ‘A’ with frequencies between 0 and 0.05 . Mpi and Mpi was found in similar frequencies in both species. Individuals were therefore classified as species ‘C’ if they possessed Mpi marker alleles 6–9 and non-diagnostic alleles 1 and 5. Fourteen of the 61 ‘P’ oysters from ‘‘mixed’’ samples fell into this category, thirteen of which came from
Ž .
sample five from Chumphon , with the remaining individual coming from sample six
Žalso from Chumphon . Examination of variation at the other loci revealed that all but.
two of these individuals possessed PCA marker alleles for species ‘C’ at Lap, Pgi and
Pgm loci. Both these hybrids came from sample five, and included one individual that
possessed ‘C’ alleles at all but the Pgm locus where it was homozygous for ‘A’ alleles
Ž4r4 . The other individual possessed ‘C’ alleles at all but the Pgi locus where it was.
Ž .
homozygous for ‘B’ alleles 7r7 . The remaining forty-nine ‘P’ individuals were identified as species ‘A’.
Following identification of individuals to species, our original 12 samples were resolved into eighteen putative mono-specific samples. Tests of genotype frequencies on
Ž .
()
A.J.
Day
et
al.
r
Aquaculture
187
2000
51
–
72
60
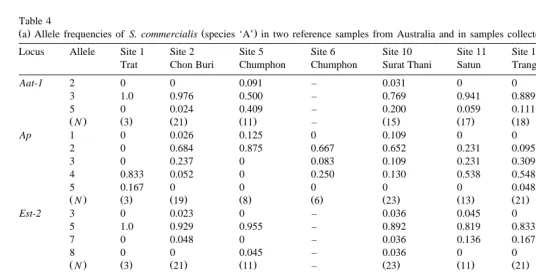
Table 4
Ž .a Allele frequencies of S. commercialis species ‘A’ in two reference samples from Australia and in samples collected from different sites throughout ThailandŽ .
Locus Allele Site 1 Site 2 Site 5 Site 6 Site 10 Site 11 Site 12 Sydney Marnetic
Trat Chon Buri Chumphon Chumphon Surat Thani Satun Trang Australia Island Australia
Aat-1 2 0 0 0.091 – 0.031 0 0 0.028 0.028
3 1.0 0.976 0.500 – 0.769 0.941 0.889 0.972 0.889
5 0 0.024 0.409 – 0.200 0.059 0.111 0 0.083
ŽN. Ž .3 Ž21. Ž11. – Ž15. Ž17. Ž18. Ž18. Ž18.
Ap 1 0 0.026 0.125 0 0.109 0 0 0.028 0.036
2 0 0.684 0.875 0.667 0.652 0.231 0.095 0.638 0.750
3 0 0.237 0 0.083 0.109 0.231 0.309 0.056 0.214
4 0.833 0.052 0 0.250 0.130 0.538 0.548 0.028 0
5 0.167 0 0 0 0 0 0.048 0.250 0
ŽN. Ž .3 Ž19. Ž .8 Ž .6 Ž23. Ž13. Ž21. Ž18. Ž18.
Est-2 3 0 0.023 0 – 0.036 0.045 0 0.306 0.083
5 1.0 0.929 0.955 – 0.892 0.819 0.833 0.639 0.778
7 0 0.048 0 – 0.036 0.136 0.167 0.055 0.139
8 0 0 0.045 – 0.036 0 0 0 0
ŽN. Ž .3 Ž21. Ž11. – Ž23. Ž11. Ž21. Ž18. Ž14.
Lap 1 0 0 0 0 0 0 0 0.025 0.030
2 0 0 0 0 0 0 0 0 0.030
3 0 0 0 0 0 0 0 0.350 0
4 0 0.214 0.250 0 0.140 0 0.024 0.475 0.156
5 0.167 0.119 0.286 0.278 0.160 0.136 0.119 0 0.345
6 0.833 0.667 0.214 0.611 0.580 0.705 0.666 0 0.345
7 0 0 0.250 0.111 0.120 0.091 0.167 0.150 0.094
8 0 0 0 0 0 0.068 0.024 0 0
()
A.J.
Day
et
al.
r
Aquaculture
187
2000
51
–
72
61
2 0.167 0 0.107 0 0.060 0.068 0.025 0 0
3 0.833 0.262 0.107 0.056 0.360 0.045 0.125 0.263 0.500
4 0 0.547 0.607 0.721 0.460 0.546 0.650 0.737 0.406
5 0 0.143 0.143 0.167 0.080 0.273 0.150 0 0.094
6 0 0.024 0.036 0.056 0 0.045 0 0 0
ŽN. Ž .3 Ž21. Ž14. Ž .9 Ž25. Ž22. Ž20. Ž19. Ž16.
Mdh-1 2 0 0.048 0 0 0.022 0.045 0.048 0 0.028
3 1.000 0.952 0.857 0.667 0.913 0.932 0.952 0.875 0.972
5 0 0 0.143 0.333 0.065 0.023 0 0.125 0
ŽN. Ž .3 Ž21. Ž14. Ž .9 Ž23. Ž22. Ž21. Ž20. Ž18.
Pgi 1 0 0 0.036 0 0.040 0 0.190 0.265 0.056
2 0 0 0 0 0 0.023 0 0 0
3 0.667 0.095 0.214 0.111 0.140 0.931 0.525 0.059 0.167
4 0.333 0.429 0.214 0.278 0.240 0.023 0.190 0.529 0.527
5 0 0.309 0.429 0.444 0.480 0.023 0.095 0.147 0.250
6 0 0.167 0.107 0.167 0.100 0 0 0 0
ŽN. Ž .3 Ž21. Ž14. Ž .9 Ž25. Ž22. Ž21. Ž18. Ž18.
Pgm 1 0 0 0 0 0.060 0 0 0.050 0
2 0 0.024 0.071 0 0.060 0.023 0.024 0.175 0.194
3 0.333 0.333 0.250 0.056 0.360 0.091 0.048 0.325 0.556
4 0.667 0.619 0.536 0.721 0.480 0.681 0.714 0.375 0.194
5 0 0 0.036 0.167 0.020 0 0 0.025 0.056
6 0 0.024 0.107 0.056 0.020 0.182 0.190 0.050 0
7 0 0 0 0 0 0.023 0.024 0 0
ŽN. Ž .3 Ž21. Ž14. Ž .9 Ž25. Ž22. Ž21. Ž20. Ž18.
()
A.J.
Day
et
al.
r
Aquaculture
187
2000
51
–
72
62
Ž .
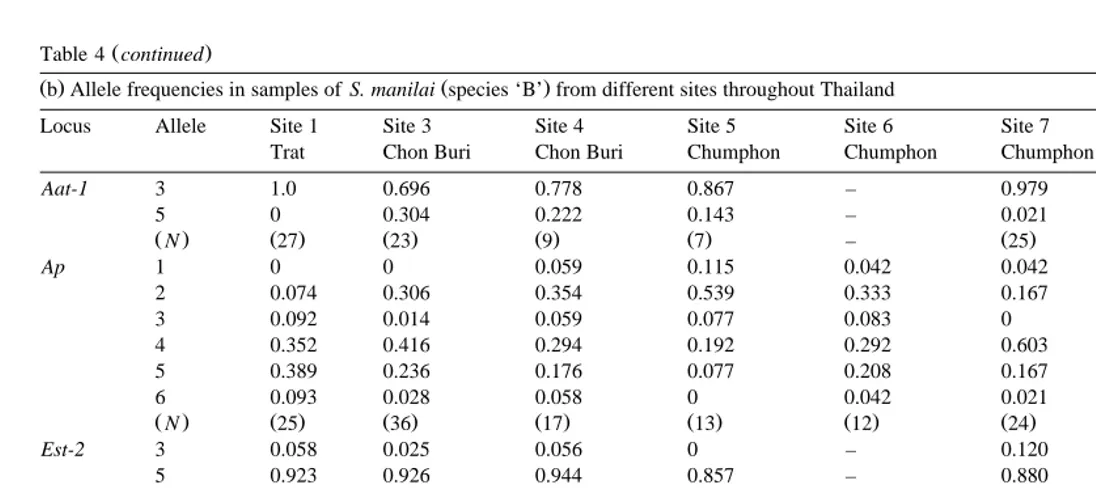
Table 4 continued
Ž .b Allele frequencies in samples of S. manilai species ‘B’ from different sites throughout ThailandŽ .
Locus Allele Site 1 Site 3 Site 4 Site 5 Site 6 Site 7 Site 10
Trat Chon Buri Chon Buri Chumphon Chumphon Chumphon Surat Thani
Aat-1 3 1.0 0.696 0.778 0.867 – 0.979 0.9
5 0 0.304 0.222 0.143 – 0.021 0.1
ŽN. Ž27. Ž23. Ž .9 Ž .7 – Ž25. Ž .5
Ap 1 0 0 0.059 0.115 0.042 0.042 0.125
2 0.074 0.306 0.354 0.539 0.333 0.167 0.375
3 0.092 0.014 0.059 0.077 0.083 0 0.125
4 0.352 0.416 0.294 0.192 0.292 0.603 0.292
5 0.389 0.236 0.176 0.077 0.208 0.167 0.083
6 0.093 0.028 0.058 0 0.042 0.021 0
ŽN. Ž25. Ž36. Ž17. Ž13. Ž12. Ž24. Ž12.
Est-2 3 0.058 0.025 0.056 0 – 0.120 0
5 0.923 0.926 0.944 0.857 – 0.880 1.000
7 0.019 0.037 0 0.143 – 0 0
8 0 0.012 0 0 – 0 0
ŽN. Ž27. Ž40. Ž27. Ž .7 – Ž24. Ž10.
Lap 1 0.056 0.059 0.019 0 0 0.038 0.083
2 0.185 0.095 0.185 0.154 0.100 0.115 0.292
3 0.685 0.703 0.740 0.731 0.833 0.732 0.500
4 0.056 0.119 0.056 0.038 0.067 0.077 0.083
5 0.018 0.024 0 0.077 0 0.038 0.042
()
A.J.
Day
et
al.
r
Aquaculture
187
2000
51
–
72
63
3 0.981 0.861 0.963 0.917 – 0.958 0.950
5 0.019 0.097 0.037 0.083 – 0.042 0
ŽN. Ž27. Ž36. Ž27. Ž .6 – Ž25. Ž12.
Mpi 2 0.074 0 0 0 0 0.020 0
3 0.093 0.071 0.071 0.038 0 0.160 0.042
4 0.352 0.584 0.339 0.577 0.500 0.480 0.500
5 0.389 0.345 0.590 0.308 0.467 0.340 0.333
6 0.092 0 0 0.077 0.033 0 0.125
ŽN. Ž27. Ž42. Ž28. Ž13. Ž15. Ž25. Ž12.
Pgi 4 0.018 0.012 0.036 0.077 0 0 0.083
5 0.093 0.345 0.179 0.154 0.033 0.154 0.125
6 0.315 0.309 0.535 0.346 0.367 0.269 0.250
7 0.370 0.274 0.161 0.231 0.467 0.443 0.250
8 0.167 0.036 0.089 0.154 0.100 0.115 0.250
9 0.037 0.024 0 0.038 0.033 0.019 0.042
ŽN. Ž27. Ž42. Ž28. Ž13. Ž15. Ž26. Ž12.
Pgm 2 0.018 0 0 0 0.033 0 0.083
3 0.018 0.061 0.036 0.038 0.033 0.096 0.125
4 0.130 0.146 0.089 0.115 0.133 0.135 0.208
5 0 0 0 0.038 0 0 0
6 0.259 0.256 0.393 0.424 0.400 0.404 0.208
7 0.519 0.537 0.446 0.385 0.368 0.327 0.376
8 0.056 0 0.036 0 0.033 0.038 0
ŽN. Ž27. Ž41. Ž28. Ž13. Ž15. Ž26. Ž12.
()
A.J.
Day
et
al.
r
Aquaculture
187
2000
51
–
72
64
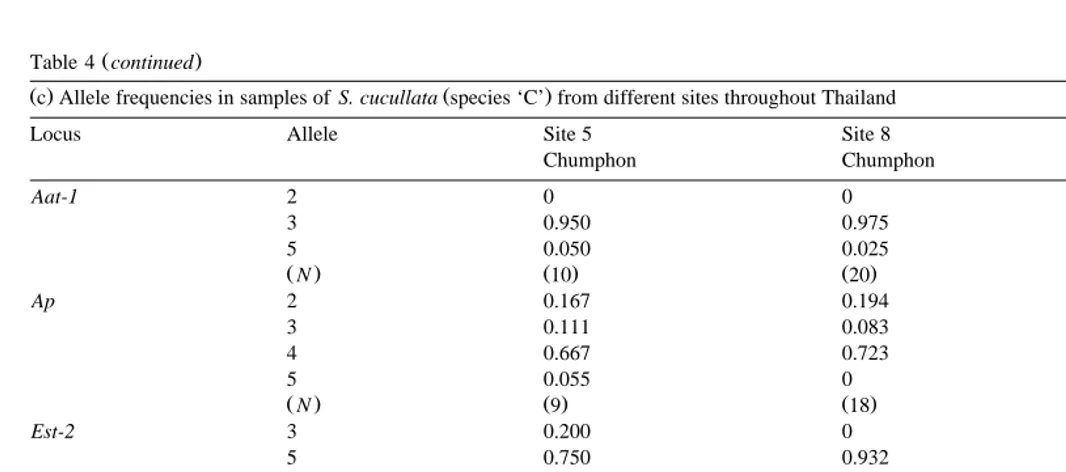
Ž .
Table 4 continued
Ž .c Allele frequencies in samples of S. cucullata species ‘C’ from different sites throughout ThailandŽ .
Locus Allele Site 5 Site 8 Site 9
Chumphon Chumphon Chumphon
Aat-1 2 0 0 0
3 0.950 0.975 0.975
5 0.050 0.025 0.025
ŽN. Ž10. Ž20. Ž40.
Ap 2 0.167 0.194 0.244
3 0.111 0.083 0.122
4 0.667 0.723 0.594
5 0.055 0 0.040
ŽN. Ž .9 Ž18. Ž37.
Est-2 3 0.200 0 0.025
5 0.750 0.932 0.925
7 0.050 0.023 0.038
8 0 0.045 0.012
ŽN. Ž10. Ž22. Ž40.
Lap 4 0 0 0.027
5 0.045 0.026 0.027
6 0.136 0.132 0.203
7 0.727 0.842 0.675
8 0.092 0 0.068
()
A.J.
Day
et
al.
r
Aquaculture
187
2000
51
–
72
65
5 0.091 0.056 0
6 0.591 0.250 0.250
7 0.045 0.222 0.167
8 0.091 0.305 0.555
9 0.182 0.111 0.028
ŽN. Ž11. Ž18. Ž36.
Mdh-1 2 0 0.053 0.038
3 1.000 0.921 0.900
5 0 0.026 0.062
ŽN. Ž .7 Ž19. Ž40.
Pgi 1 0.227 0.342 0.311
2 0.091 0 0
3 0.635 0.632 0.689
4 0.045 0.026 0
ŽN. Ž11. Ž19. Ž37.
Pgm 3 0 0.026 0
4 0 0.053 0.135
5 0 0.079 0
6 0.318 0.342 0.135
7 0.682 0.500 0.703
8 0 0 0.027
( )
A.J. Day et al.rAquaculture 187 2000 51–72
66
samples were in Hardy–Weinberg equilibrium, and therefore that mixed samples were correctly resolved into species. Numbers of all three species are given in Table 3, and frequencies calculated for ‘A’, ‘B’ and ‘C’ samples in Table 4a–c.
3.2. Morphology
Numbers of Saccostrea from each site that were used for morphological analysis are given in Table 1. The morphology data set included only those individuals that could be identified with 95% certainty by PCA of allozymes. Total numbers of each species were
Ž . Ž
39 for species ‘A’ including individuals from five sites , 31 for species ‘B’ including
.
individuals from two sites , and 20 for species ‘B’ which came from Ko Talu only. For qualitative characters, numbers of individuals of each species, in the categories that were scored for scar colour and chomata spacing, are given in Table 5. ‘G’ tests for
Ž .
differences between species Sokal and Rohlf, 1969 were significant for both adductor
Ž .
muscle scar colour and chomata spacing independently P-0.001 , as well as for both
Ž .
characters combined P-0.001 . The most useful of these two characters for identifica-tion purposes is scar colour. Black adductor muscle scars were almost entirely restricted to ‘C’ with 75% of individuals having black scars. Scar colour for species ‘B’ was generally brown with pronounced lighter stripes, and in species ‘A’ scar colour was generally white or brown. However, for species ‘A’, one individual was recorded as having a black scar. Chomata spacing was much more variable. Although 75% of species ‘C’ were scored as having chomata that did not completely encircle the left valve, a significant number of species ‘A’ and ‘B’ also had ‘‘incomplete’’ chomata. In both species ‘A’ and ‘B’, chomata spacing and adductor scar colour covaried. For species ‘A’, 84.6% of individuals had adductor scars that were other than black
Table 5
Qualitative morphological characters: numbers of individuals with each character, in samples of Saccostrea species from Thailand
S. commercialis S. manilai S. cucullata ‘G’
Žspecies ‘A’. Žspecies ‘B’. Žspecies ‘C’.
Black scar, incomplete 0 0 13
Other colour, complete 33 12 3
Žgenerally white , together with chomata that completely encircled the left valve..
However, 42.8% of species ‘B’ and 15% of species ‘C’ possessed these same character-istics. The possession of both black adductor muscle scars and ‘‘Incomplete’’ chomata was entirely confined to species ‘C’, although only 65% of this species fell into this category.
For PCA, data were first log-transformed to standardise variances. Shell size was highly variable. Therefore, PCA was carried out on correlation matrices, as these isolate size variation to the first principal component to a greater extent than covariance
Ž . Ž . Ž .
matrices Somers, 1986 . Principal components one PC1 and two PC2 accounted for 52% and 20% of the total variance, and individuals classified as species ‘A’, ‘B’ or ‘C’
Ž .
cluster according to species when these two PCs are plotted Fig. 4 . Stepwise discriminant analysis of the first 10 principal components revealed that PC4 also varied between species, although this principal component explained less than 7% of the total variance. These three PCs, together successfully classified 100% of species ‘C’ and 85% of each of the other two species. F-values for PC1, PC2, and PC4 were 43.6, 46.3 and
Ž .
4.1, respectively Wilks-Lambda 0.188, P-0.00005 .
Ž .
Correlation coefficients component loadings for each of the 10 measured characters with PC1, PC2 and PC4 are given in Table 6. Because species varied in size, PC1
Ž .
possessed significant component loadings P-0.001 for all characters except umbo depth. ANOVA of all raw measurements revealed that length and width of both shells
ŽLDVM, RDVM,LAPM and RAPM , hinge length HL , adductor scar width SW , and. Ž . Ž . Ž .
thickness of the right valve RT were significantly smaller in species ‘A’ compared to
Ž 2
the other two species R varied from 27% to 49%, with P-0.0005 for all
compar-. Ž .
isons means and standard deviations are given in Table 7 . PC2 reflected the degree of
( )
A.J. Day et al.rAquaculture 187 2000 51–72
68 Table 6
Ž .
Component loadings correlation coefficients of morphological characters with taxonomically useful principal components, for Saccostrea spp. from Thailand
Character PC1 ‘‘Size’’ PC2 ‘‘Cupping’’ PC4 ‘‘Umbo cavity size’’ External measurements
LTRT 0.654 y0.655 y0.242
Measurements
‘‘cupping’’ of the left valve with the highest component loadings being for the depth of
Ž . Ž .
the left valve LT , the depth of left and right valves together LTRT and the umbo
Ž .
depth UD . The left valve was deepest in species ‘C’ with measurements for LT and LTRT that were roughly one and a half times bigger than those of species ‘A’ and ‘B’
ŽR of 48% for characters, with P2 -0.0005 . Umbo depth varied significantly between.
Table 7
Ž .
Means of 10 morphological measurements cm made on the shells of Saccostrea species from Thailand
Ž"two standard errors.
Variable S. commercialis S. manilai S. cucullata ANOVA
Ž 2 .
all species R of 66%, P-0.0005 . Species ‘C’ had an umbo depth that was more than double the size of the other two species. However, species ‘A’ also had a
Ž .
comparatively large umbo depth for its small size. The relative thicknesses depths of both left and right valves compared to the size of umbo cavity was reflected in PC4 with significant negative loadings for RT and LTRT and positive loadings for hinge length
ŽHL , umbo depth UD and width of the left valve LAPM .. Ž . Ž .
From stepwise discriminant analysis, the ‘‘best’’ subset of ‘‘raw’’ characters to discriminate between species comprised UD, RAPM and RT, with F-values of 68.5,
Ž .
17.3 and 5.8, respectively Wilks-Lambda 0.205, P-0.00005 . This combination of characters correctly classified 100% of species ‘C’, 88% of species ‘A’ and 85% of species ‘B’. RAPM is the only one of these measurements that does not require oysters to be killed. Therefore, we also tested subsets of measurements that can be made externally for their ability to classify living oysters. The first subset comprised RAPM, LTRT and RDVM, which had the highest F-values of the five ‘‘external’’ characters. Classification using these three characters was equally successful for S. commercialis, with again 85% of individuals successfully classified to species. However, successful
Ž
classifications fell to 90% for species ‘C’ and only 68% for species ‘B’ Wilks-Lamda
.
0.314, P-0.00005 . The F-value for LDVM was substantially lower at 0.8 than the
Ž .
other two characters Fs2.6 for LTRT and 5.8 for RAPM . Repetition of the analysis excluding LDVM reduced successful identification by only three to five percent for each species with the highest percentage being 85% for species ‘C’.
3.3. Identification of species
Mobility’s of common alleles at all eight scored loci of type ‘A’ were identical to those of reference S. commercialis from Australia, and allowed identification of species ‘A’ as S. commercialis. Species ‘B’ and ‘C’ were identified by conchological characters and relative mobilities of alleles at marker loci. Shell morphology of species ‘C’
Ž .
matched that of S. cucullata from India Awati and Rai, 1931 . Similar characters included a deeply cupped left valve with a wide hinge-line, well-developed cavity at the umbo, chomata that did not completely encircle the right valve, and an adductor muscle scar that was generally black. Shell morphology of species Species ‘B’ was similar to
Ž .
that described for S. malabonensis from the Philippines Carreon, 1968 . Key features included a small hinge-line, a striped brown and white adductor scar that was displaced dorsally, and large patches of greenish-brown coloration on interior surfaces. Buroker et
Ž .
al. 1979a,b published allele frequencies for four species of Saccostrea from the indo-pacific, S. commercialis, S. cucullata, S. malabonensis and S. manilai.
Compari-Ž .
son with the data sets of Buroker et al. 1979a,b was only possible for Lap and Pgi.
Ž .
Buroker et al. 1979a,b scored two loci for each of our other six enzymes and in spite of using the same buffer system for our gels we could not be certain which of these loci
Ž .
was homologous to those that we scored. Buroker et al. 1979a,b found that S.
commercialis and S. cucullata had similar mobility’s for common alleles at both Lap
and Pgi, and this was also the case for S. commercialis from Thailand and our species ‘C’. Allozyme frequencies are therefore consistent with our morphological identification
Ž . Ž .
( )
A.J. Day et al.rAquaculture 187 2000 51–72
70
species to S. malabonensis that they named S. manilai. For this species, the zone of activity for the Lap locus was slowest of all scored Saccostrea species while the zone of activity for the Pgi locus was fastest. This was the case for our species ‘B’, suggesting
Ž .
that this may be the cryptic species S. manilai Buroker . For S. malabonensis itself, although mobility’s of common Lap alleles were slower than S. commercialis and S.
cucullata, the zone of activity for the Pgi locus was of similar mobility to all species
Ž .
except S. manilai. We therefore identify species ‘B’ as S. manilai Buroker .
4. Discussion
By the use of allozyme variation at four marker loci we were able to assign
Saccostrea oysters from Thailand to one of three species that we identified as S. commercialis, S. cucullata and S. manilai. S. cucullata was restricted to oceanic
conditions on offshore islets. The other two species were found in coastal and estuarine sites throughout the Gulf of Thailand where they were often found in sympatry. The sharing of common alleles between species limited our ability to identify hybrids. However, in spite of this, we found two hybrids between S. commercialis and S.
manilai, one hybrid between S. manilai and S. cucullata, and one hybrid between S. commercialis and S. cucullata. Fixed genetic markers for these species will be necessary
to discover the full extent of hybridisation occurring in nature.
Principal component analysis of shell morphometrics revealed three principal compo-nents that varied between species. These reflected variation in overall size, shape of the
Ž .
left valve degree of cupping , and relative size of the umbo cavity. The best subset of individual measures, for diagnostic purposes, were the depth of the umbo, the thickness of the right valve and the width of the right valve. The percentage of correctly classified individuals was similar irrespective of whether original measures or principal compo-nents were used. The distinctive shell morphology of S. cucullata was reflected in a 100% success rate when classifying individuals by morphometrics. The identification success rate for the other two species averaged 85%. Studies on a variety of Saccostrea species have demonstrated that many aspects of shell morphology, most notably external shell sculpture, and depth, length and thickness of shell, vary with environment
ŽThomson, 1954; Stenzel, 1971; Tack et al., 1992 . These are precisely those characters.
that are easiest to measure on living shells. Our subset of ‘‘external’’ characters that comprised total depth of the oyster, and length and width of the right valve was still successful in identifying 90% and 85% of S. cucullata and S. commercialis, respec-tively. However, use of these measures resulted in only 68% successful classifications for S. manilai. In terms of qualitative characters, the possession of a black adductor muscle scar was almost entirely confined to S. cucullata, although this applied to only 75% of this species. Assessment of chomata spacing is more subjective and varied within all species.
5. Conclusion
which were the size of the umbo cavity and colour of the adductor scar, could only be examined by sacrificing oysters. Nevertheless, use of both these characters provides a simple, effective means for hatcheries to confirm broodstock identity. The identification of living oysters is more problematic. External characters are too variable to be really useful in identifying individual oysters. For the purposes of transplantation, a possible approach is to sacrifice and identify a random sample of oysters from possible donor
Ž .
sites and take oysters only from those sites which are mono-specific or nearly so for the desired species.
Acknowledgements
The authors gratefully acknowledge the technical assistance of Miss A. Sungpetch.
Ž .
We also thank Prof. John Lucas James Cook University for supplying reference samples of S. commercialis. This study was supported by the UK Darwin Initiative for
Ž
the Survival of Species, and represents part of Strategic Research Project 3 ‘‘Marine
.
Biodiversity’’ of the Plymouth Marine Laboratory, a component of the UK Natural Environment Research Council.
References
Amornjaruchit, S., 1988. Economically important molluscan shellfish of Thailand. ICLARM Technical Reports 19, 1–18.
Ž .
Awati, P.R., Rai, H.S., 1931. Ostrea cucullata The Bombay Oyster , The Indian Zoological Memoirs on the Indian Animal Types. Methodist Publishing House, Lucknow, India.
Brohmanonda, P., Mutarasint, K., Chongpeepien, T., Amornjaruchit, S., 1988. Oyster culture in Thailand. In:
Ž .
McCoy, E.W., Chongpeepien, T. Eds. , Bivalve Mollusc Culture Research in Thailand. ICLARM Technical Reports 19 pp. 31–39.
Buroker, N.E., Hershberger, W.K., Chew, K.K., 1975. Genetic variation in the Pacific oyster, Crassostrea gigas. Journal of the Fisheries Research Board of Canada 32, 2472–2477.
Buroker, N.E., Hershberger, W.K., Chew, K.K., 1979a. Population genetics of the family Ostreidae: I. Intraspecific studies of Crassostrea gigas and Saccostrea commercialis. Marine Biology 54, 157–169. Buroker, N.E., Hershberger, W.K., Chew, K.K., 1979b. Population genetics of the family Ostreidae: II.
Interspecific studies of the genera Crassostrea and Saccostrea. Marine Biology 54, 171–184.
Bussarawit, S., 1995. Molluscs from the marine national parks: Surin and Le-pae islands, Andaman sea, Thailand. Phuket Marine Biology Center Special Publication 15, 119–125.
Carreon, J.A., 1968. The malacology of Philippine oysters of the genus Crassostrea and a review of their shell characters. Proceedings of the National Shellfisheries Association 59, 104–115.
Hochberg, Y., 1988. A sharper Bonferroni proceedure for multiple tests of significance. Biometrika 75, 800–802.
Jarayabhand, P., Thavornyutikarn, M., 1995. Realised heritability estimation on growth rate of oyster Saccostrea commercialis Born, 1778. Aquaculture 138, 111–118.
McDonald, J.H., Seed, R., Koehn, R.K., 1991. Allozymes and morphometric characters of three species of Mytilus in the Northern and Southern Hemispheres. Marine Biology 111, 323–333.
Morton, B., Morton, J., 1983. The sea shore ecology of Hong Kong. Hong Kong Univ. Press, Hong Kong.
Ž . Ž .
Musig, Y., 1987. Problems of oyster farming. Thai Fisheries Gazette 40 4 , 427–428, In Thai .
( )
A.J. Day et al.rAquaculture 187 2000 51–72
72
Nielsen, C., 1976. An illustrated checklist of bivalves from PMBC beach with a reef-flat at Phuket, Thailand. Phuket Marine Biology Center Research Bulletin 9, 7 pp.
Pamilo, P., Varvio-Aho, S., 1984. Testing genotype frequencies and heterozygosities. Marine Biology 79, 99–100.
Sanpanich, K., 1998. An annotated check list of marine bivalves from Chonburi and Rayong provinces, the
Ž .
east coast of Thailand. Phuket Marine Biology Center Special Publication 18 2 , 297–305.
Sokal, R.R., Rohlf, F.J., 1969. Biometry, The Principles and Practice of Statistics in Biological Research. W.H. Freeman and Company, San Francisco.
Somers, K.M., 1986. Multivariate allometry and removal of size with principal components analysis.
Ž .
Systematic Zoology 35 3 , 359–368.
Ž .
Stenzel, H.B., 1971. Oysters. In: Moore, R.C. Ed. , Treatise on Invertebrate Paleontology Vol. 3 Geological Society of America and the University of Kansas, Boulder,CO, pp. 953–1224, Part N, Bivalvia.
Ž . Ž .
Tack, J.F., Berghe, E., Polk, Ph., 1992. Ecomorphology of Crassostrea Cucullata Born, 1778 Ostreidae in
Ž .
a mangrove creek Gazi, Kenya . Hydrobiologia 247, 109–117.
Thomson, J.M., 1954. The genera of oysters and the Australian species. Australian Journal of Marine and Freshwater Research 5, 132–168, 11 plates.
Tookwina, S., 1991. Coastal aquaculture and sea farming in Thailand. Phuket Marine Biology Center Special Publication 9, 82–83.
Yusuk, W., 1988. Oysters in Thailand. Marine Science department Kasetsart University, Bangkok, Thailand,