eBusiness Research Center 2000
eBusiness Research Center Working Paper 3-1999
Consumer Choice Behavior
in Online and Traditional Supermarkets:
The Effects of Brand Name, Price, and other Search Attributes
Published as "Consumer Choice Behavior in Online and Traditional Supermarkets:
The Effects of Brand Name, Price, and Other Search Attributes," International Journal of Research in Marketing, Vol.17,No.1,p.55-78. Won an honorable mention in the best-paper award competition of IJRM for 2001.
Alexandru M. Degeratu Arvind Rangaswamy
Jianan Wu
eBusiness Research Center 401 Business Administration Building
University Park, PA 16802 Phone: 814.861.7575
Fax: 814.863.0413 Web: www.ebrc.psu.edu
A joint venture of Penn State’s Smeal College of Business Administration and the School of Information Sciences and Technology
Consumer Choice Behavior in Online and Traditional Supermarkets: The Effects of Brand Name, Price, and other Search Attributes
Alexandru M. Degeratu a, *
Are brand names more valuable online or in traditional supermarkets? Does the increasing availability of comparative price information online make consumers more price-sensitive? We address these and related questions by first conceptualizing how different store environments (online and traditional stores) can differentially affect consumer choices. We use the liquid detergent, soft margarine spread, and paper towel categories to test our hypotheses. Our hypotheses and the empirical results from our choice models indicate that: (1) Brand names become more important online in some categories but not in others depending on the extent of information available to consumers – brand names are more valuable when information on fewer attributes is available online, (2) Sensory search attributes, particularly visual cues about the product (e.g., paper towel design), have lower impact on choices online, and factual information (i.e., non-sensory attributes, such as the fat content of margarine) have higher impact on choices online (3) Price sensitivity is higher online, but this is due to online promotions being stronger signals of price discounts. The combined effect of price and promotion on choice is weaker online than offline.
Key Words: Brand value; Choice models; e-commerce; Grocery products; Internet marketing; Price sensitivity
a
The Smeal College of Business, Penn State University, University Park, PA 16802-3007, USA b
A.B. Freeman School of Business, Tulane University, New Orleans, LA 70118-5669, USA *
Corresponding author. Tel.: (814) 865-0232; [email protected]
We thank the participants at the Marketing Science Institute Workshop on Research Frontiers in Interactive Marketing, The Wharton School SEI Center colloquium, and the MIT Internet
1. Introduction
There is increasing interest in understanding the effects of computer mediated shopping
environments (Hoffman and Novak 1996). An issue of particular interest to both practitioners and
academics is in determining whether there are systematic differences in consumer choice behavior
between online and regular (offline) stores, and if there are differences, in understanding the
reasons for these differences. Put another way, will the same person exhibit different choice
behavior online and offline, and if so, why? Identifying and understanding these differences is
important for formulating marketing strategies, especially for online marketers.
We address these questions by first proposing a general conceptual framework to articulate
how various factors influence online and offline choices. Although there are many factors that
affect online choice behavior, we focus specifically on assessing whether brand names have more
impact on choices online or offline, and whether price and other search attributes have higher
impact online or offline. We empirically evaluate the implications of our conceptual framework
by analyzing consumer choices in Peapod, an online grocery subscription service, headquartered in
Skokie, IL,1 and in traditional supermarkets belonging to the same grocery chain operating in the
same geographical area.
Few papers have explored how consumer behavior online differs from consumer behavior
offline. Exceptions are a conceptual paper on Interactive Home Shopping by Alba et al. (1997)
and an experimental study by Burke et al. (1990). Alba et al. point out that a key difference
between online and offline shopping is the ability of online consumers to obtain more information
about both price and non-price attributes. More information on prices could increase consumer
price sensitivity for undifferentiated products. At the same time, having more information on
1
Peapod offers an online grocery subscription service in seven metropolitan areas. It was founded in 1989 and started offering its services in the Chicago area in 1990. In each of its served markets, Peapod is affiliated with a local grocery store from which the items are delivered to consumers. Peapod’s prices correspond exactly to the prices at the affiliated store. In addition, Peapod may offer some of its own promotions.
price attributes could reduce price sensitivity for differentiated products. Therefore, these authors
suggest that an important research question is “What are the true dynamics of price sensitivity in
this environment?” We need empirical research to understand how these implications are
moderated by type of product, the power of the brand name, and the attributes for which
information is available online.
Burke et al. (1990) tracked the purchases made by 18 consumers in a traditional
supermarket over a 7-month period. Two months later, the same group of consumers participated
in laboratory experiments wherein market conditions identical to the in-store environment were
created on a computer system for several product classes of interest. Each subject made online
purchases in the simulated store during the same weeks in which that subject had made in-store
purchases. A comparison of online purchases versus in-store purchases revealed systematic
differences when information relevant to choice decisions was not equivalently available in both
store types. Specifically, product-size information is often not conveyed realistically in online
stores. Consequently, there were greater discrepancies between the online and offline choice
shares for the various product sizes, with larger sizes being purchased more frequently online. At
the same time, there were no significant differences in the effects of promotions when the online
store presented promotion information graphically in a manner that resembled promotions in the
regular store. The authors report mixed results with regard to purchases of store brands. For some
product categories (e.g., paper towel and tuna), the proportion of purchases of store brands was
greater online than in the traditional supermarkets, whereas in other categories (toilet tissue and
soft drinks), the proportion of purchases of store brands was smaller online. They attribute these
results to unspecified product-class differences. While the reported results are interesting, these
authors do not provide any overall conceptual framework to understand and predict differences
between online and offline choice behavior.
In the next section, we propose a conceptual framework to help us assess the relative
impact of brand names, prices, and other search attributes on consumer choices within a specific
we might expect between online and offline choice behavior. In Section 3, we describe the
characteristics of our panel data and our methodology for testing the hypotheses. In Section 4, we
describe the results of our empirical analyses in three product categories: liquid detergent, soft
light margarine spread, and paper towel. In Section 5, we summarize the main insights from our
study and suggest further research opportunities in this area.
2. Conceptual Framework and Hypotheses
Information availability and search: We start with a conceptual framework to articulate
how differences in information available for decision making online and offline influence
consumer choices. When choosing among alternatives, consumers are faced with a “mixed”
choice task situation (Lynch et al., 1988). Consumers make their choices using prior information
already available in their memories as well as information they obtain from the external
environment. When searching for information in the external environment (e.g., online store),
consumers focus on those relevant attributes that are available and are diagnostic (Dick et. al,
1990). To the extent that relevant information is missing in the external environment, or if search
costs for acquiring relevant information are higher than expected benefits, consumers will rely
more on their prior information (Ratchford 1982).
If information on an attribute is not already known to the consumer and the expected
benefits of search are high relative to search costs, consumers will first try to search for that
information. On the other hand, if the expected benefits are high but search costs are also high (in
a given medium), then consumers may try to infer the value of that attribute. A common method
of inference, especially in low-involvement product categories like groceries, is the “halo effect,”
whereby consumers infer attribute values based on their overall evaluations of that product (e.g., “I
is an attribute for which information may be more costly to obtain offline than online)2.
In both the online and offline media, some attribute information relevant for decision
making may not be readily available (i.e., search costs for those attributes are high). This occurs,
either because information on an attribute is simply not accessible in a given medium (e.g., the
scent of a detergent or softness of paper towel are difficult to discern online) or the information
can only be obtained with considerable effort (e.g., generating a comparative listing of the
nutritional facts of different brands of margarine is more effortful offline than online).
Information integration: We now propose a mechanism by which consumers integrate all
the information actually available to them (including prior information in their memories and any
information obtained through search) into overall product evaluations and preferences.
Information integration theory (see, for example, Anderson 1971, 1981; Bettman, Capon, and
Lutz, 1975) offers a specific mechanism to describe how individuals integrate separate pieces of
available information into an overall index of preference. In the context of product evaluations,
this theory suggests that consumers assign importance weights and scale values (utilities) to
product attributes for which information is available at the time of decision making, and then
combine these weights and values according to some rule (e.g., adding, averaging) to come up
with an overall evaluation. The “averaging” rule has found substantial support as an information
integration mechanism (e.g., Troutman and Shanteau 1976; Johnson and Levin 1985; Busemeyer
1991):
2
In this paper, we are concerned only about information availability that is a consequence of the medium in which consumers make choices. Thus, we are concerned only with situations in which information availability affects all choice alternatives. In the more general case, where information may be missing only for specific choice alternatives (e.g., we do not know the quality of the private label brand), consumers may use inference rules other than the “halo effect” (see, for example, Alba and Hutchinson 1987, Ross and Creyer 1992, and Burke 1992). Alternative inference rules include the following: (1) Similarity-based inference, in which consumers infer information about an attribute value using the overall similarity of that choice alternative to other alternatives (e.g., Promise margarine should have roughly the same fat content as the other leading margarine brands); (2) Within-attribute inference, such as assigning an attribute value to a choice alternative equal to the average value of that attribute across the other choice alternatives (e.g., the fat content of Promise margarine will be equal to the average fat content in the product category); (3)
.
W is the overall evaluation (value) of a product;
n
α
α1,..., are the importance weights of attributes 1, 2, …n;
U1(X1)…Un(Xn) are the utilities assigned to attributes 1,2,…,n with attribute levels specified asX1,...,Xn; and
Accordingly, if Xn is not available in consumers’ memory or in the external environment,
αn will become zero, and the importance weights for one or more of the remaining attributes (α1,
α2, …,αn-1) will increase (Huber and McCann 1982). Note that αi’s sum to 1. In particular, under
the “halo effect” argument, the importance weight attached to brand name will increase. Dick et
al. (1990) experimentally evaluated consumers’ inference processes when information is
unavailable. They find that when their subjects had limited availability of attribute information,
they inferred brand attribute values consistent with their prior evaluations. In the limit, we can
conceive of situations where the brand name becomes the surrogate for all the attributes for which
information is missing or costly to obtain. Conversely, when information about new attributes
become available, the importance of existing attributes, particularly the brand name, is diminished.
We note here that if attribute information is unavailable only for a specific alternative, then
it is likely that such information will be unavailable in both the online and offline environments
(e.g., information that the private label brand is actually manufactured by the same company that
makes the leading brand). Also, information about experience attributes (e.g., how a product
tastes to a given customer; the absorbency of a brand of paper towel) are unavailable both online
and offline, and have to be typically ascertained by product use, i.e., if they exist, they are in the
memories of consumers. We assume that information unavailable in both media would have no
Information Availability in Online and Offline markets
In this subsection, we use the above conceptualization to articulate how the store
environment (online versus offline) influences information availability, and consequently
consumer choices. We describe how consumer search costs and strategies are different in online
and offline markets, focusing on differences between Peapod and regular supermarkets, and
relating these differences to information availability when consumers make choices.
Differences in search costs: We start by partitioning search attributes3 into four categories:
(1) brand name, (2) price, (3) sensory attributes, and (4) non-sensory attributes (excluding brand
name). By sensory attributes, we mean those attributes that can be directly determined through our
senses, particularly, touch, smell, or sound, beforewe purchase the product, i.e., they are
searchable sensory attributes. For example, the design of a paper towel is a sensory attribute,
whereas the taste of a food item is not. By non-sensory attributes, we mean those attributes that
can be conveyed reasonably well in words (e.g., nutritional information). Thus, all non-sensory
attributes are search attributes. We consider price as a separate search attribute because it varies
across purchase occasions unlike other product-specific (non-sensory) attributes that are relatively
stable across purchase occasions.
An important difference between online and offline markets is that for attributes for which
information can be obtained in both media search costs are typically lower online than offline (see,
for example, Bakos 1997). Other things equal, information that is easier to search will be more
“available,” and hence, will have a larger influence on overall product evaluation (see, for
example, Kisielius and Sternthal, 1984). Several studies have also demonstrated that when
information is presented in a suitable format (e.g., brand × attribute matrix) as in Peapod, it
facilitates both consumer information acquisition and comprehension (e.g., Bettman and Kakker
1977; Russo et al. 1986). In online markets, it should take roughly the same amount of effort
(time) to obtain information on every listed attribute. At least, this is the case in Peapod. An
3
example screen display from Peapod is shown in Figure 1. All listed attributes, such as price, size,
fat content, and calories can be sorted and searched with about the same amount of effort. On the
other hand, when information is obtained offline, search costs may vary by attribute. For example,
in the traditional grocery store it is somewhat easier to search by price or unit price (e.g., find the
product with the lowest price, or find products that are on promotion), than it is to search by
nutritional information (e.g., find the margarine with the lowest level of fat). If there are attributes
that many consumers won’t typically search in the traditional stores because of high search costs,
but information about them is available in the online store, then we should expect price importance
to go down online. If there are no such search attributes, price importance may actually increase
because price search is somewhat less effortful online than offline.
--- Figure 1 here ---
We also assume that search costs for obtaining information about the non-sensory
attributes listed in the online market are lower online than offline. At the same time, search costs
for obtaining information about sensory attributes should be higher online than offline. Thus, we
expect offline consumers to have more information available about sensory attributes when
making choices, thereby making the importance weights for sensory attributes higher offline than
online. Likewise, we expect importance weights for non-sensory attributes to be higher online.
The total amount of information available in a shopping environment varies by product
category. For product categories that have a large number of sensory attributes (e.g., fruits and
vegetables) the offline environment has more total information available to facilitate consumer
choices. For product categories which have a large number of non-sensory attributes (e.g.,
industrial products) the online environment will offer more total information than the offline
environment. As suggested earlier by the “halo effect” argument, when the total information
available about price, sensory attributes, and non-sensory attributes is large, the importance weight
given to brand is reduced. Thus, in some product categories the importance weights given to
Differences in search strategies: Many online stores, including Peapod, allow consumers
to customize their shopping environment to make it more convenient for them to shop online.
This may reduce the availability of price information relative to non-price information. For
example, consumers in Peapod can generate and use “personal lists”4 of their most frequently
purchased items, items purchased on a previous purchase occasion, or items selected on other
self-selected criteria (e.g., “party list”). An example of a personal list is given in Figure 2. Personal
lists allow consumers to search within a restricted consideration set, instead of searching the entire
category. Thus, competitive products not on the personal list are removed from consideration
when consumers search using this feature. This is likely to insulate consumers’ frequently
purchased products from price competition. In sum, the use of personal lists should further
dampen the importance weight of price online, relative to other attributes. In Peapod, we can track
whether consumers purchased an item using their personal lists or whether they purchased it by
“browsing” the aisles (we refer to the latter as category-based purchase). This type of tracking
allows us to do separate analyses of category-based purchases, to more clearly assess the effects of
price in the online market.
--- Figure 2 here ---
In summary, recall from our earlier discussion that attribute-information that is not
available at the time of decision making will have smaller impact on overall evaluation.
Conversely, when the information on a relevant attribute is easier to access, that attribute should
have a larger impact on evaluation. In this section, we pointed out several important differences
between online and offline information availability: (1) Typically, more information on sensory
attributes is available offline and more information on non-sensory attributes is available online;
(2) Search costs are lower online for the attribute information that are displayed, the difference
being more pronounced for non-price attributes; (3) Some convenience features (e.g., personal
lists) available online may shift consumer focus from price to non-price attributes.
4
Hypotheses
We now state our specific hypotheses about the differential effects of the online medium,
based on the conceptual framework and arguments presented in the previous two subsections:
H1a: Sensory search attributes will have smaller impact online than offline.
H1b: Non-sensory attributes will have larger impact online than offline.
These hypotheses follow directly from the arguments of the previous subsection. Attributes
for which less information is available will have lower impact on product evaluations.
H2: Brand names have greater impact on choices in store environments where less total information is available for facilitating consumer choices.
We derive H2 using the following reasoning: When the total available information
decreases, the importance weight attached to brand name increases (note that the brand name
information is equally available both online and offline). The brand name becomes a surrogate for
attribute information that is missing or costly to acquire. For product categories with few sensory
search attributes (e.g., margarine), it is likely that more information is available online than offline
and brands becomes less important online than offline. For categories with some sensory
attributes (e.g., paper towels), we can expect more information to be available offline than online,
and thus, brands become more important online than offline.
H3: To the extent that attributes listed in the online store are relevant for choice, price will
have smaller impact on choices in online supermarkets than in traditional supermarkets.
Information search (for the attributes listed in the display) is less effortful online than
offline. Further, all attributes listed online are searchable with approximately equal effort. Thus,
online, we should expect relatively more non-price information to be available at the time the
consumer makes choice decisions. According to the information integration theory, as information
on more attributes becomes available, the relative importance weights of the attributes already
price, should decrease. Further, when consumers use the personal list feature, there is reduced
availability of competitive price information (specifically, the current prices of brands not on the
personal list are not available), which also diminishes the importance of price online. On the other
hand, if the product category has a large number of sensory attributes for which information is not
available online, the importance weights of the available attributes, including brand name and
price, may increase. However, due to the “halo effect” argument we presented earlier, it is likely
that the effects of missing sensory information will be to enhance the value of the brand, rather
than to increase price sensitivity. Thus, on balance, we expect that the combined effects of all
these factors would be to reduce price sensitivity online, leading to our hypothesis.
Past research suggests that loyal customers are less price sensitive (see, for example,
Narayandas 1998). We note here that although Peapod members are loyal to the service (i.e.,
many of our panelists buy most of their groceries from Peapod), this should have little effect on
price sensitivity in a particular product category, say detergents. In fact, most consumers shop for
most of their groceries in a single supermarket. Progressive Grocer (1995) estimates that, on
average, households typically spend about 75% of their budgets in one primary supermarket, about
the same as Peapod’s members.
For testing our hypotheses, we use data from three product categories for which we were
able to obtain information from both Peapod and comparable regular supermarkets: Detergent,
Margarine, and Paper Towel (we describe our data in more detail in the next Section). These three
categories have been previously used in academic research. Detergents and paper towels are
categories with frequent price promotions, while paper towels is also one of the most frequently
purchased categories. Nutritional information (fat) should be an important attribute in the
margarine category. If our hypotheses are valid, we would expect the following results in each
category:
• Liquid detergent: Here, the search attributes that affect choice include brand name, price,
promoted category in traditional supermarkets with frequent features and displays. However,
in the Peapod store, promotions involve only price cuts - there are no features (e.g., store fliers)
or “end of aisle” displays. Some variables that affect choice, such as package visuals and
scent5, are difficult to discern online. This category contains some sensory attributes that are
not as readily available online as offline, namely, refill package (these have a different kind of
package design than regular packages) and scent (the detergent boxes are not sealed, and hence
offline consumers may be able to make some assessment of the scent if they wish to).
Therefore, we expect refill packages and scent to have lower impact on choice online (H1a).
However, we do not expect these effects to be strong because these attributes are unlikely to be
important in influencing consumer choice. Because some sensory attributes are missing
online, we expect brand names to have stronger influence on choices online than in traditional
supermarkets (H2). Finally, we expect prices to have smaller impact online than offline
because of the reasons outlined earlier (H3).
• Margarine: In the soft-margarine category there are no searchable sensory attributes that affect
consumers’ perception of quality (Steenkamp, 1986). The major search attributes that influence
choice are brand name, price/promotion, and nutritional information (fat content). In traditional
supermarkets, consumers may use the brand name to infer relative fat content, whereas online,
the exact fat content of each SKU is displayed on the screen (see Figure 1). Thus, we should
expect fat content information to have more impact online than offline. Because of the online
availability of easy-to-search nutritional information, we expect that more total information
about attributes is available online than offline. Thus, non-sensory attributes should have more
impact online (H1b), while brand name should have less impact online (H2). Because more
total information is available online, prices should have relatively lower impact on choices
online (H3). Note that information on experience attributes (e.g., taste) and credence attributes
(e.g., health benefits) are missing both online and offline.
5
• Paper Towel: In the paper towel category, we can use brand name, price/promotion, and some
brand-specific attributes (e.g., plain white versus design, paper size) as explanatory variables.
Some sensory search attributes (e.g., the exact design on the towel, its softness) are missing
online. Therefore, we expect paper towels with designs (a sensory attribute) to have lower
impact on choice online, where the actual designs cannot be easily seen (H1a), and for brand
names to have higher impact online (H2). Finally, we expect lower price sensitivity online
(H3).
3. Methodology for Testing Hypotheses
Description of data: To fully understand the differences in choice behavior induced by the
shopping medium, we would ideally need to conduct a randomized experiment in which some
people are assigned to shop online and some are assigned to shop offline over an extended period
of time. Such an experiment would be expensive and impractical. A realistic and practical
alternative is to use longitudinal field data from separate samples of online and offline shoppers,
but account for self-selection differences between these samples in the methodologies we use for
data analyses. This approach is quite common in many scientific fields where random assignments
are not possible (e.g., labor economics; see Heckman 1976, 1979).
Not surprisingly, the composition of people who shop online is different from the
composition of people who shop offline. To account for these sample differences, we do the
following: (1) On aggregate, we try to match the samples on the education levels of the shoppers,
an observable criterion, that differentiates between early adopters of the online shopping medium
and the shoppers in traditional stores. Several surveys suggest that the online population is highly
educated. For example, over 50% of those surveyed by the “GVU surveys”
(www.gvu.gatech.edu/user_surveys) have college education or higher. (2) We incorporate within
the model a term to account for the fact that household income may affect price sensitivity; (3)
Even for these matched samples, and after accounting for observable differences, there may remain
this issue, we develop a new methodology to correct for selectivity bias in a choice model with
unobserved heterogeneity. We formulate a two-stage choice model in which customers first choose
the store type in which they shop (online versus offline), and then make brand choices within their
chosen store environment. In our estimation, we allow the first-stage errors to correlate with the
unobserved heterogeneity distribution of parameters in the second stage. In what follows, we
describe our methods in greater detail.
For our study, we use two of the most comprehensive data sets currently available. The
first data is from Peapod, where we tracked about 300 subscribers in the Chicago suburban area
from May 1996 to July 19976. The second data set is from IRI for 1,039 panelists who shopped in
the same grocery chain in the same geographic area, although not in the same supermarket as the
Peapod subscribers. (The supermarket from which Peapod customers are served is not part of the
sample of supermarkets that IRI uses to collect its panel data.) These data were collected between
September 1995 and November 1997 from three stores. Two of these supermarkets are located in
the same part of the metropolitan area as the Peapod store and all are in relatively affluent areas.
For the IRI data, we have individual-level demographic information for all the panelists. For the
Peapod data, we have aggregate demographics based on a survey conducted by the company, and
we have individual-level demographic data for only about 40% of the panelists. For the remaining
individuals, income data was imputed as the overall average for Peapod consumers in the Chicago
area.
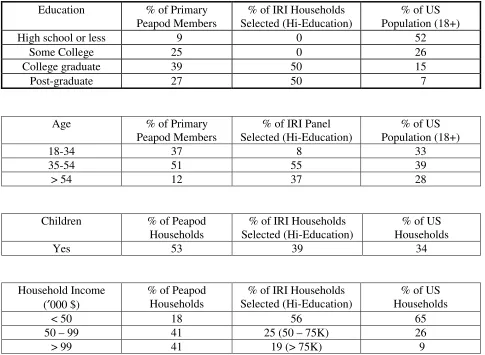
Table 1 summarizes some demographic information for the two samples that we used in
our analyses. An examination of Table 1 suggests that Peapod households are, on the average, ---
Table 1 here ---
6
younger, better educated, and more affluent than the US population. Also, a larger proportion of
Peapod households have children. To get some comparability between the samples used in the
analyses, we use education as a matching criterion and retain only those IRI households with at
least one member having graduated from college (denoted as IRI (H-E)). It was important to
match on the education criterion because only about 20% of the IRI sample had some college
education compared to about 95% in the Peapod panel. With regard to income, the Peapod sample
is much more affluent, even when compared to the IRI (H-E) sample.7 These income differences
could induce differences in choice behavior, because higher income households face substantially
different budget constraints. To account for the effects of budgetary considerations on price
sensitivity, we include a price-income interaction term in our models (see Kalyanam and Putler
1997). This is described in the subsections below.
Two-Stage Choice Model: Consumer price sensitivity is likely to be a function of income,
an observable characteristic of the household. However, other variables that remain unobserved
by the researcher are also likely to affect price sensitivity. When these unobserved variables do
not affect the choice of store type (online vs. offline), they would have the same distribution in the
Peapod and IRI (H-E) samples and, thus, cannot be a source of differences in behavior between
samples. However, it is likely that some of the unobserved variables may also affect store choice.
For example, some households where both adults are employed may have a higher “opportunity
cost of time,” due to availability of overtime work opportunities. To save time, these households
are more likely to shop online, and are also more likely to be less price sensitive than other
households with the same observable demographics (e.g., income). As a result, this self-selection
along unobserved characteristics during store choice may be responsible for differences in price
sensitivities between online and offline samples. This self-selection bias must be removed before
we can attribute differences in parameter estimates to differences in the store environment.
7
The outcome of store choice (i.e., shop online or offline) provides information about those
unobservable characteristics that may affect price sensitivities in brand choices. This potential
relationship is captured in a two-stage choice model. In the first stage, we use a binary probit
model of store choice (online versus offline), with utility for shopping online vs. offline being a
function of household income. In the second stage, we use a multinomial logit model of brand
choice with observed and unobserved heterogeneity. For reasons mentioned above, the errors
from the binary probit model are likely to be correlated with the unobserved heterogeneity in price
sensitivity (i.e., heterogeneity not induced by differences in observed characteristics, such as
income) during brand choice. We remove self-selection bias by taking this correlation into
account in the estimation procedure (described below).
Our methodology contains two novel aspects, which distinguish it from previously
proposed methods dealing with self-selection (Heckman 1976, 1979; Lee 1983; Trost and Lee
1984). The previous methods incorporate a simple regression model (i.e., with fixed coefficients) in
the second stage. This approach, with a second-stage regression model, has also been used in
Marketing (e.g., Krishnamurthi and Raj 1988). In contrast, in the second stage, our method
accommodates a multinomial choice model with unobserved heterogeneity. Also, while the previous
methods simply allow correlations between errors of the two stages, our method performs bias
correction on specific parameters (e.g., price sensitivity). As described below, we have to use more
sophisticated estimation methods to estimate our two-stage model.
First Stage Choice Model: The store choice model is a binary probit with the following
structure:
Uonline,i = γ0 + γ1⋅HHIi + ξi (2)
Uonline,i is the utility that consumer i gets from shopping online, rather than offline; HHIi is
household income of consumer i, ξi is standard Normal error. Consumer i chooses to shop online
if and only if Uonline,i>0. This model is estimated on the joint data from the IRI and Peapod
γˆ0 and γˆ1. Conditional on store choice, error ξi comes from a truncated standard Normal
distribution, such that
ξi > -γˆ0 - γˆ1⋅HHIi
if consumer i shops online and
ξi < -γˆ0 - γˆ1⋅HHIi
if consumer i shops offline. This constraint will be applied in the second stage choice model.
Second Stage Choice Model: To formulate the brand choice model, we follow Russell and
Kamakura (1993) and first decompose brand value (BV) into two components: a tangible
component (BTV) and an intangible component (BIV). The tangible value can be directly
attributed to levels of measurable attributes (e.g., fat per serving), while the intangible value
cannot be captured by the measured attributes. The impact of brand name on choice is captured by
the intangible value.
Let J and K be the number alternatives and brands, respectively, in the choice set. First,
consider product categories where each alternative in a choice set is associated with a distinctly
different brand (i.e., there is no distinction between a brand and a choice alternative and J=K).
This is the case in our analysis of the margarine category. Then, brand j’s utility during choice
occasion n is specified by a linear utility function (for ease of exposition, we suppress household
subscript i):
Ujn = BIVj + BTVj + ß·Xjn+ ejn j=1,…,J (3)
where Xjn is a vector of marketing variables (e.g., price, promotion) or household income (e.g.,
price × income), ß is a row vector of consumer sensitivities, and ejn is the random component of
Ujn. By relating the tangible component to measurable attributes, equation (4) becomes:
Ujn = BIVj + g.Aj + ß·Xjn+ ejn (4)
where Aj is a vector of attributes (e.g., fat content, presence of bleach), g is a row vector of
included in the analysis (i.e., the sizes of Aj and g ). Because of standard identification constraints,
only J-1-R brand-specific coefficients (i.e, BIVj ′s and elements in g) can be identified. Following
Kamakura and Russell (1993), we impose:
åj BIVj = 0 (5)
and
åj BIVj ·Ajr= 0; r=1,…,R (6)
The identification constraints in (5) and (6) ensure that brand intangible values are
orthogonal to brand-specific attributes. Kamakura and Russell (1993) estimate the parameters
sequentially, with sensitivities to marketing mix variables estimated first, and brand intangible
values and sensitivities to product attributes estimated second. We, however, estimate all the
coefficients simultaneously. This approach allows us to derive the statistical properties (based on
asymptotic standard errors and/or likelihood ratio tests) of the brand intangible values and
sensitivities to product attributes.
Second, consider product categories where there are several choice alternatives for each brand (i.e., J<K). Alternatives belonging to the same brand k now share that brand’s intangible
brand value BIVk (which replaces BIVj in equations (3) - (4)). If J-K≥R, as is the case in the
detergent and paper towel categories, all coefficients in the model are identified except for one
brand intangible value. To identify the model, we set the brand intangible value of the brand with
the largest market share to zero.
Note that in the utility specification given in (4), we cannot identify the importance weights
of the information integration model, αi, as specified in (1). The α parameters are subsumed
within the coefficients given in (4).8 There are also other factors that prevent us from directly
estimating and comparing the importance weights across the online and offline models: (i) the
information integration model specified in (1) does not have an error term, which we need for
8
Specifically, for linear utility models, the ith component of (1) is αiUi(Xi)=αi(siXi)=(αisi)Xi, where si is a
scaling factor for the utility measure. The corresponding term in the measurement model (4) is given by βiXi, so that
estimating choice models. (ii) The basic information integration model also does not incorporate
heterogeneity in preference structures, which we incorporate in our choice models. For these
reasons, we will compare the relative importance of attributes online and offline using other
measures, such as the estimated proportion of households exhibiting positive vs. negative
coefficients for a specific attribute, or their responses to identical promotions. We must point out
that the purpose of our analysis is not to test the information integration theory, but only to test the
implications of this theory as summarized in our hypotheses. For this objective, our approach is
appropriate.
Modeling Heterogeneity: We consider two types of heterogeneity: brand intercept
heterogeneity (referred to as preference heterogeneity by Papatla (1996)) and response
heterogeneity. The former characterizes the distribution of brand intercepts (i.e., brand intrinsic
values) across consumers whereas the latter characterizes the distributions across consumers of
such factors as price sensitivity and response to brand-specific attributes. We include intercept
heterogeneity in all our models. We selectively include response heterogeneity in our models
when both the online and offline samples are large enough to yield reliable estimates.9
We assume a multivariate Normal distribution of parameters and IID extreme value errors.
This yields a heterogeneous logit model, which we estimate using simulated maximum likelihood
method (Erdem 1996). However, in our case we also need to account for, and estimate the
correlation of first choice errors with unobserved heterogeneity in price sensitivity in the second
stage. We accomplish this by making random draws from the distribution of heterogeneity, which
in fact, is the basis for simulated maximum likelihood estimation. Specifically, we obtain draws
from the simulated heterogeneity distribution for price sensitivity through rejection sampling, such
that the realizations of our random draws are consistent with the corresponding store choice error.
A pair {price sensitivity coefficient, store choice error} is drawn from their unconditional bivariate
Normal distribution. If the draw yields a valid store choice error (i.e., ξi > -γˆ0 - γˆ1⋅HHIi for
9
consumers shopping online and ξi < -γˆ0 - γˆ1⋅HHIi for consumers shopping offline), the
corresponding price sensitivity is retained. Otherwise that particular realization is discarded. We
continue the process until we obtain the desired number of price sensitivities (here, 50). This
procedure yields estimates that are corrected for self-selection bias for the population parameters
(i.e., the means and covariance matrix of the Multivariate Normal distribution)10.
4. Results
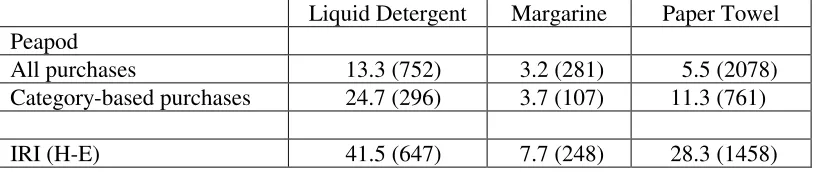
Brand switching: Table 2 presents the brand switching percentages in the three product
categories for the IRI and Peapod data. To facilitate interpretation, in Table 2 we report two sets
of percentages for Peapod for each product category. In Peapod, we first report results that include
all purchases regardless of whether the consumer purchased using the personal list or whether the
consumer purchased by browsing the category aisles. We then report results based only on
category-based purchases.
--- Table 2 here ---
For all three categories, a striking result from Table 1 is that there is less brand switching
online than in traditional supermarkets. At first glance, this may appear to be the result of the
personal list feature of Peapod, which allows members to place orders for their favorite products
without having to browse the category aisles. However, there is less switching in Peapod, as
compared to IRI (H-E), even when consumers browse a category to make their choices. Brand
switching differences are, therefore, probably due to stronger point-of-purchase influences in
traditional supermarkets, or because of sample differences between Peapod and IRI (H-E) samples.
We conclude that: 1) there is less overall brand switching in Peapod than in traditional
supermarkets, and 2) there is less brand switching when consumers use personal lists than when
they don’t.
10
We now analyze consumer choices in each category and assess whether the three
hypotheses proposed in Section 2 are supported by our results.
Liquid Detergent
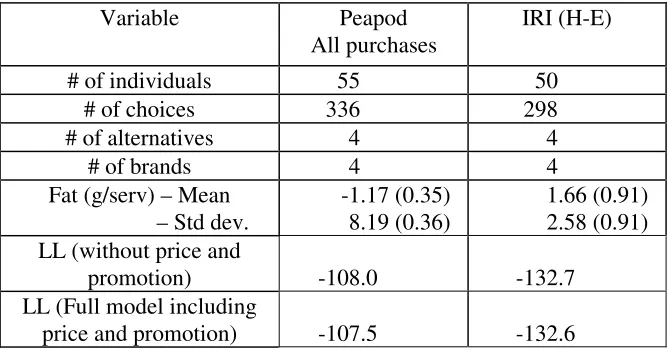
To specify the choice model to test our hypotheses, we included the following variables: 1)
Brand name, 2) Unit price, 3) Promotion11, and 4) Several category-specific attributes. The
category–specific attributes that the consumers could assess in both online and traditional
supermarkets are: 1) whether the detergent is scent free, 2) whether a bleaching agent is added, 3)
whether the detergent is a refill package, and 4) the size of the package. After eliminating SKU’s
that had a low number of choices in both types of stores, we were able to retain over 70% of the
choices observed in our data sets. We allowed most coefficients, including brand intercepts, to
vary across consumers, but we kept the coefficients for brand-specific attributes (e.g., refill
package) common across consumers. This allowed us to incorporate consumer heterogeneity,
while still having sufficient data points to estimate the heterogeneity distribution, especially for
Peapod’s category-based purchases.
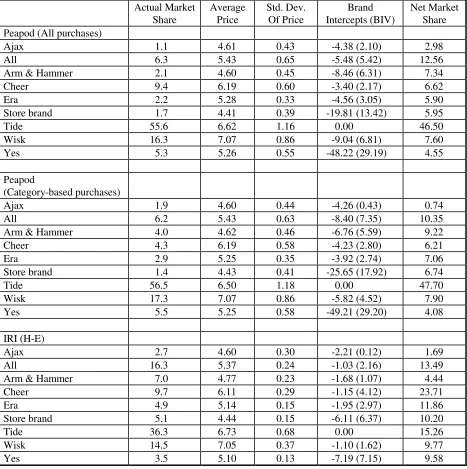
Tables 3 and 4 summarize the results. In Table 3, we present the coefficients of the choice
model, and in Table 4, we summarize the brand intercepts and other related information we use to
assess the value of brand names.
--- Insert Tables 3 and 4 here ---
The first three columns under “Peapod” in Table 3 contain summaries of our analyses of
the Peapod data. In Column 1, we summarize the bias-corrected estimates that are based on all the
purchases made at Peapod by the respondents. In Column 2, we summarize bias-corrected
estimates based only on purchases that the respondents made while browsing the category (i.e.,
excluding personal-list based purchases). For comparison purposes, in Column 3 we also report
11
In Peapod, the only promotions in the categories of interest were price cuts (as described in Figure 2). Recently, Peapod has begun including banner ads that appear in the appropriate category aisles (e.g., an ad for Colgate
the estimates obtained when we do not correct for selection bias (i.e., with correlations between
first stage errors and price sensitivities constrained to zero). Because the model uncorrected for
bias is nested in the bias-corrected model, and has one less parameter (the correlation coefficient),
we can use a likelihood ratio test to assess the effectiveness of the correction for bias (∆(LL) = 18
>> 6.63 = χ20.01(1)). This test, along with the statistical significance of the correlations between
store choice errors and price sensitivities confirm that bias-correction was necessary and
significantly alters the results. Moreover, since these correlations are positive, all else being equal,
households shopping online are less price sensitive than the entire population of households with
high education. The result for the IRI High-Education sample, reported in the last column, reveals
a much weaker selectivity bias, with a correlation coefficient of –0.43. This suggests that the
selection bias associated with IRI (H-E) panelists occurs in the expected direction, i.e., they are
slightly more price sensitive than the entire population of high-education shoppers.
Sensory attributes: We now compare the coefficients for category-specific attributes in the
Peapod and IRI (H-E) models.12 We see that online consumers are less likely to buy “Refill”
packages, which are more difficult to discern online – refills have a different type of package that
is more readily obvious offline. These results are consistent with our arguments about sensory
attributes, thereby supporting hypothesis H1a. Interestingly, consumers are equally likely to buy
scent free detergents online and offline. According to H1a, we should expect scent free detergents
to be more appealing online because consumers cannot ascertain the smell of a detergent online
even if they wished to. The lack of differential effects on this attribute suggests that scent is not an
important attribute influencing choice in this category, probably because visual cues are more
salient than olfactory cues in traditional supermarkets. Recent research suggests that about
two-thirds of all stimuli reach the brain through the visual system (Kosslyn, 1994).
12
Brand name impact: A visual inspection of Table 4 suggests that actual market shares in
Peapod are typically lower than in the IRI (H-E) data for low-share brands (e.g., All, Store brand).
Intuitively, this suggests that brand names have more impact online than offline in this category.
To assess the effects of brand names formally, we use the brand intercepts reported in the table.
These intercepts are measured relative to the largest-share brand (Tide), which happens to be the
same in both Peapod and IRI (H-E) data. By using the highest-share brand as the base, we can
improve the reliability of the intercept estimates with reference to the baseline. To facilitate
comparison of the intercepts across models, we compute an index called “Net Market Share,”
which is the market share of a brand computed from household-specific brand intercepts. It
represents the market share attributable just to a brand name, net of the effects of marketing mix
variables and the tangible attributes of the brand. Specifically, the net market shares are based on
the theoretical distribution of brand intrinsic values of each model. The net market share of brand i
represents the percentage of consumers in the market for whom BIVi > BIVj for all j ≠ i. We
compute these values by simulating 10,000 consumers based on the heterogeneity distributions of
brand intercepts.
Net Market Shares provide us an intuitively appealing way to compare the effects of brand
names on consumer choices across models. If brand names have no effect on choice (net of
brand-specific attributes and marketing mix variables), then Net Market Shares should be equal to
(100/J) for each brand j, with a standard deviation of Net Market Shares across brands being equal
to 0. On the other hand, if brand names have maximal impact, then one of the brands should have
a Net Market Share equal to 100, while the remaining J-1 brands have Net Market Shares equal to
0, giving a maximum standard deviation of Net Market Shares equal to J 1. J
100 −
We observe that Net Market Shares are large for stronger brands like Tide when compared
to weaker brands such as Arm & Hammer. The standard deviation of Net Market Shares in Peapod
is equal to 13.5 (all purchases) and 14.0 (category-based purchases). At the same time, the
have much stronger impact on choices online than offline. Thus, we find compelling support for
hypothesis H2.
Price effects: To identify the differences between online and offline price sensitivities, we
have to compare the Peapod (All purchases) model with the IRI (H-E) model. This is because,
even in a traditional supermarkets, a significant proportion of consumers make planned purchases
(Bauer 1995), i.e., they pick products from their “shopping lists” without browsing the entire
category, in a manner akin to “personal list” shopping of Peapod consumers.
In choice models, the coefficients for the same variable across models cannot be directly
compared because coefficients of a model are scaled by the variance of the errors (Swait and
Louviere,1993). However, ratios of coefficient estimates from the same model are
scale-independent and can be compared across models. Since Promotion in Peapod is roughly
equivalent to Feature in traditional stores, the ratio of these pairs can be used to understand the
differences in reactions to price promotions across the two markets. Using ratios for their mean
effects, we see that Price is more important than Promotion online (the ratio of their means is –
2.27/1.76= -1.29), but far less important than Feature in traditional stores (the ratio of their means
is –0.87/2.04= -0.43). When we consider only category-based purchases in Peapod, price impact
is slightly higher, as we would expect (Price/Promotion ratio = -2.30/1.47 = -1.56).
At first glance, the above results suggest that Peapod consumers are more price sensitive
than offline shoppers, and we should reject H3. However, these results do not necessarily mean
that the online medium (Peapod) makes consumers more price sensitive. Shoppers tend to respond
to the joint effect of price discount and promotions (i.e., Price discount and promotion in Peapod;
Price discount with Feature and/or Display in offline stores). Our findings indicate that online
consumers respond better to the price discount itself, whereas consumers in traditional stores rely
more on Feature as an indicator of a good deal. This result is consistent with our search cost
framework – in traditional stores, it is easier to search for deals based on featured products
(features being reasonable, but not perfect indicators of price discounts), whereas online it is
that promotions are stronger signals of price cuts in Peapod than in traditional stores. The
correlation between price and promotion in the detergent category in Peapod is –0.69. In contrast,
in the IRI data, the correlation between price and feature is –0.18 and the correlation between price
and display is also –0.18. This suggests that in Peapod, the price sensitivity results may be partly
due to a confounding of price and promotion effects. To compare the overall impact of price
promotions in the two store environments, we must take into account the joint effects of price and
promotion in Peapod and the joint effect of price, feature, and display in traditional stores. For this
purpose, we conducted a simulated experiment using model estimates.13 To facilitate comparison
across store environments, we compute the responsiveness (i.e., changes in market shares) to
identical price promotions in the two environments, when the population is described by
bias-corrected parameters of each model. The results are summarized in Table 3 under the heading
“Market share gain from price promotion.”14 We observe that the combined effects of price and
promotion is substantially higher in the IRI (H-E) sample than in the Peapod sample, suggesting
that overall price sensitivity is lower online than offline.
Also of interest, comparing the bias-corrected and uncorrected coefficients, we see that
price impact is smaller when we do not correct for bias (Price/Promotion ratio =-0.45/1.24 = -0.32
versus a ratio of –1.29 for the bias corrected coefficients). This suggests that if Peapod members
were to resemble the high-education segment in the general population, they would be more price
sensitive than the current members. At the same time, the uncorrected price sensitivity is lower
than the IRI (H-E) sample (Price/Promotion ratio equals -0.32 in Peapod versus -0.43 in IRI).
13
The use of simulated experiments to assess the practical implications of the coefficients of a choice model is standard (see, for example, Erdem 1996).
14
Thus, with the current membership base, online price sensitivity is somewhat lower than offline
price sensitivity. We also note that without the bias correction, we would have a smaller gain in
market share from online promotions (11.0 versus 16.5). As expected, the price×income
coefficients are positive suggesting that people with higher incomes are willing to buy higher
priced products.
Summarizing the above analysis, if we redefine “price sensitivity” as “promotion induced
price sensitivity,” we see that price sensitivity is smaller online than offline. Overall, while we do
not find direct support for H3 as stated, our broader interpretation of price sensitivity suggests that
H3 is in fact, supported.
In summary, in the detergent category, we find support for H1and H2, and indirect support
for H3.
Light Margarine Spread
The choice model used to test our hypotheses, included the following variables: 1) Brand
name and, 2) Fat15. We allowed both brand intercepts and the fat coefficient to vary across
consumers. In spread margarine category, brand names typically convey general fat content
information (e.g., Promise, Promise Light, and Promise Ultra suggest varying levels of fat
content). Federal laws regulate the use of such adjectives as “Light” and “Fat free” to describe
products. Hence, such labels convey meaningful information to consumers. However, within a
subcategory (e.g., light margarine), all brand names and associated labels convey the same
information about fat content. To better assess the impact of fat on choice, beyond what
consumers learn from brand names alone, we restrict the analysis to light margarine spread. We
retained all the choices in this sub-category. Unlike the detergent category, in this subcategory
each brand retained had only one choice alternative. Tables 5 and 6 summarize the results. In
Table 5, we present the coefficients of the choice model, and in Table 6 we report brand intercepts
and other related information needed to assess the value of brand names.
15
--- Insert Tables 5 and 6 here ---
Non-sensory attributes: With regard to hypothesis H1b, Table 5 shows that fat content, on
the average, negatively influences choice in Peapod, although the standard deviation of the
heterogeneity distribution is large suggesting that for many consumers, fat had positive impact on
choice. On the other hand, in the IRI (H-E) model, the mean effect of fat on choice is positive. At
first glance, the positive sign may seem to be counterintuitive. However, there is a perfectly
compelling explanation --fat is a surrogate for “taste,” something not observable in either the
online or traditional supermarkets. Thus, it appears that consumers generally prefer to buy the
tastier (i.e., fattier) spreads. In traditional supermarkets, consumers purchase margarine spreads
that are closer to their intrinsic preference for better taste, while in online store they overcome their
intrinsic preferences and purchase brands with lower fat content (e.g., Fleischmann). The
non-sensory attribute, fat, has a significant impact in the online market, supporting hypothesis H1b.
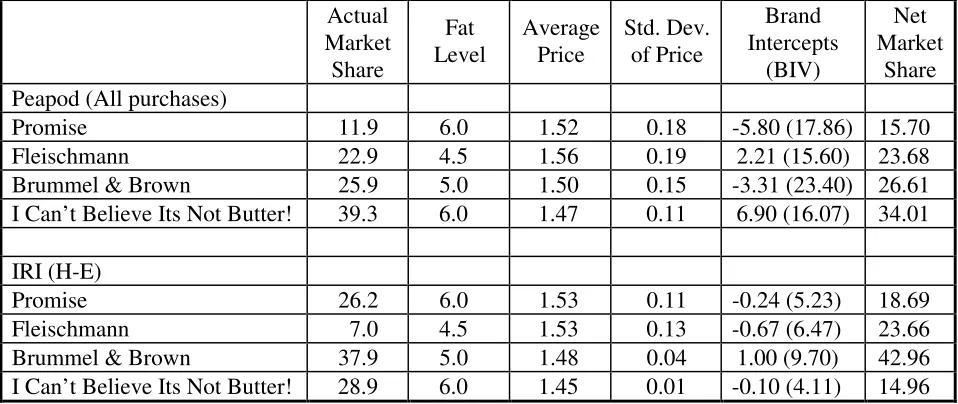
Brand name impact: Table 6 summarizes the actual and net market shares for assessing the
value of brand names. The actual market shares for the four brands are quite different in the two
store types, with a much greater proportion of online purchases for Fleischmann margarine, which
has lower fat content. The differences in market shares for Brummel & Brown require further
explanation. This is a new product, introduced only in November 1994, when some of the Peapod
panelists had already been members for several months. The market share for Brummel & Brown
in Peapod is 14.9% of category-based purchases and 35% of personal-list based purchases,
combining to give an overall share of 25.9 when all purchases are considered. Thus, we see that
its share of personal list-based purchases is about the same as its share in IRI (H-E) market. This
suggests that the online market environment does not help generate trial, but once consumers put a
product on their personal lists (perhaps after a careful evaluation), they tend to repeat purchase at a
higher rate. This also suggests that an online environment may not be a good medium to test
The standard deviation of net market shares is 7.57 in Peapod (all purchases) and 11.81 in
IRI (H-E) sample. Thus, we find support for H2. The differential effects of brand name is not
strong, and we suspect is probably due to brand names not being major determinants of choice in
this category, in comparison to the unobserved taste factor.
Price effects: Because price is insignificant in both Peapod and IRI models, we cannot
assess the validity of hypothesis H3 in this category. In retrospect, the lack of a price impact in
this category is not surprising. These products are used as spreads and not for cooking. Because
spreads are not mixed with other ingredients, their taste is directly discernable and should be an
important determinant of choice. This suggests that price may not be a major factor in purchase.
Summarizing our findings for the margarine category, we were unable to test H3, and
found support for H1 and H2.
Paper Towel
The choice model used to test our hypotheses included the following variables: 1) Brand
name, 2) Unit price per 100 sq. ft., and 3) Promotion. In addition, we included several
category-specific attributes, namely, whether the paper towel was plain white or whether it had printed
designs, and whether the consumer can tear off half a sheet instead of a whole one (Select-Size).
For these two attributes there is differential information online versus offline. Peapod customers
know if an alternative has a print design or is white. However, the design of the print, which is
observable offline, remains unobserved by Peapod shopper. Similarly, Peapod customers know if a
certain paper towel allows tearing off half-sizes, but do not know what the size of the full-size
sheet is. Thus, some customers may be concerned that half-sizes may be too small for their needs.
Given these conditions, one would expect these two attributes to be less important online than
offline. After eliminating SKU’s that had a low number of choices in both types of stores, we
could retain over 75% of the observed choices in our data sets. We allowed brand intercepts and
all coefficients relevant to our hypotheses to vary by consumers. Tables 7 and 8 summarize the
results. In Table 7, we present the coefficients of the choice model, and in Table 8, we summarize
--- Insert Tables 7 and 8 here ---
Sensory attributes: The effects of category-specific attributes on choice are what we
hypothesized. Online consumers are more likely to avoid print designs and select-size alternatives
than consumers in traditional markets are (see sign, magnitude and statistical significance of
coefficients in Table 7). These differences become less pronounced when consumers purchase by
browsing the category aisles, which is not surprising since in that case they seem to pay increased
attention to price promotions (see differences in market share gains due to price promotion in
Table 7). The heterogeneity distribution for printed design has a large standard deviations (Peapod
mean = 1.87, standard deviation = 4.91; IRI (H-E) mean = 0.32, standard deviation = 1.43),
suggesting considerable heterogeneity in preferences for this attribute. In sum, the results for
paper towel support hypothesis H1b. Of interest is the fact that half-sheet paper towels were
introduced only in June 1992, and some Peapod members may not have become familiar with it
through offline purchases. This may also account for its lower preference online, similar to the
lower market share online for the relative newcomer Brummel & Brown in the margarine category.
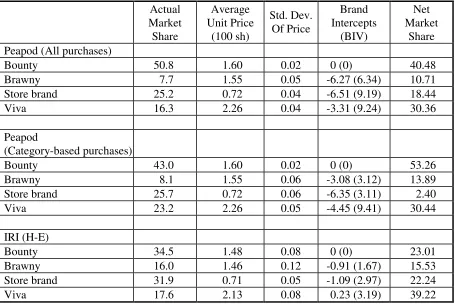
Brand name effects: The actual market shares and the net market shares for the four brands
are quite different for the two store types. Unlike detergent, the store brand does well in this
category in both Peapod and in traditional supermarkets. The standard deviation of net market
shares are: 13.11 in Peapod (all purchases), 22.08 in Peapod (category-based purchases), and
10.06 in IRI (H-E). This indicates clearly that brand names are more valuable online than in
traditional supermarkets, providing strong support for H2. Of interest is the result that Viva has
significantly higher Net Market Share than actual share in all three models. In a recent review of
paper towels, Consumer Reports rated Viva the best paper towel (Consumer Reports, 1998). This
provides face validity to our measure of brand value computed from Net Market Share.
Price effects: The results here mirror what we found in the detergent category. Bias corrected
Price/Promotion ratio is higher in Peapod than in IRI (< -100 versus –1.1). Also, as expected,
category, it appears that Promotion is a better signal of price cuts in Peapod than in IRI (H-E). The
correlation between promotion and price is –0.61 in Peapod, whereas the correlations in the IRI
(H-E) sample are –0.35 between price and feature and –0.09 between price and display. We also
see that “Market share gain due to price promotion” is higher offline than online (26.5 in IRI and
14.1 in Peapod). In sum, as in the detergent category, we find only indirect support for H3.
Summarizing our findings for the paper towel category, we found support for H1 and for
H2, but only indirect support for H3.
5. Discussion and Conclusions
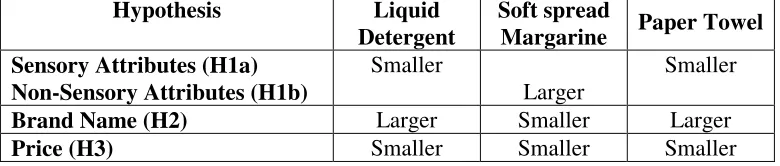
In Table 9, we summarize our key findings. In Table 9a, we summarize our
category-specific hypotheses, and in Table 9b, we report the overall nature of the support we found for our
hypotheses. Except for H3, where we found only indirect support, our analyses and results support
our hypotheses. We submit that neither the hypotheses nor the implications are obvious a priori.
--- Insert Table 9 here ---
Many executives are very concerned that online consumers will focus on price and this will
result in strong price competition (See for example, the Booz Allen survey reported in Financial
Times, February 9, 1998). At first glance, our results seemed to support this contention. But,
further analyses indicated a more complex story, at least with respect to grocery products. First,
people currently online may not be as price sensitive as the general population. Even if the online
population becomes comparable to the general population, the combined effects of price and
promotion seem to be stronger in regular stores than in online stores. Even after accounting for the
fact that online promotions are better signals of price reductions, we find that offline promotions
induce larger changes in brand choices. This is partly because of the low correlation between
point-of-purchase (POP) activities and price in traditional supermarkets. It is likely that
consumers in the traditional supermarkets are buying featured products even when there is little
market share changes due to price promotion. Thus, the price sensitivity coefficients reported in
the paper are NOT induced by differences in income across the two samples. Nevertheless, we
need controlled field studies in online markets to tease out these effects more precisely – a
challenging task we leave for future research.
There is also concern in some quarters that online markets would “commoditize” brands,
thereby reducing the value of brand names (Burke 1997). Several executives have suggested to us
that online markets make it more difficult to differentiate products, and will therefore reduce the
value of brand names. Our study suggests that brands can have more or less impact online than in
traditional supermarkets depending on the extent of relevant information available for making
choices in these markets. When more total information about product attributes is available
online, brand names become less valuable. This is particularly likely if the product category
contains few sensory attributes (e.g., margarine). Based on our results, we expect brand names
will be more important online in product categories that are differentiated on brand image and
other attributes that do not lend themselves to be easily summarized by an online store (e.g.,
fashion products). On the other hand, brand names will be less important online for functional
products (e.g., fax machines, computers) for which online stores can give detailed attribute
information, as well as comparative information, online.
Finally, our results clearly suggest that sensory attributes, particularly visual cues, will
influence choice to a lesser extent online than offline. This implies that marketers who rely
strongly on visual cues to influence offline purchases of their brands, may be disappointed by the
level of online sales that they are able to generate.
We see the contributions of this paper along three dimensions: (1) We developed a
conceptual framework that will help researchers to better articulate how and why online choices
may differ from offline choices. (2) We have proposed a few methodological innovations to help
researchers empirically compare offline and online data, even though the two samples may not be
equivalent. In particular, our two-stage choice modeling framework and new concepts, such as net