Utilizing Multi-Sensor Fire Detections to Map Fires in the United States
S.M. Howard a*, J. J. Picotte b, M. J.Coan c
a
U.S. Geological Survey (USGS) EROS Center, 47914 252nd Street, Sioux Falls, South Dakota, [email protected] b
ASRC Federal InuTeq, EROS Center, 47914 252nd Street, Sioux Falls, South Dakota, [email protected] c
Stinger Ghaffarian Technologies, EROS Center, 47914 252nd Street , Sioux Falls, South Dakota, [email protected]
KEY WORDS: Forest Fire, Mapping, Change Detection, Landsat, Multisensor, Data Mining
ABSTRACT:
In 2006, the Monitoring Trends in Burn Severity (MTBS) project began a cooperative effort between the US Forest Service (USFS) and the U.S.Geological Survey (USGS) to map and assess burn severity all large fires that have occurred in the United States since 1984. Using Landsat imagery, MTBS is mandated to map wildfire and prescribed fire that meet specific size criteria: greater than 1000 acres in the west and 500 acres in the east, regardless of ownership. Relying mostly on federal and state fire occurrence records, over 15,300 individual fires have been mapped. While mapping recorded fires, an additional 2,700 “unknown” or undocumented fires were discovered and assessed. It has become apparent that there are perhaps thousands of undocumented fires in the US that are yet to be mapped. Fire occurrence records alone are inadequate if MTBS is to provide a comprehensive accounting of fire across the US. Additionally, the sheer number of fires to assess has overwhelmed current manual procedures.
To address these problems, the National Aeronautics and Space Administration (NASA) Applied Sciences Program is helping to fund the efforts of the USGS and its MTBS partners (USFS, National Park Service) to develop, and implement a system to automatically identify fires using satellite data. In near real time, USGS will combine active fire satellite detections from MODIS, AVHRR and GOES satellites with Landsat acquisitions. Newly acquired Landsat imagery will be routinely scanned to identify freshly burned area pixels, derive an initial perimeter and tag the burned area with the satellite date and time of detection. Landsat imagery from the early archive will be scanned to identify undocumented fires. Additional automated fire assessment processes will be developed. The USGS will develop these processes using open source software packages in order to provide freely available tools to local land managers providing them with the capability to assess fires at the local level.1
*Corresponding author.
1. INTRODUCTION 1.1 Background
On October 1, 2014 the Monitoring Trends in Burn Severity (MTBS) project released 563 fire assessments to the MTBS.gov website. This release brings the total to 18,497 fires that have been mapped across the United States and Puerto Rico by the US Forest Service and the US Geological Survey. In 2006, the Wildland Fire Leadership Council tasked MTBS to use Landsat data to assess burn severity for all known large fires that have occurred after 1984 on all land ownerships across the United States (Eidenshink, et al. 2007). In the context of MTBS, ‘large’ means greater than 500 acres in the east and 1000 acres in the west. The word ‘known’ is also critical as we need to know where and when a fire occurred in order to map it. Initially MTBS relied primarily on federal fire occurrence information; later state records were increasingly used. The fire occurrence data (FOD) are used to guide the analyst’s search for Landsat imagery suitable for each fire assessment. As with any human-compiled database, the FOD contains errors. The accuracy of size, date, and location information determines if a fire is considered for mapping and if it can be found on a Landsat scene. At its inception, the likelihood of errors was understood and MTBS was required to map any undocumented large fires that were discovered in the process of mapping known fires. Over 2700 undocumented fires have been mapped. However, the impact of adding state fire occurrence databases was not
initially understood. As fire occurrence record keeping improved, the MTBS work load increased.
Fire occurrence information from 2004 was used to estimate the scope of the MTBS project. There were 1220 records for 2004, with 203 from state records (16%). In 2006 there were 3850 records, with 980 from state records (25%) and in 2010, there were 3164 total records of which 1260 were state records (40%), 931 from Florida alone. The vast majority of the state records are for prescribed fires. Each fire record must be reviewed by an MTBS analyst. Merging multiple fire occurrence databases from federal and state sources often results in the duplication of fire occurrence information. More records and duplicate records require more analyst time to assess them. Efforts are currently underway to address the consolidation of fire occurrence information and to reduce duplication and other errors. However, due to shrinking budgets, it was necessary for MTBS to recently abandon the assessment of state-recorded prescribed fires as there are too many fires to be handled using existing methods and resources. Clearly, a more efficient method is needed to effectively capture and independently document all fires: large, small, prescribed, wildland, known and unknown; across the landscape. Assessing more fires will allow for an improved understanding of the impact of fire and more informed land management decisions.
1.2 NASA Applied Sciences Program for Wildfire: Supporting Decision Makers
The NASA Applied Sciences Program is supporting projects to leverage Earth observations and geospatial products in decision support activities related to wildland fires. The NASA program recently decided to support continued applications research in the project “Utilization of Multi-Sensor Active Fire Detections to Map Fires in the United States.” In the case of this NASA- supported project, decision support is targeted at two levels. At the national level, our process will eliminate many manual procedures and help MTBS analysts more efficiently identify and order suitable Landsat imagery for individual fire assessments and then process the imagery to create final assessment products. At the local level, using open source software we will develop a suite of freely available tools to enable local land and fire managers to similarly use and process satellite data to support their fire management decisions.
MTBS relies heavily on manual processes but is striving to automate where possible. Prior to 2013, MTBS used the FOD information from the previous year to guide the mapping program. This time lag was due to the need for individual agencies to finalize the current year’s fire records and for MTBS to compile results. Recently, the USFS implemented an automated process, the Event Tracker Database, to collect and compile agency fire reports (ICS 209) in real-time which has eliminated substantial delays. Fires that require an initial assessment can be now completed in the year of occurrence rather than being delayed until the following year.
The MTBS mapping protocol involves an analysis of a pre fire image in conjunction with a post fire image in order to assess the changes due to fire. The current scene selection process is labor intensive and compromised by low resolution online browse imagery: fires near the MTBS size threshold are difficult to see and so confirm that the FOD point actually falls on a fire in the image. The current alternative is to order and download all possible scenes and view them with appropriate image processing or GIS software. Once scenes are downloaded from the Landsat archive, they must be calibrated to reflectance, reprojected from UTM to Albers and the Normalized Burn Ratio (NBR) computed.
2. THE VISION
2.1 Process Improvement
To improve MTBS processes, our project is leveraging satellite-derived active fire detections from the Hazard Mapping System (HMS) as a source of near-real-time fire occurrence information. We also developed a Burned/Not-Burned (BNB) algorithm to scan entire Landsat images to find recently burned areas and delineate them. These two sources of information can help identify undocumented fires, and the BNB process will automatically generate an initial perimeter of the fire. Our process will go further to automate Landsat scene ordering and processing.
Based upon fire occurrence information derived from existing records or determined by the HMS/BNB process, we automatically determine which Landsat scenes should show the fire (post fire scenes) and potential pre fire scenes. The scene IDs are written to a text file along with fire extent information (either reported area or derived from the BNB process). This
information is entered into the USGS Earth Resources Observation and Science Center Science Processing Architecture (ESPA) system which places an order for the “candidate” scenes, clips each scene to a bounding box defined by the fire extent, and creates the required reflectance corrections: Top of Atmosphere (TOA) or Surface Reflectance (SR), and the Normalized Burn Ratio (NBR). The result of the automated process is a package of candidate pre and post fire Landsat images and derived imagery clipped to the area of the fire.
Using a “viewer tool” the analyst reviews the candidate imagery and picks the best pre and post fire imagery for a burn severity assessment. The viewer tool links to a database of the fire occurrence information and records the analyst’s decisions regarding the burn severity assessment: scene selections, assessment type, vegetation type, etc. When all the processing decisions have been made and recorded, the interface kicks-off automated processing to create the differenced NBR (dNBR), determine the dNBR offset (a calibration factor), create the managers, the processes outlined above are being developed using open source software (QGIS, PostgresSQL. Any use of trade, firm or products is for descriptive purposes only and does not imply endorsement by the U.S. Government). We see the opportunity to package many of the automation scripts and tools for installation at a local level in order to process HMS and automatically creates burned area polygons from Landsat imagery and labels each polygon with a start date derived from HMS data and the date the fire polygon is first seen on a Landsat scene. This information is used to automatically search the Landsat archive and stage candidate scenes that could potentially be used by MTBS to assess burn severity. Each candidate scene is clipped to a bounding box derived from the burned area polygon. All candidate scene clips (at full resolution) are stacked in a KML file for review and selection by MTBS analysts. The optimal pre fire and post fire imagery is selected by the analyst, and automated processes are employed to create the suite of MTBS products, including a preliminary burn severity assessment that is reviewed and approved or revised by the analyst.
3.1 Study Area
For our initial study we partnered with key U.S. Forest Service personnel in Florida. We obtained the historical fire records for three national forests in Florida: the Apalachicola, Osceola, and Ocala. These forests are located within three Landsat Path/Rows in the Southern Coastal Plain, a region with a long history of prescribed burning for clearing undergrowth, reducing hardwood encroachment into pinelands, and promoting various wildlife species. Hundreds of prescribed
fires occur each year within this area. The abundance of undocumented prescribed fire and the resulting challenges presented to MTBS mapping procedures was a primary reason for selecting the study area. The fire community recognizes that it is necessary to assess these prescribed fires and the many smaller wildfires to better understand the amount and impact of fire in the United States. Improved processes offer the potential to assess more and possibly smaller fires than would be possible under current MTBS burn severity mapping protocols and methodologies.
3.2 Inputs
3.2.1 Hazard Mapping System Fire Detections: NOAA’s Hazard Mapping System (HMS) utilizes satellite-based fire and smoke detections that are collected daily by GOES, AVHRR, and MODIS sensors. The detections are logged as point locations and utilized by NOAA’s Air Resources Laboratory to model the next 48 hour’s potential smoke emissions and dispersion across North America (Ruminski, Kondragunta, Draxler, & Zeng, 2006). Frequent observations, as often as every 15 minutes (Zhang, Kondragunta, & Quayle, 2011), allow for a more timely and spatially complete record of fire occurrence than is available from federal and state fire records. Daily HMS observations have been archived since 2003, which will support retrospective assessments. Operationally, the daily observations are quality checked by NOAA HMS analysts to remove commission errors and add fires visible within the imagery that were not detected by the sensors. These data are posted weekly and available online for 6 months. All post-2011 HMS data were downloaded from the HMS website (http://satepsanone.nesdis.noaa.gov/FIRE/fire.html). HMS data prior to 2011 were obtained from NOAA.
3.2.2 Landsat-Derived Burned Area Polygons: Our original proposal discussed an approach using HMS to identify potential burned areas and subsequently identify suitable Landsat scenes for fire assessment and perimeter delineation. We also needed a method to identify fire activity prior to the availability of HMS data. During the development phase of this project, the novel burned/not-burned methodology was developed to automatically generate burned area perimeters from Landsat scenes. A number of previously mapped MTBS fires in our three Paths/Rows of interest were selected. The fires were chosen for their variety of vegetation types, phenological seasonality, severity ranges, and geographic distribution over these Path/Rows. Landsat acquisitions were chosen that best represented the freshly burned extent of each fire. Each fire was sampled throughout its range of burn severity as well as surrounding unburned vegetation. All samples were combined into a training dataset to create a Cubist model, which is a collection of multivariate linear models (Cubist; Rulequest, 2004). The Cubist model was then run against the Landsat acquisitions to create a “likelihood estimate” that each pixel was recently burned. The continuous estimate (1-100) was thresholded at a selected value (i.e., 95 and above) to standardize all the image estimates and create a binary thematic product identifying burned pixels in each Landsat acquisition (1984-2012). The burned area perimeters augment the HMS detections: accurate fire perimeters are delineated using Landsat, validated by the presence of an HMS point, and labeled with the correct fire date from HMS.
Clouds and shadows obscure fires. Our approach combines all available Landsat acquisitions to fully delineate a fire perimeter. The burned area polygons provide spatially accurate data, but
the temporal resolution is limited to 16 or 8 days depending on satellite availability. Using the capabilities of spatially enabled open source PostgreSQL/PostGIS software, we combine the temporal strengths of the HMS data and the spatial strengths of Landsat to determine the start date and spatial extent of a fire.
3.2.3 Open Source Software: One goal of this effort is to freely distribute project-developed data processing scripts. We utilized open source (http://www.osgeo.org) PostgreSQL/PostGIS (http://www.postgresql, http://postgis.net) to process all data and Quantum GIS (QGIS; http://www.qgis.org) to view the data. PostgreSQL is a relational database that can be spatially enabled by coupling it with the PostGIS extension. Complex queries can be performed in PostgreSQL to determine the spatial relationships of objects.
3.3 Processing
Landsat image processing methods currently used by MTBS are time consuming. Each terrain corrected (L1t) scene is freely downloaded from the USGS EROS Center image archive by the analyst. The scene is then corrected to top of atmosphere reflectance, reprojected from UTM to Albers Equal Area, and processed to create a Normalized Burn Ratio (NBR) image. To increase our image processing throughput, the USGS Land Satellites Data System Science Research and Development group used EROS Science Processing Architecture (ESPA) system and prototype computer code to process 1,800 Landsat scenes covering our study area. All Landsat 5 TM (Thematic Mapper) and Landsat 7 ETM+ (Thematic Mapper Plus) reflectance images, water, cloud, and cloud shadow masks were created. These Landsat scenes were used to determine possible burned areas (Landsat burned area delineation described above).
We utilized PostgreSQL/PostGIS queries to determine whether HMS points were within 1,500 m of the Landsat-derived fire perimeters and if they were correctly associated with the proper Landsat acquisition (i.e., dated no more than 8 days prior to the Landsat acquisition first showing the burned area polygon). It is likely that a fire could be obscured by clouds in several Landsat overpasses before it is visible. More sophisticated queries can be created to determine precise HMS dates; however, the burned area polygons are sufficient to identify a “probable” fire.
3.4 Results from Florida Study Area
Approximately 1,800 Landsat scenes (1984 – 2012) and 88,000 HMS points (2003 – 2012) were assessed for World Reference system 2 (WRS2) Paths/Rows 16/40, 17/39, and 18/39. Within these Paths/Rows, we identified approximately 300,000 burned area polygons. The average size of these fires was 257 acres, and almost 18,000 fire polygons exceeded the MTBS 500-acre minimum threshold. By comparison, MTBS mapped 1,400 fires covering the 1984 -2011 time period. This difference suggests there are many unreported prescribed fires above the MTBS size thresholds. However, the Southeast region is probably a “worst case scenario” as prescribed fires are not nearly as common in the western United States. Additionally, it is clear this approach identifies many smaller fires; however, we have not yet determined the minimum fire size threshold that can be reliably delineated and mapped.
To determine the reliability of the results, we evaluated data from the U.S. Forest Service National Forests of Florida:
Apalachicola, Ocala, and the Osceola. These forests were chosen because of their complete burn histories (1984-2012) and because of the large number of prescribed burns conducted during this time frame. We found that the fires identified by the burned area delineation process closely matched U.S. Forest Service records. We identified more MTBS-sized fires than were assessed by MTBS (Figure 1), and for the post-2003 fires,
Figure 1. Landsat-derived burned area polygons (orange) and their proximity to MTBS-derived perimeters (black). Yellow circle denotes perimeter shown in Figure 3.
the dates of occurrence were effectively determined by HMS (Figure 2). Further, the burned area perimeters better represented the overall fire patterns and should provide more accurate estimates of burned acreage as MTBS analysts do not (in the interest of time) manually delineate unburned islands within the overall perimeter (Figure 3).
Figure 3. Enlarged view showing more precise delineation of the fire burned area and unburned islands within the perimeter.
For MTBS, it is necessary to identify the best pre fire and post fire Landsat images in order to create the burn severity assessments. In the past, MTBS analysts reviewed low resolution browse imagery. This approach has been improved utilizing the previously described ESPA processing system, which searched the Landsat archive and retrieved candidate scenes and clipped them based upon a bounding box derived from the automatically generated burned area perimeter. The full resolution image subsets provide analysts with a more detailed view of the data than was previously possible with the low resolution browse images.
Figure 2. Example of 925 acre burned area polygon derived from Landsat scene dated 7/6/2012 and corresponding HMS fire detections from 6/29/2012.
3.5 MTBS Viewer Tool and Automation
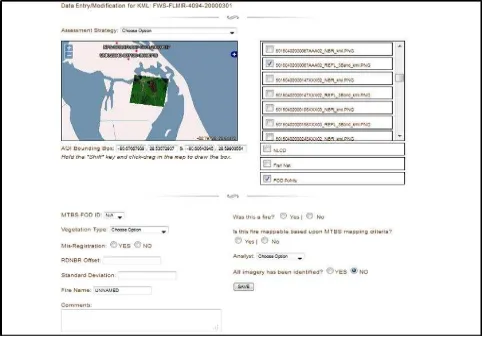
All of the candidate full resolution Landsat image clips are viewed with the MTBS QuickLook tool which was developed with MTBS funding. The QuickLook tool (Figure 4.) allows analysts to rapidly review the Landsat clips at full resolution to determine if the detection is in fact a fire and then to record the optimal scenes for the severity assessment, whether the assessment type will be initial (within several months) or extended (at peak of green the following season), and the vegetation type in which the fire occurred. All information entered into the QuickLook tool is stored in the Event Mapping Tool database developed by USFS/Remote Sensing Applications Center.
ESPA processing eliminates many of the image preprocessing steps outlined in the above. Currently, MTBS burn severity processing scripts are run manually after analysts select and order the optimal scenes and make other critical processing decisions (e.g., initial versus extended). These critical analyst processing decisions collected by the MTBS QuickLook tool will be used to automatically drive the MTBS process using the existing scripts: creation of the dNBR and RdNBR images, which form the basis of the thematic burn severity map.
Furthermore, we have completed regionally based analyses of all 1984-2010 historical MTBS analyst-determined burn severity breakpoints for each vegetation type (NLCD 2006) throughout the United States to determine the regional average burn severity breakpoints for each vegetation type. These breakpoints will be used to automatically create preliminary MTBS burn severity products. MTBS analysts will then review
the preliminary/default burn severity products using the next iteration of the automation process.
3.6 Problems Encountered
After reviewing the burned area products, we determined that some of the burned pixels were within urban areas, harvested cropland, and seasonally flooded areas. MTBS is not concerned with cropland and these areas can be set aside for anyone who has interest in burnable agriculture. However, some commission errors occurred, apparently due to confusion with freshly plowed agricultural ground and special types of wetland vegetation in senescence. No effort has been made at this time to separate these from the truly burned areas. A refinement of burned croplands versus plowed ground, and burned emergent wetlands versus senescent vegetation, are matters to be dealt with in the next phase of the study. A majority of the urban area confusion appears to have a seasonal (solar angle) component that might be addressed by application of a seasonally-tuned Cubist burned area model. This will be investigated in the future.
The automation of all SQL queries using Python resulted in unforeseen problems within the PostgreSQL database. Thousands of automated individual queries substantially slowed the program. We alleviated this problem by configuring the database memory allocation to work better with our computer configuration and manually cleaning the databases. Production speed was subsequently increased; however, we determined that the queries still take an excessive amount of time. We will need
to optimize the processing queries during the next phase of the study to increase processing efficiencies.
4. FUTURE ACTIVITIES
HMS fire detections, combined with the automated delineation of fire perimeters from Landsat, will begin a process to efficiently search and order Landsat imagery needed to assess burn severity. This process will aid MTBS analysts at USGS EROS and USFS/RSAC when making decisions regarding the selection of the optimal scenes for burn severity assessments.
Initial work focused on a process to identify fire locations and dates to feed an automated process to identify, order, process, and create Landsat image clips centered on the fire. This work has been accomplished. To make these protocols operational on a national level during the second phase of this study, several modifications will need to be made to the fire perimeter and burn severity processing. We need to investigate refinements to the Cubist models to reduce commission errors. Procedures will be further automated where possible to reduce the amount of time from fire occurrence to delivery of MTBS products, including reducing the time to identify a fire that needs to be mapped and the time required by an MTBS analyst to map an individual fire.
The next phase of our work will require the integration of the HMS/BNB fire occurrence process into the existing Event Tracker Database and the Event Mapping Tracker. Creating the Landsat image clips will provide an easy way to review and Figure 4. MTBS QuickLook viewer tool. The interface displays full resolution Landsat subsets, yearly
NDVI curves, and provides a pick-list to record analysts’ scene selections and processing decisions.
select the optimum Landsat imagery for burn severity assessment. The analyst will select the best pre fire and post fire scenes and make other decisions related to the severity analysis (cover type, assessment type, etc.). All analyst selections will be saved directly in a PostgreSQL database, which will drive scripts to automatically process the data to create the required MTBS outputs including the dNBR and RdNBR images. Additionally, analysis of the MTBS database of over 17,000 burn severity assessments determined regional average dNBR thresholds for each vegetation type throughout the United States. We will develop an automated script to apply “default” breakpoints to fires in the National Forests and assess the validity of the thresholds. We have also garnered the support of the Grand Canyon National Park as a second study area to evaluate the validity of the process in the southwest region of the country.
Operationally, the thresholded dNBR image will be reviewed by MTBS analysts to ensure that the default breakpoints represent the severity on the ground. If an adjustment is needed, the analyst will revise the thresholds and rerun the thresholding script. Existing processes will then create metadata and bundle all of the imagery and the perimeter shapefile for distribution on the MTBS website (http://www.mtbs.gov).
As mentioned earlier, it may take up to 2 years after fire occurrence before the MTBS assessment is distributed (assessment of all fires from 2012 began late August 2013). These revised processes will enable the near-real-time mapping of many fires (i.e., those requiring an initial assessment: 75% in 2010). We will implement and test our process in the context of near-real-time mapping for selected areas in the United States: the southeast and southwest. The processes developed at USGS EROS will be transferred to the USFS/RSAC for testing and review. We will devise a systematic assessment of historical and current HMS and Landsat data to evaluate the magnitude of unreported fires at various time frames across the United States.
Our choice of open source software will allow us to freely distribute tools to fire ecologists and others with regional and local interests. Use of tool developed with open source software will allow users to assess fires of local interest that may fall below MTBS size thresholds or not be processed by MTBS on a timely basis. For example, local users can monitor HMS fire detections for their area of interest. Detections can be confirmed through local contacts or verified by subsequent Landsat acquisitions. Once confirmed, local users will have the tools available to conduct an assessment. We expect to be able to deliver the following fire assessment applications:
1) Automate HMS points for downloading and processing for an area of interest
2) Process Landsat imagery to Top of Atmosphere or Surface Reflectance, compute NBR, and create burned area polygons (after free Landsat imagery download)
3) Integrate HMS and Landsat acquisitions 4) Scene Selection tool (MTBS Viewer)
5) Automated Image processing; compute dNBR and apply default burn severity thresholds
5. POTENTIAL APPLICATION IMPACT Implementing these changes has the potential to enhance the way fires are evaluated for burn severity and enable near-real-time mapping of fires within the United States. Increasing the
number of fire perimeters and extent of MTBS burn severity data coverage would improve national assessments of fire. This could be especially important in areas such as the southeastern United States where large numbers of fires are not reported. Local implementations of remote-sensing-based fire assessment applications will improve local understanding of fire impacts and local land management decisions.
To detect land change using Landsat and other satellite imagery as it is acquired, USGS EROS and its partners are devoting substantial resources to build the Land Change Monitoring Assessment and Projection (LCMAP) program. USGS EROS is highly supportive and vested in the success of automated, robust, and timely methods to detect change. Fire is a major source of land change in the United States and globally. The integration of the proposed fire-related work into the broader concepts of the LCMAP will be extremely important to the overall effectiveness, and efficiency of an operational USGS land change monitoring program.
ACKNOWLEDGEMENTS
The authors would like to acknowledge Susan Jeheber-Matthews and Jason Drake of the USDA National Forest Service, Tallahassee Florida for their of support this effort.
REFERENCES
Eidenshink, J., Schwind, B., Brewer, K., Zhu, Z., Quayle, B., & Howard, S. (2007). A project for monitoring trends in burn severity. Fire Ecology, 3(1), 3-21.
Rulequest. (2004). Data mining with Cubist. Retrieved from http://www.rulequest.com/cubistinfo.html
Ruminski, M., Kondragunta, S., Draxler, R., & Zeng, J. (2006).
Recent changes to the hazard mapping system. Paper presented
at the 15th International Emission Inventory Conference, New Orleans, LA. Available at
http://www.epa.gov/ttn/chief/conferences.html.
Zhang, X., Kondragunta, S., & Quayle, B. (2011). Estimation of biomass burned areas using multiple-satellite-observed active fires. IEEE Transactions on Geoscience and Remote Sensing, 49(11), 4469-4482.