STRIPING NOISE REMOVAL OF IMAGES ACQUIRED BY CBERS 2 CCD CAMERA
SENSOR
E. Amraei a , M. R. Mobasheri b
aMSc. Electrical Engineering department, Khavaran Higher Education Institute, [email protected] b Remote Sensing Engineering department, K.N.Toosi University of Technology, [email protected]
KEY WORDS: CCD Camera, CBERS, striping noise, satellite imagery, remote sensing
ABSTRACT:
CCD Camera is a multi-spectral sensor that is carried by CBERS 2 satellite. Imaging technique in this sensor is pushbroom. In images acquired by the CCD Camera, some vertical striping noise can be seen. This is due to the detectors mismatch, inter detector variability, improper calibration of detectors and low signal-to-noise ratio. These noises are more profound in images acquired from the homogeneous surfaces, which are processed at level 2. However, the existence of these noises render the interpretation of the data and extracting information from these images difficult. In this work, spatial moment matching method is proposed to modify these images. In this method, the statistical moments such as mean and standard deviation of columns in each band are used to balance the statistical specifications of the detector array to those of reference values. After the removal of the noise, some periodic diagonal stripes remain in the image where their removal by using the aforementioned method seems impossible. Therefore, to omit them, frequency domain Butterworth notch filter was applied. Finally to evaluate the results, the image statistical moments such as the mean and standard deviation were deployed. The study proves the effectiveness of the method in noise removal.
1. INTRODUCTION
Due to having good spatial and spectral resolution as well as easy access to the images, data acquired by CCD Camera has many applications in environmental studies. Unfortunately, some noise can be seen for various reasons including non-compliance of the detectors, improper calibration of the detectors, inter detector variability and the low signal-noise ratio in the image acquired by the sensor (INPE and CAST, satellite imagery, edge detection and lines tracking algorithms can be used and after identifying these patterns, striping noise can be removed using spatial curve functions (Tsai, Chen, 2008). The advantage of this method is that it can remove non-periodic striping noise from the image as well. The problem with this method is that it detects some additional strips when detecting striping patterns locations in images. Spectral moment matching method can be also used to remove the striping noise in satellite images. Continuous narrow bands due to the proximity to each other in the spectrum of electromagnetic radiation usually tend to be correlated. The high degree of correlation makes it possible to compare the statistical characteristics of a detector in a band with the statistical characteristics of corresponding detector in the (highly) correlated band (Lixin et al., 2008). This method has high accuracy in noise removal, but the problem is that it is only used for hyper-spectral data. Moreover, after identifying the column infected to noise, we can use the correction factor calculated from the adjacent column to modify them (Garcia, Moreno, 2004) ،(Mobasheri, Zendehbad 2013). Among the disadvantages of this method is that in the case of increase in stripes in the image, the computation size will increase. One of the methods in the striping noise removal is the radiometric
equalization method. In these techniques a simple gain and bias model is developed for all detectors and then used for compensation. This method does not account for nonlinearity in sensor variations (Algazi, Ford, 1981). Histogram modification method is a widely used method for the striping noise removal in satellite images. In this approach the histogram of the noisy data is made to match a histogram of suitable reference data. This suitable reference histogram can be the global histogram of the image, can be from some other compatible image, or can be from one of the detectors considered as the reference with histogram data from other detectors matched to it (Horn, Woodham, 1972). These techniques are easily implemented but can involve trial and error and inconsistent results. Another method of strip noise removal techniques is the method of principal components analysis (Srinivasan, 1986). After that principal components are obtained, the noisy higher order components are simply set to zero and an inverse transformation is performed. Though this method is effective, it involves an enormous amount of computation to compute statistics and eigenvectors and then apply the forward and inverse transformations. In this paper, spatial moment matching method is used to remove the striping noise in the images acquired by CCD Camera. In this method, statistical moments such as the mean and standard deviation of columns in each band are used to correct the statistical properties of the detector arrays to reference values. After the noise removal, some diagonal striping noises remain in the image which correction is impossible using the above method. Therefore to eliminate them, frequency domain Butterworth notch filter is used. The outcome of the implementation of the model and evaluation of these results shows the effectiveness of the method proposed in noise removal.
2. CBERS SATELLITES AND CCD CAMERA SENSOR
2003. These satellites are collaborative work of China and Brazil. Payload of CBERS 2 is similar to CBERS 1. Satellite's orbital characteristics are shown in Table 1.
Orbit Sun synchronous
Table 1. Orbital specifications of the satellite
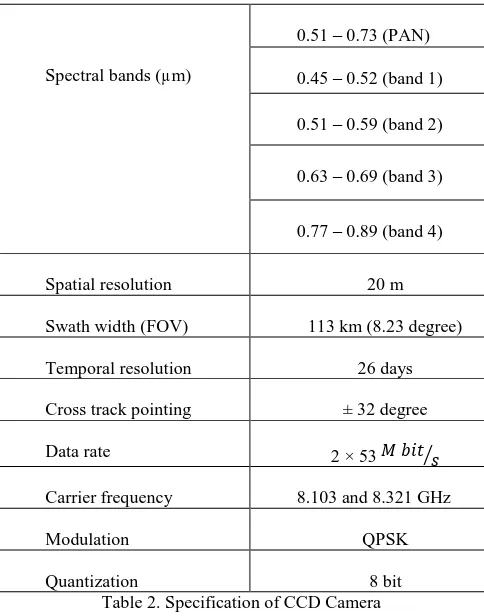
Three sensors of CCD Camera, IRMSS (Infrared Multi Spectral Scanner) and WFI (Wide Field Imager) are mounted on CBERS 2. The sensors CCD Camera and WFI are imaging in the VNIR spectral region, while IRMSS is imaging of the earth in the SWIR and thermal bands. In this paper, CCD Camera has been evaluated. This sensor is a sensor with high spatial and spectral resolution which imaging in Push broom way in 5 bands. Sensor characteristics are given in Table 2.
Swath width (FOV) 113 km (8.23 degree)
Temporal resolution 26 days
Cross track pointing ± 32 degree
Data rate 2 × 53 �� ⁄
Carrier frequency 8.103 and 8.321 GHz
Modulation QPSK
Quantization 8 bit
Table 2. Specification of CCD Camera
The sensor consists of three arrays of CCD detectors that on each array, 2048 detectors exist and in total, the number of used detectors is 6144. From this, no signals was received from 14 detectors of third array in ground stations and only 6130 pixels per row can be received by ground stations. The second array overlaps with each of the adjacent arrays in 154 detectors which this overlapping ends to a total of 308 detectors. There are also 8 detectors on each array, which are located in the dark current region. Therefore, each row of the image has 5798 pixels. Detectors geometry is shown in Figure 1.
Figure 1. Geometry of CCD Camera detectors
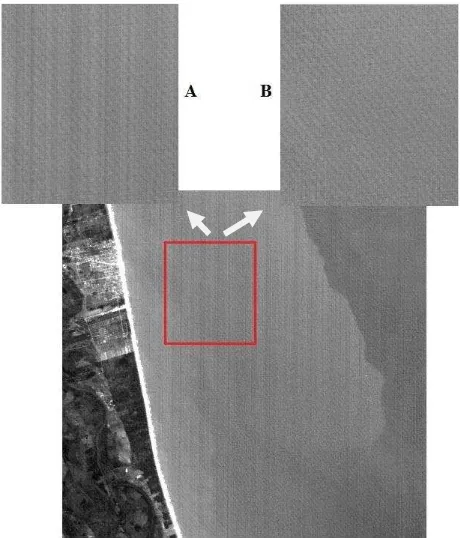
Among the causes of birth of noise in the image acquired by CCD Camera are mismatch in detectors, sensor calibration problems, inter detector variability and low signal-to-noise ratio (INPE and CAST, 2004). For example in Figure 2 mismatch of detectors in band 3 is shown. As can be seen in this figure, the response of the detectors is not identical on all three arrays that this problem causes striping noise in the images.
Figure 2. Response of the detectors on three arrays in band 3
The following three factors cause changes in the response of the detectors:
A) Dark current: A residual response for zero radiance, better
known as “dark current” or “bias” or “offset”, which , in
practice, implies in a response different from zero when there is no illumination reaching the detector. This offset is unique for each detector;
B) A different gain for each detector which, in practice, results in different response for each detector for the same level of radiance.
C) The three detectors arrays have different average responses caused by a global gain difference among the arrays.
creation of noise in the images and reduction of data quality. So we should attempt to remove noise from these images.
3. MATERIAL AND METHODS
3.1. Destriping Algorithm
Statistics of detector array can be studied by collecting mean, variance, minimum and maximum for each pixel in each band. Here it is assumed that the columns striping noise digital number are valid values, but because of the difference in the gain and offset of the detectors, the figures in different columns are different from each other. In spatial moment matching method, the statistical characteristics of columns in each band (e.g. mean and standard deviation) are used for the modification of the statistical characteristics of the arrays to reference moments, the gain ( ) and offset ( ) should be calculated for each detector. The image data for sample i, column j and band k (x ) can be modified using equation 1 (Bisun et al., 2003):
In these relationships, gain controls the SD of image columns and also offset controls the mean. In addition to the vertical striping noise, some periodic strips can be seen in the North West - South East of the images. These types of noises can be seen in all CCD sensor bands which reform is impossible using the aforementioned method. To remove this type of the noise, image refinement has been used in the frequency domain. Striping noise components can be seen as some bright spots in the Fourier spectrum that this property has been used to identify these components. After identifying the components, to correct the image, frequency domain Butterworth notch filter is used (Equation 4) (Gonzalez et al., 2009). comparison between the obtained results shows the effectiveness of this method in noise removal. Earlier mentioned, the striping noise can be seen well in images
well in images. Figure 3 (a) shows a part of the original image, including non-periodic vertical striping noise. Noise removal results are shown in Figure 3 (b). Also the result of diagonal striping noise removal is shown in Figure 4. Visual investigations of results shows the effectiveness of the method in noise removal.
Figure 3. The image acquired in band 1of CBERS 2 CCD Camera: A) a part of the original image. B) The result of
vertical striping noise removal in original image
Figure 4. A) The image in Figure 3 (b), B), The result of diagonal striping noise removal
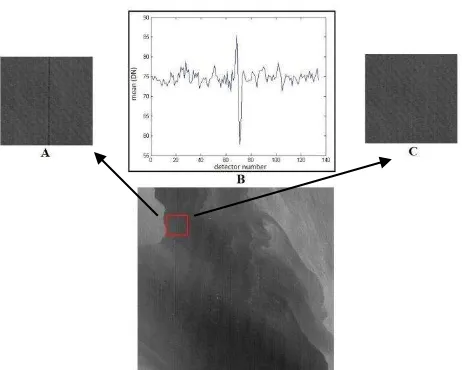
Figure 5. The image acquired in band 2 of CBERS 2 CCD Camera. A) A part of the original image. B) The variation of the
columns mean. C) Modified image
Figure 6. A) The image of Figure 5 c. B) The result of diagonal striping noise removal
4. RESULTS AND ANALISIS
Noise removal in remote sensing should be such that the noise removal process has the least effect on radiometric information. To demonstrate the efficacy of the proposed method in noise removal, a simulated data has been used for vertical striping noise. Raw data is shown in Figure 7 (a) that after adding the vertical striping noise, it is shown in Figure 7 (b). Also in Figure 7 (c) the result of vertical striping noise removal has been shown.
Figure 7. A) Raw data. B) Simulated data for vertical striping noise. C) The result of vertical striping noise removal in figure
(b)
To compare the results obtained from the suggested model in this paper (figure 7c) with the original image (figure 7a), we used the Root Mean Square Error (RMSE) (Equation 7). RMSE was calculated between corresponding pixels of the modified image and original image.
RMSE = √∑ � − �
� �=
− (7) Where, is pixels of the corrected image, is pixels of the original image, and N is the total number of pixels.
The value of the calculated RMSE is equal to 0.253. To calculate the relative error, RMSE is divided by average of the pixels in the enhanced image by our model (equations 8 and 9).
Average = ∑��= � (8)
Relative-Error = �������� (9)
The error rate calculated for the result of the model proposed in this paper as compared to original image is equal to 0.32 percent, which indicates that the model has an accuracy of 99.68 percent in vertical striping noise removal. To evaluate the model, scatter plot of pixels is drawn between the initial image (Fig. 7a) and the corrected image (Fig. 7c). This diagram is shown in Figure 8. Dispersion of points around the bisector of the first quadrant shows the accuracy of the model in noise removal and little error of the method in vertical striping noise removal.
Figure 8. The Scatter plot drawn between Figure 7 (a) and 7 (c)
Figure 9. A) Histogram of image in Figure 7a. B) Histogram of image in Figure 7 b. C) histogram of image in Figure 7 (c).
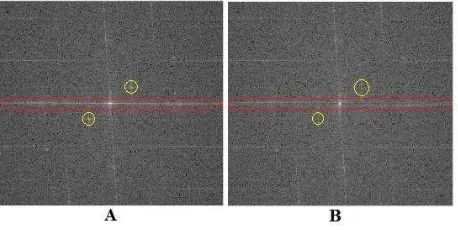
In addition, for further investigation, the image power spectrum of band 1 is calculated and plotted before and after vertical and diagonal striping noise removal. Figure 10 (a) shows the power spectrum before removal and Figure 10 (b) shows it after removal. Because the strips are placed vertically in the image, so the power can be found that are located on the horizontal axis of the spectrum. The equation 10 is used to calculate the power spectrum:
Power_spectrum = 10 log (|���{� , }| ) (10) In this equation � , is the input image. Bright spots on the horizontal axis in Figure 10 are related to the vertical striping noise components that cannot be seen in Figure 10 (b) after the removal. Also, bright spots identified in the spectrum are related to the diagonal striping noise which cannot be seen in power spectrum after modification of the image.
Figure 10. A) The power spectrum of image band 1 before the striping noise removal, B) power spectrum of the image after noise removal. The red box indicates the position of the vertical
stripes component and yellow box indicates the position of the components of the diagonal stripes before and after the image
modification.
In Table 3, the statistical characteristics of images before and after the vertical and diagonal striping noise removal are given. Slight reduction seen in the standard deviation is due to
Table 3. Comparison of the results of striping noise removal in the images acquired by CBERS 2 CCD Camera
In addition, the diagram of columns mean for correcting single columns in band 2 images is shown in Figure 11. As it can be seen, the noise removal process reduces the changes in the diagram of detector data mean in defective columns. This can be well seen by comparing Figure 11 (a) and 11 (b). The diagram 11 (a) shows the mean of columns in the original images and 11 (b) shows the graph after noise removal.
Fig11. A) Diagram of column mean before modification. B) Diagram of the column mean after modification
5. CONCLUSION
REFERENCES
Algazi. V. R, Ford. G. E, "Radiometric equalization of non – periodic striping in satellite data," Comp. Graph. Image Proc. 16(3), 287 -295, 1981.
Bisun Datt, Tim R. McVicar, Tom G. Van Niel, David L. B. Jupp, Jay S. Pearlman, preprocessing EO-1 Hyperion hyperspectral data to support the application of agricultural indexes, IEEE TRANSACTIONS ON GEOSCIENCE AND REMOTE SENSING, VOL. 41, NO. 6, JUNE 2003.
Garcia. J.C, Moreno. J, REMOVAL OF NOISES IN CHRIS/PROBA IMAGES: APPLICATION TO THE SPARC CAMPAIGN DATA, Proc. of the 2nd CHRIS/Proba Workshop, ESA/ESRIN, Frascati, Italy, ESA SP-578, 2004.
Gonzalez. R. C, Woods. R. E, Eddins. S. L, "Digital Image Processing Using MATLAB". Beijing: Publishing House of Electronics Industry, 2009.
Horn. B. K. P, Woodham. R. J, "Destriping Landsat MSS images by histogram modification," Comp. Graph. Image Proc. I0(I), 69 -83, 1979.
INPE (Instituto Nacional de Pesquisas Espaciais) and CAST, Radiometric Quality Assessment of CBERS-2, 2004.
Lixin. S, Robert. N, Karl. S, H. Peter White, Automatic destriping of Hyperion imagery based on spectral moment matching, can. j . Remote Sensing, Vol. 34, Suppl. 1, pp. S68-81, 2008.
Mobasheri, M. R, zendehbad. S. A, Diagnosis and repair of random noise in the sensors CHRIS-PROBA, International Archives of the Photogrammetry, Remote Sensing and Spatial Information Sciences, Volume XL-1/W3, 2013, SMPR 2013, 5
– 8 October 2013, Tehran, Iran.
Srinivasan. R, "Noise removal by the Karhunen -Loeve transform," in Proc. Int. Soc. for Photogrammetry and Remote Sensing Symposium, Vol. 26 -2.263 -273, 1986.