OBJECT-BASED ANALYSIS OF LIDAR GEOMETRIC FEATURES FOR VEGETATION
DETECTION IN SHADED AREAS
Yu-Ching Lin a*, ChinSu Lin b, Ming-Da Tsaia, Chun-Lin Linb
a Dept. of Environmental Information and Engineering, Chung Cheng Institute of Technology, National Defense University, Taiwan - (yuching.ncl, scott.tasi)@gmail.com
b Dept. of Forestry and Natural Resources, National Chiayi University, Taiwan - [email protected]
c Dept. ofInformation Communication Research and Development, National Chung-Shan Institute of Science & Technology, Taiwan - linshung.lin @gmail.com
Commission I, WG I/2
KEY WORDS: LIDAR, Object-based Analysis
ABSTRACT:
The extraction of land cover information from remote sensing data is a complex process. Spectral information has been widely utilized in classifying remote sensing images. However, shadows limit the use of multispectral images because they result in loss of spectral radiometric information. In addition, true reflectance may be underestimated in shaded areas. In land cover classification, shaded areas are often left unclassified or simply assigned as a shadow class. Vegetation indices from remote sensing measurement are radiation-based measurements computed through spectral combination. They indicate vegetation properties and play an important role in remote sensing of forests. Airborne light detection and ranging (LiDAR) technology is an active remote sensing technique that produces a true orthophoto at a single wavelength. This study investigated three types of geometric lidar features where NDVI values fail to represent meaningful forest information. The three features include echo width, normalized eigenvalue, and standard deviation of the unit weight observation of the plane adjustment, and they can be derived from waveform data and discrete point clouds. Various feature combinations were carried out to evaluate the compensation of the three lidar features to vegetation detection in shaded areas. Echo width was found to outperform the other two features. Furthermore, surface characteristics estimated by echo width were similar to that by normalized eigenvalues. Compared to the combination of only NDVI and mean height difference, those including one of the three features had a positive effect on the detection of vegetation class.
* Corresponding author
1. INTRODUCTION
Spectral information has been widely used in remote sensing image classification. However, one limitation of the use of multispectral images is related to the existence of shadows and the loss of spectral radiometric information. Many atmospheric conditions or topographic effects, including elevated urban objects, may result in errors in multispectral vegetation indices, and the true reflectance in shaded areas may be underestimated. In land cover classification, shaded areas are often left unclassified or simply assigned as a shadow class. It is challenging to classify true land cover types under shadows where the illumination is from a different angle than the view. In forest applications, the level of information extraction relies on high quality image data. A vegetation index from a remote sensing measurement is a radiation-based measurement computed from spectral combinations. It can indicate vegetation properties and plays an important role in forest remote sensing. For example, a normalized difference vegetation index (NDVI) makes good use of the large difference in vegetation reflectance between the visible and near-infrared (NIR) parts of the spectrum.
In theory, vegetation indices can be a powerful means of deriving canopy properties both spatially and temporally. Unfortunately, they can be affected by many factors, such as the sensor calibrations and the atmospheric conditions, which are
unrelated to the biophysical properties. The values of indices such as NDVI for a given vegetation target may differ due to the radiometric processing applied to the image data. Areas of high or moderate relief often comprise various ecosystem properties, such as various compositions for grass-shrub-tree populations and forest management practices.
Airborne light detection and ranging (LiDAR) technology is an active remote sensing technique that produces a true orthophoto at a single wavelength. There is less dependence on the weather compared with an optical sensor. The non-spectral information, such as the spatial relationship, can be a better way of characterizing the land cover classes of interest. Since commercial airborne LiDAR systems have been available, the incorporation of multispectral images and LiDAR data has become popular in various applications (Holmgren et al., 2008; Lee and Shan, 2003). The variations in the land surface elevation, known as the Digital Surface Model (DSM), are the most powerful features derived from the LiDAR data. Several studies have demonstrated that the inclusion of the LiDAR elevation data benefits the determination of tree parameters (Lin et al., 2011; Lo and Lin, 2013; Wu et al., 2014) and the separation of classes that have similar spectral characteristics (Lee and Shan, 2003; Rottensteiner et al., 2005). Therefore, classification accuracy can be enhanced. However, apart from the fundamental elevation features, there are other potential The International Archives of the Photogrammetry, Remote Sensing and Spatial Information Sciences, Volume XLI-B1, 2016
XXIII ISPRS Congress, 12–19 July 2016, Prague, Czech Republic
This contribution has been peer-reviewed.
LiDAR-derived features that may also enrich the classification or bring extensive benefits.
Many studies on point cloud classification use point-based information. In reality, the information is not represented by single points but by meaningful image objects. It is beneficial to analyse the object-based LiDAR features and assess the representation of the characteristics of illuminated surfaces. The aim of this paper is to evaluate using object-based LiDAR-derived features where NDVI values fail to represent the meaningful forest information due to the existence of shadows.
2. METHODOLOGY 2.1 Background
Feature selection plays a crucial role in any image analysis process. The assumption is often made that the incorporation of additional features will enhance classification accuracy, but it is the selection of the most suitable factors that should be considered. Guo et al. (2011) assessed the importance of the features derived from aerial LiDAR (multi-echo and full-waveform) and aerial multispectral image data for dense urban scenes. It was found that the most significant feature is the relative height of a LiDAR point. The height difference (Δz), the Blue channel, the Red channel, the echo amplitude (A), and the echo cross-section (σ) are the five most important features among the 12 features investigated. The current status of remote sensing image classification incorporates multisource data, such as the spectrum of visible, infrared, and microwave regions. In addition, secondary information, such as texture, context, and terrain features, are often incorporated. However, a further consideration should be acquiring complementary spectral and spatial characteristics to improve the classification accuracy further.
Differing from LiDAR point clouds, the remotely sensed images are stored in raster form. Each element is known as a pixel that is a quantized count. The counts are often converted to physical values to represent the characteristics of the illuminated surfaces. The raster images represent the measurements in the individual bands of a remotely sensed image of interest. With the selected features, the pattern recognition process links the raw data to a user-defined label set. It is noted that an object or a pixel is related to a label of land cover. Traditional methods for land cover mapping use a pixel-based analysis in order to explore the spectral differences of various features. An object-oriented classification has been a popular method for digital image analysis.
2.2 Define Object boundaries
In object-based classification, the meaningful features are based on similar spectral or spatial properties of the remotely sensed imagery or the LiDAR data. Applying an object-oriented approach refers to analysing features in object space rather than in pixel space. The technique of image segmentation is employed to convert an image into multiple objects. The process ends when the smallest increase in similarity exceeds a user-defined threshold. The segmentation divides the original image into regions comprised of similar spectral response. After breaking down a scene into various objects, objects can be associated with various properties, such as different spectral indices, multi-echo LiDAR attributes, or waveform attributes.
The objects from an image are usually created by implementing image segmentation. These are the boundaries of homogeneous areas of land cover with similar spectral properties. Therefore, all the pixels within an object are forced into one class in an object-based classification.
Trimble® eCognition® is commercial software developed by Definiens of Munich, Germany. In this study, the algorithm using multi-resolution segmentation available in eCognition was executed to create meaningful objects. Therefore, feature analysis is based on the object space rather than the point space. The algorithm depends on four criteria—scale, colour, smoothness, and compactness. The size of the image objects is closely related to the scale parameter which determines the segmentation. The weight of each image layer can be set within segmentation settings. A higher weight for an image layer indicates that more weight will be assigned to that layer’s pixel information. In this study, only the multispectral NIRband was considered for the colour criteria and was assigned a value of 1 for the weight. For other image layers, a value of 0 was set. The criteria of smoothness and compactness are related to the shape factors. They were both set as default values which were the values of 0.1 and 0.5, respectively.
2.3 Object-Oriented LiDAR Features
Once objects are created by image segmentation, they can be associated with various attributes or features. In other words, a set of features, also called a pattern, is exploited to describe an object. The well-known NDVI is considered as a multispectral attribute. The NDVI index is a ratio based on the different spectral response in the visible red and NIR bands. The range of NDVI values are between -1 and +1. It is one of the most commonly used vegetation indices. Compared to the original spectral bands, spectral indices are more useful variables for determining the fundamental biophysical parameters of vegetation.
The object features derived from point clouds are descriptive statistics calculated based on the points within the object boundaries. The statistics used can vary, including mean, standard deviation, minimum, maximum, median, or mode. In this study, the mean and the standard deviation of selected point properties for each object are calculated. The selected point properties are those based on the height difference (dz), the echo width (W), NormaSigma0, and the normalized eigenvalues. Since roughness information could indicate possible vegetation surfaces, the degree of surface roughness based on discrete point clouds was estimated. Two types of attributes, the normalized eigenvalue (N_Eigen) and NormaSigma0, were investigated. The NormalSigma0 attribute represents the standard deviation of the unit weight observation of the plane adjustment (Pfeifer et al., 2014). The attribute NormalSigma0=sqrt(sum(r*r)/n-u), with sum(r*r) being the sum of all squared residuals for the n data points. The value u is the number of unknown parameters, which equals four (i.e. a, b, c, and d). A nonplanar region leads to a higher NormalSigma0. The N_Eigen is a derivative based also on a three-dimensional The International Archives of the Photogrammetry, Remote Sensing and Spatial Information Sciences, Volume XLI-B1, 2016
XXIII ISPRS Congress, 12–19 July 2016, Prague, Czech Republic
This contribution has been peer-reviewed.
fitting plane, which is λ0 / (λ2+ λ1+ λ0), where λ2>λ1>λ0 are the three sorted eigenvalues. If the neighbouring points lie on a plane, such as a building roof, the minimum eigenvalue (i.e. λ0) should be very close to 0. Conversely, if λ0 is not negligible, the group of points does not lie on a plane. The LiDAR features studied are:
Wmean: the mean of the echo widths of points within an
individual object,
WSTD: the standard deviation of the echo widths of points within
an individual object,
dzmean: the mean of the height differences of points within an
individual object,
dzSTD: the standard deviation of the height differences of points
within an individual object,
NormalSigma0mean: the mean of NormalSigam0 of points within
an individual object,
NormalSigma0STD: the standard deviation of NormalSigam0 of
points within an individual object,
N_Eigenmean: the mean of N_Eigen of points within an
individual object, and
N_EigenSTD: the standard deviation of N_Eigen of points within
an individual object.
2.4 Feature Combinations
To investigate the effects on classification accuracy with and without the LiDAR-derived featureswhere shadows exist in the multispectral imagery, several object feature combinations are investigated as shown in Table 1. A standard classifier, the Decision Tree classifier, is exploited to classify the types of vegetation, non-vegetation, buildings, and ground features.
Combination No. of features
Object Features
A 2 NDVI, dzmean
B 3 NDVI, dzmean, dzSTD
C 3 NDVI, dzmean, Wmean
D 3 NDVI, dzmean, WSTD
E 3 NDVI , dzmean ,
NormalSigma0mean
F 3 NDVI, dzmean,
NormalSigma0STD
G 3 NDVI, dzmean, N_Eigenmean
H 3 NDVI, dzmean, N_EigenSTD
Table 1. Feature combinations investigated
In addition, the evaluation of a learning scheme is not simple. The performance on the training data set is not an absolute indicator of the performance of on the independent test data. Another issue is that classifier performance is often predicted based on limited data. For example, since training data for land cover classification frequently relies on special human expertise, obtaining a large data set seems impossible. One of the practical techniques dealing with this issue is to carry out “repeated cross-validation”. Weka is an open source software for data mining tasks. It provides K-fold cross-validation to train and evaluate how well the learned model generalizes. Cross-validation is a way of improving the repeated holdout method. Therefore, the 10-fold cross-validation is applied in this study. A 10-fold cross-validation divides the dataset into 10 parts, holds out each part in turn, and averages the results. Each data is used once for testing and nine times for training.
3. DATASETS
This study utilizes data from a Riegl LMS-Q680i full-waveform laser scanner, the specifications for which can be found in Riegl (2012). A wavelength of 1550 nm is used, and the laser beam divergence angle (β) is 0.5 mrad.It is noted that the echo width from the Riegl software package corresponds to the full width at half maximum (FWHM) of the pulse, with a value of 0.1 ns. The full-waveform data were collected over Taichung, Taiwan, in July 2011. The data were captured at altitudes of approximately 1200 m, with a mean point density of greater than three measurements per square meter. In addition, multispectral imagery was captured from a Microsoft UltraCam-xp, which provided color (RGB) and NIR channels. With those bands provided, the NDVI of each image pixel could be calculated. The data were captured at an altitude of approximately 1700 m in 2011.
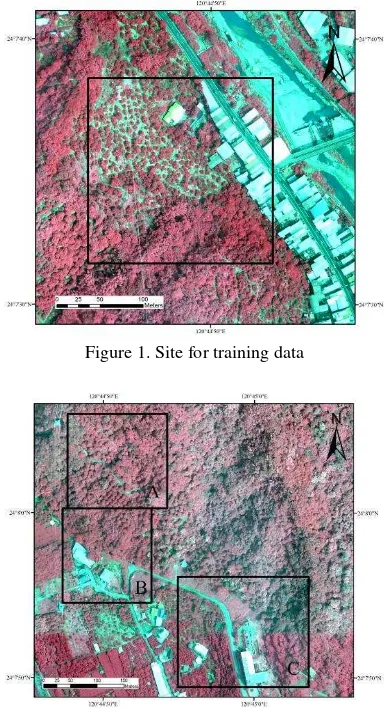
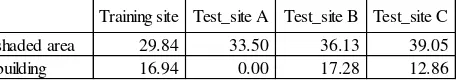
Figure 1 and Figure 2 illustrate the sites for the training data and the test data, respectively. It is noted that the training data and test data were collected from different flight strips. Table 2 shows the percentage of shaded areas and building areas, where the transferability of the LiDAR features between different strips was investigated.
Figure 1. Site for training data
Figure 2. Sites for test data
The International Archives of the Photogrammetry, Remote Sensing and Spatial Information Sciences, Volume XLI-B1, 2016 XXIII ISPRS Congress, 12–19 July 2016, Prague, Czech Republic
This contribution has been peer-reviewed.
Training site Test_site A Test_site B Test_site C
shaded area 29.84 33.50 36.13 39.05
building 16.94 0.00 17.28 12.86
Table 2. Sample percentage of shaded and building areas over the training site and the test site
4. RESULTS
Table 3 shows the overall accuracy of the various feature combinations. Among the eight feature combinations investigated, the three best combination are {NDVI, dzmean,
Wmean}, {NDVI, dzmean, N_Eigenmean}, and {NDVI, dzmean,
NormalSigma0mean}. Compared to the traditional feature
combination, which includes dz and NDVI, those with additional LiDAR features are more resistant to shaded areas. With the additional dzSTD added, the characteristics of the
vegetation can be enhanced. In general, the dzSTD, the echo
width, N_Eigen, and NormalSigma0 indicate different degrees of surface roughness. Therefore, the details for the vegetation characteristics are revealed. This study has demonstrated that among the four roughness attributes, Wmean provides the most
significant benefit to the classification results. The N_Eigenmean
feature is slightly better than the NormalSigma0mean. This
indicates that when the echo width is not available, the best alternative feature is the N_Eigenmean feature. Such features can
be easily derived from discrete point clouds. In contrast, in terms of the performance of the statistics of interest, the mean -based features are usually more helpful than the STD-based features.
Combinations Train_site Test_site A Test_site B Test_site C Average accuracy Rank
A 88.31 76.51 78.53 73.15 79.12 8
B 96.37 95.57 89.53 87.44 92.23 6
C 99.60 98.03 99.48 96.28 98.35 1
D 95.97 96.55 97.47 91.63 95.40 5
E 98.39 96.55 93.72 98.14 96.70 3
F 93.15 96.06 80.10 87.44 89.19 7
G 97.98 97.04 96.34 97.21 97.14 2
H 98.39 98.03 94.24 93.95 96.15 4
Table 3. Overall accuracy of various feature combinations
5. CONCLUSIONS
This study investigated the object-oriented LiDAR features to compensate for shaded areas where traditional vegetation indices often fail to represent meaningful vegetation characteristics. Instead of selecting the neighbouring buffer distance, the LiDAR features are derived statistics of point properties within an individual object boundary. In addition to the popular height difference (dz) feature, the mean of the echo widths of points Wmean is a beneficial feature for characterizing
the vegetation. The overall accuracy was improved from 79.12% to 98.35%. Comparing the performance of the combination with the additional dzSTD feature, the overall
accuracy was improved from 92.23% to 98.35%. For those LiDAR systems without recording waveforms, N_Eigenmean is a
beneficial feature which can be derived from traditional discrete-return point clouds.
ACKNOWLEDGEMENTS
This work has been supported by Ministry of Science and Technology in Taiwan (Grant no. MOST 103-2221-E-606 -008 -MY2).
REFERENCES
Holmgren, J., Persson, Å., Söderman, U., 2008. Species identification of individual trees by combining high resolution LiDAR data with multi-spectral images, International Journal of Remote Sensing 29, 1537-1552.
Lee, D.S., Shan, J., 2003. Combining lidar elevation data and IKONOS multispectral imagery for coastal classification mapping, Marine Geodesy 26, 117-127.
Lin, C., Thomson, G., Lo, C.-S., Yang, M.-S., 2011. A Multi-level Morphological Active Contour Algorithm for Delineating Tree Crowns in Mountainous Forest, Photogrammetric Engineering & Remote Sensing 77, 241-249.
Lo, C.S., Lin, C., 2013. Growth-competition-based stem diameter and volume modeling for tree-level forest inventory using airborne LiDAR data, IEEE Transactions on Geoscience and Remote Sensing 51, 2216-2226.
Wu, C.C., Chen, Y.L., Wu, J.D., Lin, C., 2014. Spectral-based multi-level Morphological Active Contour algorithm for individual tree detection and crown delineation, Geoscience and Remote Sensing Symposium (IGARSS), 2014 IEEE International, pp. 1867-1870.
Rottensteiner, F., Trinder, J., Clode, S., Kubik, K., 2005. Using the Dempster–Shafer method for the fusion of LIDAR data and multi-spectral images for building detection, Information Fusion 6, 283-300.
Guo, L., Chehata, N., Mallet, C., Boukir, S., 2011. Relevance of airborne lidar and multispectral image data for urban scene classification using Random Forests, ISPRS Journal of Photogrammetry and Remote Sensing 66, 56-66.
Pfeifer, N., Mandlburger, G., Otepka, J., Karel, W., 2014. OPALS - A framework for Airborne Laser Scanning data analysis, Computers, Environment and Urban Systems 45, 125-136.
Riegl, 2012. Datasheet LMS-Q680i, RIEGL Laser Measurement Systems GmbH.
The International Archives of the Photogrammetry, Remote Sensing and Spatial Information Sciences, Volume XLI-B1, 2016 XXIII ISPRS Congress, 12–19 July 2016, Prague, Czech Republic
This contribution has been peer-reviewed.