Y. WU a, J. REN a, W. LIU a,b *
a School of Geodesy and Geomatics, Wuhan University, 129 Luoyu Road, Wuhan, PR China - [email protected], [email protected], [email protected]
b Collaborative Innovation Centre for Geospatial Technology, 129 Luoyu Road, Wuhan, PR China
Commission I, WG I/5
KEY WORDS: BeiDou, Signal-in-space Anomaly, Integrity, URE, URA, ARAIM
ABSTRACT:
As BeiDou navigation system has been operational since December 2012. There is an increasing desire to use multiple constellation to improve positioning performance. The signal-in-space (SIS) anomaly caused by the ground control and the space vehicle is one of the major threats to affect the integrity. For a young Global Navigation Satellite System, knowledge about SIS anomalies in history is very important for not only assessing the SIS integrity performance of a constellation but also providing the assumption for ARAIM (Advanced Receiver Autonomous Integrity Monitoring).
In this paper, the broadcast ephemerides and the precise ones are pre-processed for avoiding the false anomaly identification. The SIS errors over the period of Mar. 2013-Feb. 2016 are computed by comparing the broadcast ephemerides with the precise ones. The time offsets between GPST (GPS time) and BDT (BeiDou time) are estimated and removed by an improved estimation algorithm. SIS worst-UREs are computed and a RMS criteria are investigated to identify the SIS anomalies. The results show that the probability of BeiDou SIS anomalies is in 10-3 level in last three years. Even though BeiDou SIS integrity performance currently cannot match the GPS integrity performances, the result indicates that BeiDou has a tendency to improve its integrity performance.
* Corresponding author
1. INTODUCTION
BeiDou Navigation Satellite System (BDS) and timing in the service in the Asian-Pacific region since the late 2012. With the modernization of GPS, the fully-operation constellation of GLONASS, and the developing of Galileo system, there is an increasing desire to use the multi-constellation Global Navigation Satellite System (GNSS) to enhance position accuracy, continuity, integrity and availability. With access to a large number of the multi-frequencies pseudo-ranges, it is expected that the GNSS will support navigation for very high-integrity-demanding users, such as ARAIM(Advanced Receiver Autonomous Integrity Monitoring )(Blanch et al., 2015, Blanch et al., 2016) users in the precision approaching phases of aviation flights.
For real-time GNSS positioning users, the broadcast navigation message including ephemeris data, are used to calculate the satellite orbits and clock corrections which indicate the time of the constellation. Therefore, differences between the orbits /clocks derived from the broadcast ephemerides and the truth, is called satellite signal-in-space Error (SISE). SISE is the mostly concerned element which determines the positioning accuracy and integrity. For stand-alone GNSS users, if a SISE is larger than a threshold (rigid definition given later), this SISE is call an anomaly. If the SIS anomaly happened without warning, it could result in a hazardous misleading.
The SIS anomalies are caused by either the ground control or the space vehicle (Walter and Blanch, 2015). A typically example (GPS WORLD, 2014) of GNSS SIS anomaly is the one that GLNOASS simultaneous multiple SIS anomalies occurred on April 2 2014, lasting for 11 hours, from just past
midnight until noon Russian time (UTC+4). The reason for system completely failure is that bad ephemerides were uploaded to satellites. It resulted in position solution was off by more than 50km.
Many studies have analysed the broadcast ephemeris accuracies of BeiDou (Montenbruck et al., 2015, Hu, 2013, Chen et al., 2013), GPS (Montenbruck et al., 2015, Heng et al., 2011, Heng et al., 2012b) and GLONASS (Heng et al., 2012c). All the above studies are focused on the nominal SISE (satellite anomaly free) behaviours in a statistical sense. In practice, unfortunately, the signal-in-space anomalies occasionally occur, which result in the User Range Errors (URE) in tens of meter or even up to tens of kilometres. (Heng et al., 2012b) shows that 3275 potential SIS anomalies of GPS are found from 2000 to 2010. The total hour of potential SIS anomalies per year has been improving over the period. The experimental probability of GPS anomalies is supposed -5
10 /sat/hour (GPS-Galileo Working Group C, 2015). For GPS, there are no simultaneous multiple anomalies have occurred since 2004. Heng (2012a) identifies 192 potential SIS anomalies of GLONASS over the period of Jan 1, 2009 to Aug 11, 2012 and the anomaly probability has improved from -3
10 level to -4
10 during the period.
(GPS-Galileo Working Group C, 2015, Walter et al., 2014) for providing the a priori stochastic model for ARAIM.
BeiDou System has been officially operational for more than three years. However, BDS anomaly has not been analysed yet. In this paper, the BDS broadcast ephemerides are downloaded and pre-processed to filter out the duplications and screen out the errors caused by receiver data conversion software, and etc. SISEs are calculated by comparing the broadcast ephemerides and the precise ones (produced by Wuhan University) (Zhao et al., 2013). Then, algorithm for estimating and removing the time-offset between GPST and BDT are investigated. RMS (Root Mean Squared error) based criteria is developed to identify the SIS anomalies. Finally, the BDS anomalies over the three year from Mar 1, 2013 to Feb 29, 2016 are presented and discussed.
2. DATA SOURCE AND PROCESSING 2.1 Data Source
2.1.1 Precise Ephemerides: Wuhan University, CODE, GFZ, and the other organizations have produced the BDS precise ephemerides. WUM (Multi-GNSS products of Wuhan University, indicated by WUM) ephemerides published by Wuhan University since the beginning of the year 2013 is the most continuous BDS precise ephemerides which are post-processed by PANDA (Positioning And Navigation Data Analyst) software by using the data collected from the BeiDou experimental tracking monitoring stations and some stations of IGS multi-GNSS experiment (MGEX). The analyses of 48-hour overlap and the assessments by SLR (Satellite Laser Range) measurements show that the WUM products are regarded as truth since the uncertainties are 10cm level (Hu, 2013, Chen, 2013, (Zhao et al., 2013)) which is one or two order of magnitude than the broadcast ephemerides.
2.1.2 Broadcast Ephemerides: BeiDou Broadcast ephemerides from 15 MGEX stations are downloaded because the 15 MGEX stations spread all over the world, thus, BeiDou satellites are seamlessly visualized by the 15 MEGX stations. Even though BDS navigation data were transmitted in 2012, the data from the 15 MGEX stations are available from March 1 2013, therefore, in this paper, BDS broadcast ephemerides over the period of Mar 1, 2013 to Feb 29, 2016 are analysed.
2.2 Data Pre-processing
2.2.1 Filtering Broadcast Ephemerides: The downloaded daily broadcast ephemerides are formatted in Rinex (RINEX 3.02, 2013), brdmddd0.yyp generated by combining the navigation message form the 15 MGEX stations. brdmddd0.yyp is in 12-decimal-digit floating-point format which is converted from the original navigation messages in binary. The conversion may result in some data-logging errors (Heng, 2010). Besides, there are some duplications and inconsistencies in the daily broadcast ephemerides. Therefore, broadcast ephemerides should be filtered to correct the errors and remove the duplications, inconsistencies which may cause the false anomalies. In this paper, the algorithms (Heng, 2010) are adopted to filter the broadcast ephemerides. The algorithms efficiently filter 2.26%, 7515 bad navigation messages out of the 331969 messages. The “clean” broadcast ephemerides are left for the further SIS anomaly analyses.
2.2.2 Excluding Invalid Ephemerides: Before comparing the broadcast ephemerides with the precise ones, invalid ephemerids, in both broadcast and precise ephemerides, should be excluded. The invalid ephemerides are:
1 The navigation message is unhealthy, i.e. the health status word of which is not zero;
2 The navigation message is beyond the age of 2 hours:
2 2
k k
t Toe h or t Toc h
k
t is the time of epoch k.
Toe is the reference time of ephemeris parameter.
Toc is the reference time of clock parameter.
3 the precise ephemeris/clock is absent or set to
Δ , and the orbit errors with respect to the space vehicle:
A-along track error, C-cross track error, R-radial track error, are computed by comparing the broadcast and precise ephemerides. In the comparison of broadcast and precise ephemeris data, adequate care must be taken to ensure compatibility of both orbit and clock information. The time and coordination reference systems and antenna offset correction are described in this section.
2.3.1 Time Reference Alignment: BeiDou broadcast clock is referred to a single-frequency B3I signal. However, BeiDou WUM, the precise clock
p
T , computed by using the double
frequency (B1I and B2I) ionosphere-free observation, is referred to GPS Time (GPST). Therefore, after 14-s BDS-GPS time offset (Montenbruck et al., 2015) is removed, a time group delay (tgd) should be concerned before comparing i
b
Then, the group delay corrected broadcast clock
,
T is redefined as follows:
,
b b tgd
i i
T T (3)
Then, the clock difference between the broadcast ephemerides and precise ones is calculated by
P b
i i i
T T T
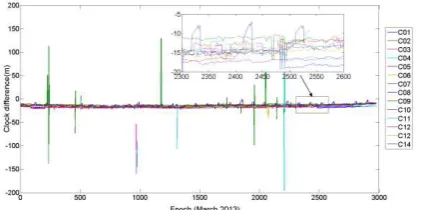
Δ (4) Figure 1 shows ΔTi, the clock differences of the current 14
Figure 1 Difference between broadcast clock and precise clock
Suppose the time offset residual at the time k is u k( ), the clock difference is modelled as follows:
( ) ( ) ( ) ( ) ( 1, 14)
Δ is the corresponding noise.
A zoomed-in portion of Figure 1 reveals that the sum of clock error and the noise is meter level. This feature shows that it is feasible to estimate and remove the time offset residual. In this paper, Kalman filter is used to estimate the time offset residual, meanwhile, a robust algorithm is employed to resist the broadcast clock anomaly impacts on the estimation
Suppose 2 late 2013) modelled as equation (5). The state equation is given by
observation equations, the state equation and the corresponding variances, ˆ( )k is estimated at every epochk. The predicted
residual vector is calculated by
V( ,k k 1) ΔT( )k Hˆ( ,k k1) (7)
is the corresponding standard deviation. If threshold calculated by inverse the cumulative probability function of normal distribution given a false alarm probability. Then, the variance of i( )
T k
Δ is magnified to reduce the weight of the observation. The iterations are applied until all ti are less
than the threshold. In this way, the time offset ˆ( )k is estimated. The estimated ˆ( )k (in March 2013) is shown in Figure 2
Apparently, the estimated time offsets are not influenced by the clock anomalies. This proves that Kalman filter combined with robust algorithm works well on the estimation. The results in Figure 2 show that the time offsets fluctuate with time as well. The clock errors are calculated by
ˆ ( ) ( ) ˆ( ) errors vary around zero and the clock anomalies are retained for the anomaly analysis next.
2.3.2 Coordinate Reference Systems: Even though the broadcast orbits of BeiDou are referred to CGCS2000 and the precise ones are referred to ITRF2008, these two frames are considered to agree at few centimetres level (Montenbruck et al., 2015). This is well below the typical uncertainty of broadcast ephemerides. Thus the coordinate transformation is not needed.
Figure 2 Time offsets (GPST-BDT) Residuals in March 2013
Figure 3 Satellite Clock errors (in March 2013)
2.4 Anomaly Identification
2.4.1 BeiDou SIS Worst User Range (worst URE) The SISE has different impacts on earth users located in different spots. Thus, the worst-user, i.e., the user, in the satellite’s footprint, who has the largest instantaneous URE, should be protected by the SIS integrity. the worst URE can be calculated by both analytic and geometric methods (Heng et al., 2012a). In this paper, the worst URE is calculate by the analytic method
2 2
max( cos R Tb A C ) (11)
Where is the latitude of the edge of the satellite’s coverage footprint.
is determined by altitude of the satellite and the user’s mask angle. If the user’s mask angle is zero, is for GEO and IGSO satellites, and is for MEO BeiDou satellites, respectively.
2.4.2 BeiDou SIS Anomaly Identification: For GPS, the SIS anomaly is defined as “For SPS SIS integrity definition purposes, outer bounds have been established at 4.42-sigma. The corresponding probability of exceeding these bounds for a normal distribution is 0.00001”. This definition can be located in different spots. The worst-user, i.e., the user who has the worst URE should be protected by the SIS anomaly definition as well. Therefore, the anomaly is claimed when
5- 4.42 10
P worst URE URA (13)
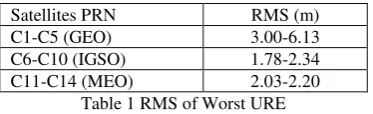
The worst-URE greater than the threshold, 4.42 times URA, is identified the anomaly. However, for BeiDou system, China Satellite Navigation Office has not published exact SIS integrity definition. Due to BeiDou ICD (BeiDou ICD, 2013) having the exact same URAdefinition as GPS,the authors tried to identify the SIS anomaly by following the definition as GPS. However, the URA tracing shows that the URAs in BeiDou broadcast results show that the RMSs of GEO satellites all are beyond the broadcast URA up-bound 2.4 (URA=2) (BeiDou ICD, 2013). Apparently, the broadcast URA is little optimistic for GEO satellites. Whereas, for IGSO and MEO satellites, the broadcast URA is just right the 1-sigma up-bound on worst URE.
Satellites PRN RMS (m) form the threshold to identify anomalies. Alternatively, in this paper, the RMS (Root Mean Squared error) calculated by
worst-URE on its own takes the place of URA in the equation (13) since RMS is the stochastic characteristic value to qualify the deviation of random variable from zero. Instead, in this paper, the anomaly is defined by
- 4.42
105P worst URE RMS (15)
The anomaly is identified when absolute value of worst URE is greater than the threshold 4.42 times RMS.
It should be pointed out that there is one more consideration on the satellite of BeiDou C1 because the satellite behaviours in a typical manner (shown in Figure 4) that the worst-URE of PRN C1 is not relatively stationary. It is obvious that the first section of the worst-URE, from 1 Mar. 2013 to 1 Sep. 2014, biases few meter than the second section, the rest of the data. Fortunately, if ignoring the potential anomalies (the spikes in Figure 4), it seems that each of two sections has its own inner stationary. Thus, the worst-URE of C1 is separated into two sections for the anomaly identification: RMS1 is calculated by the first
section data and used to form the anomaly test threshold and so is RMS2 to the second section data analysis.
It should be noted that before calculating the RMS, the potential anomalies should be isolated. Otherwise, the anomalies, especially the large anomalies up to tens of kilometres, has a great impact on the value of RMS. In this paper, the potential anomalies larger than 45m are isolated for the RMS calculating.
Figure 4 Absolute values of Worst URE of Satellite C1 (anomalies greater than 45m are isolated)
3. IDENTIFIED BEIDOU SIS ANOMALIES The BeiDou broadcast and precise ephemerides from 1 March 2013 to 29 February 2016 are processed using the pre-process procedures. For each of satellites, worst-UREs are calculated at 15-minutes intervals. Anomalies are tested and identified by following the algorithms described as above.
3.1 Identified SIS Anomalies
Figure 5 shows all identified SIS anomalies in the last three years. In this figure, the horizontal green lines indicate the periods when the satellite SIS UREs are in normal condition, i.e., there no anomalies are identified. For any of the satellites, there are some interruptions between these green lines. The interruptions are caused by the data missing due to either no valid broadcast or no precise ephemerides which are described in Section 2.2.2. It is pointed out that the BeiDou C13 satellite has not been in operation since the end of 2013. Markers of magenta dots, magenta stars, red circles and red squares present anomalies in four range levels, respectively. The four levels of anomalies are defined as follows
Level 1: 4.42RMSworst URE- 10 RMS
Level 2: 10RMSworst URE- 50RMS
Level 3: 50RMSworst URE- 1000RMS
Level 4: 1000RMSworst URE
-For example, if the RMS is 2.4m, the anomaly range in level 4 is larger than 2400m.
The results in Figure 5 show that SIS anomalies occured for all BeiDou satellites. Furthermore, not only single anomaly, but also simultaneous multiple anomalies and constellation-wide anomalies in various ranges occurred in last three years. The duration of anomalies lasts from 15 minute to more than ten hours. The anomaly ranges vary from tens of meter to hundreds of kilometres. There are two constellation-wide anomaly events occurred (in rectangles). One is on Jan. 14 2014, satellites getting into anomalies one after another or simultaneously. Another event occurred July 14, 2015, lasting only 15 minutes.
Figure 5 Identified BeiDou SIS anomalies from 01-Mar-2013 to 29-Feb-2016
3.2 Anomaly Probabilities
Figure 6 presents the probability of anomaly in different range levels of each of satellites. This probability is calculated by
_
i L duration Prob
total duration
(14)
where
i L
duration is the duration of the anomalies in level i
total duration_ is the total duration of the anomalies.
The result shows that for some satellites, the probabilities of large anomalies (in level 4) are greater than 50%, and even up to 85%. For stand-alone users without ARAIM, the large anomalies would result in hazardous misleading information. The red and black solid lines in Figure 6 present the percentages of clock anomaly duration and orbit anomaly duration, respectively. Some anomalies are caused by either clock faults or orbit faults, but some anomalies are caused by clock and orbit faults simultaneously. It should be noticed that for satellite
C13, which has not been operational since Dec. 2013, all anomalies are caused by clock faults.
The Probabilities of identified anomaly for each of satellites are given by Figure 7. This result shows that the anomaly probability of each satellite varies from 10-4 to 10-3. Satellite C2 has the greatest probability. The average anomaly probability of all satellites is 0.23%. Even though BeiDou monitor stations are in Chinese territory (GEO and IGSO satellites are under the monitoring), the result does not evidently indicate the lower anomaly probability for GEO and IGSO satellites.
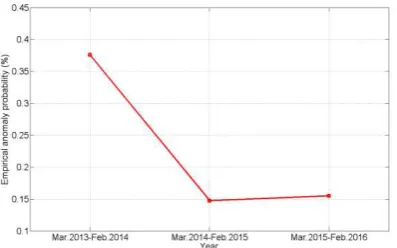
In order to see if the anomaly probability has been improving during the past three years, the empirical probability in every year is calculated (see Figure 8). Due to the data begins on Mar.1 2013 and end by Feb. 29 2016, the empirical probability in each year is counted from March 1 to the last day in next February. Figures 8 shows that the average anomaly probability is in 10-3 level in the last three years. There is a significant improvement between the first year and the last two years, the probability from 0.38% in 2013, down to 0.15% in 2014 and 2015.
Figure 7 Probabilities of identified anomaly
Figure 8 Empirical anomaly probability
4. CONCLUSION
In this paper, the broadcast and precise ephemerides from Mar.1 2013 to Feb. 29 2016 are pre-processed for the purpose of avoiding the false anomalies. Kalman filter combining the robust estimation is investigated and used to estimate the time offset between GPST and BDT. BeiDou SIS anomalies are identified by employing our own RMS based definition and criteria. The anomaly identification results show that the probability of BeiDou SIS anomalies is in 10-3 level, more frequently than GPS. Besides, simultaneous multiple anomalies, including constellation-wide anomalies in large ranges occurred as well. There is a significant anomaly probability improvement from 0.38% down to 0.15% over the last three years.
Although the preliminary analysis shows that BDS integrity performance does not match the GPS performances (Heng et al., 2012a, Heng et al., 2012b), BeiDou has been showing an improving trend. Even so, the development of integrity monitoring is urgently required for the future applications of BeiDou in highly demanding integrity field.
ACKNOWLEDGEMENTS
The authors gratefully acknowledge the support of the National Natural Science Foundation of China (41304005). This paper contains the personal comments and beliefs of the authors, and does not necessarily represent the opinion of any other person or organization.
REFERENCES
Chen L., Jiao W., &Huang X., 2013. Study on signal-in-space errors calculation method and statistical characterization of BeiDou Navigation Satellite System. Proceedings of China Satellite Navigation Conference (CSNC) 2013 , Berlin: Springer, 2013: 423-434.
GPS-Galileo Working Group C ARAIM Technical Subgroup Milestone 2 Report, February 11, 2015.Available at
http://www.gps.gov/policy/cooperation/europe/2013/working-group-c/ARAIM-report-1.0.pdf
Blanch, J., Walter, T. & Enge, P., 2016. A Simple Satellite Exclusion Algorithm for Advanced RAIM. Proceedings of the 2016 International Technical Meeting of The Institute of Navigation, Monterey, California., January 25 - 28 2016, pp.239–244.
Blanch, J., Walter, T. & Enge., P., 2015. Fast Multiple Fault Exclusion with a Large Number of Measurements. Proceedings of the 2015 International Technical Meeting of The Institute of Navigation, Dana Point, California, January 26 - 28 2015, pp. 696 – 701.
Chen, L., Jiao, W., Huang, X., Geng, C. & Lun, A. Study on Signal-In-Space Errors Calculation Method and Statistical Characterization of BeiDou Navigation Satellite System. Wuhan City, China, 2013, 423-434
GPS WORLD, 2014. Available at:
http://gpsworld.com/glonass-gone-then-back/.
Heng, L., Gao, G. X., Toddwalter & Enge, P., 2012a GLONASS Signal-in-Space Anomalies Since 2009. Proceeding of the 2012 Institute of Navigation (ION) Global Navigation Satellite Systems Conference, September 17 – 21 2012 Nashville, Tennessee, pp. 833-842.
Heng, L., Gao, G. X., Walter, T. & Enge, P. 2012b. GPS Signal-in-Space Anomalies in the Last Decade Data Mining of 400,000,000 GPS Navigation Messages. IEEE Transactions on Aerospace and Electronic Systems, 48(4).
Heng, L., Gao, G. X., Walter, T. & Enge, P., 2011. Statistical Characterization of GPS Signal-In-Space Errors. Proceedings of the 24th International Technical Meeting of the Institute of Navigation, Portland, OR, pp. 3109-3117
Hu, Z. 2013. BeiDou Navigation Satellite System Performance Assessment Theory and Experimental Verification. Phd. thesis, Wuhan University.
BeiDou ICD 2.0, China Satellite Navigation Office, 2013, BeiDou Navigation Satellite System Signal In Space Interface Control Document
Heng, L., Gao, G. X., Walter, T. & Enge, P., 2010. GPS Ephemeris Error Screening and Results for 2006–2009. the 2010 International Technical Meeting of The Institute of Navigation, San Diego, CA, January 25 - 27, 2010.
Montenbruck, O., Steigenberger, P. & Hauschild, A., 2015. Broadcast versus precise ephemerides: a multi-GNSS perspective. GPS Solutions, 19(2),pp. 321-333.
RINEX 3.02, International GNSS Service (IGS), RINEX WorkingGroup and Radio Technical Commission for Maritime Services Special Committee 104 (RTCM-SC104), The Receiver Independent Exchange Format, 2013.
Walter, T. & Blanch, J., 2015. Characterization of GPS Clock and Ephemeris Errors to Support ARAIM. Proceedings of the 2015 Institute of Navigation (ION) Pacific PNT conference, Honolulu, Hawaii, April 20-23 2015.
Walter, T., Blanch, J. & Enge, P., 2014. Reduced Subset Analysis for Multi-Constellation ARAIM. Proceeding of Joint Navigation Conference, Orlando, Florida, June 16-19 2014.