ULTRALIGHT RADAR FOR SMALL AND MICRO-UAV NAVIGATION
A. F. Scannapieco a*, A. Renga a, G. Fasano a, A. Moccia a
a DII - Department of Industrial Engineering, University of Naples Federico II, Piazzale Tecchio, 80 - 80125 Naples, Italy -
(antoniofulvio.scannapieco, alfredo.renga, giancarmine.fasano, antonio.moccia)@unina.it
KEY WORDS: UAV, Navigation, Radar
ABSTRACT:
This paper presents a radar approach to navigation of small and micro Unmanned Aerial Vehicles (UAV) in environments challenging for common sensors. A technique based on radar odometry is briefly explained and schemes for complete integration with other sensors are proposed. The focus of the paper is set on ultralight radars and interpretation of outputs of such sensor when dealing with autonomous navigation in complex scenario. The experimental setup used to analyse the proposed approach comprises one multi-rotor UAV and one ultralight commercial radar. Results from flight tests in which both forward-only motion and mixed motion are presented and analysed, providing a reference for understanding outputs of radar in complex scenarios. The radar odometry solution is compared with ground truth provided by GPS sensor.
1. INTRODUCTION
Autonomous navigation is one of the most investigated fields of Unmanned Aerial Vehicles (UAV). It typically relies on fused measurements from both an Inertial Measurement Unit (IMU) and a GPS sensor, the drift of IMU being removed via a Kalman Filter (Quist et al, 2016a). However, GPS signal is often neither available nor reliable during operations involving small or micro UAV. This represents an issue for navigation, since IMU housed onboard the platform may produce fast growing errors due to limited performance. Common approaches to the problem of GPS-denied navigation exploit electro-optical sensors and involve algorithms based on visual odometry (VO) (Nister et al., 2004) and LIDAR (Zhang, 2017). Effectiveness of these techniques can be hindered by difficulties with installation onboard micro-UAV, as when dealing with LIDAR, and especially adverse illumination conditions, such as smoke or dust. Radar provides information relevant to navigation but is independent of illumination conditions. Furthermore, current level of miniaturization and increasing interest in different fields, e.g. aerospace and automotive sectors, quicken the integration of ultralight radars onboard small and micro UAV (Moses et al, 2011),(Fasano et al, 2017), in terms of size, weight and power (SWaP).
Radar odometry for UAV navigation has been recently proposed, among others, by (Kaufmann et al, 2015), (Quist et al, 2016a), (Quist et al, 2016b), and (Scannapieco et al, 2017). In particular, (Kaufmann et al, 2015) proposed a simulation of two-dimensional navigation solution based on data from both side-looking radar housed on a fixed-wing UAV and IMU. Approaches in (Quist et al, 2016a) and (Quist et al, 2016b) are tailored to fixed-wing UAV and data acquired by a high performance Synthetic Aperture Radar (SAR) flying on a Cessna aircraft. An approach towards small and micro UAV, which can move in different directions with different speeds, hover, or even exhibit only attitude rotations, at very low altitude in a GPS-challenging scenario is presented in (Scannapieco et al, 2017). The work is oriented to existing commercial ultralight radars and to environments that can be significantly cluttered, hindering reliable extraction of many strong and stable scatterers. Indeed, challenges for radar navigation may arise with a large amount of
* Corresponding author
radar reflectors in the scene. In addition, relative attitude between radar antennas and physical objects and operational wavelength can affect the visibility of some targets (Knott, 1990).
The aims of this work are to present strategy for navigation of small and micro UAV with ultralight radars in challenging scenarios and to show the differences in radar outputs, not always straightforward, depending on the scene.
The paper is organized as follows: Section 2 illustrates principles of radar-aided navigation; Section 3 provides and explains results of experimental campaigns; finally, Section 4 provides conclusions.
2. RADAR-AIDED NAVIGATION 2.1 Radar Odometry
Radar odometry exploits information on fixed and strong targets in the scene to retrieve platform ownship motion. Given a model of radar, the main steps before using odometric algorithms are target detection and multiple-target tracking (MTT) (Scannapieco et al, 2017). Concerning this, it is also necessary to mention that an advantage of radar-based odometry compared with vision-based systems is the direct access to range information that prevents from scale drift phenomena.
Target detection develops in two phases: range-bearing estimation and features extraction. At each time step n, Fast Fourier Transform (FFT) is applied to the output of the radar to extract the range content. The resulting complex discrete frequency-domain signal for a-th channel can be expressed as
( , )= ( , ) { ( , )} (1)
where = range frequency
( , )= magnitude component
( , )= phase component
Frequency is directly proportional to range in FMCW systems. Then, when both receiving channels are enabled, phase component can be processed via the formula
( , ) = sin (2)
to estimate bearing angle. In equation (2) is the wavelength and L is the separation between phase centres of antennas. Since separation between receivers is very small compared with the range resolution, the magnitude component of two signals (1) is averaged non-coherently to achieve partial clutter suppression thus obtaining the value ( , ).
Once range and bearing contents are available, the extraction of relevant information and rejection of clutter are demanded to a one-dimensional Constant False Alarm Rate (CFAR) filter (Scannapieco et al, 2017). Ordered Statistics CFAR (OS-CFAR) (Rohling, 1983) performs well under different operative conditions. The OS-CFAR is developed by assuming that power content of each cell within a sliding window, whose size depends on applications, is first rank-ordered according to increasing magnitude (Rohling, 1983). The ordered statistic
, is assumed as noise level. For each Cell Under Test (CUT) the OS-CFAR detector compares the power level of CUT itself with noise level times a scaling factor and a target is present if
≥ , (3)
Extraction of strong scatterers leads to a sparse representation, unlike passive cameras (Scaramuzza, 2011) or active RGB-D (Vetrella et al, 2015) sensors which both provide spatially dense information.
The output of target detection is then fed into MTT algorithm. MTT algorithm hereby proposed works in three steps (Scannapieco et al, 2017). First, a Global Nearest Neighbours (GNN) algorithm associate new measurements with correct available tracks. All measurements that fall outside the uncertainty ellipsis, centered around estimated measurements, are not considered for association via the Munkres’ algorithm. Then, track handling strategies evaluate the status of new, tentative, and firm tracks. Finally, Extended Kalman Filter (EKF) provides new estimates of the range and bearing for each track.
At this point the tracks can be used by an odometer based on Singular Value Decomposition (SVD) to obtain rotation matrix and translation vector and retrieve the ownship motion of the platform. It is worth noting that the proposed approach uses radar data to estimate horizontal motion and heading angle. In fact, roll and pitch can be estimated with onboard inertial sensors. The estimate of height above ground level (AGL) can be obtained at each time step n from magnitude vector ( , ). Indeed, the first peak higher than a certain threshold, related to thermal noise, represents the first ground echo. The knowledge of the range of ground echo and the tilt angle of the sensor at leads to AGL as
= sin( + .5 ) (4)
where = beamwidth in elevation.
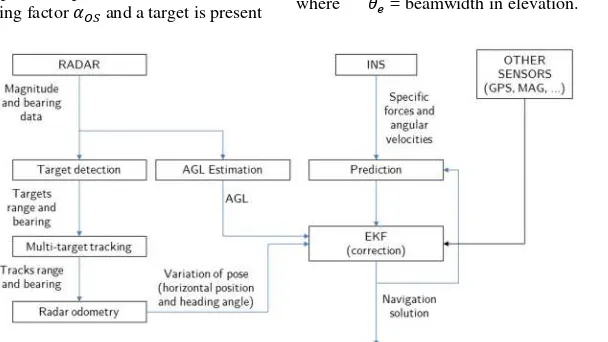
Figure 1. Schematic for loosely-coupled sensor fusion.
2.2 Fusion with Inertial Sensors
Radar-only navigation is feasible (Scannapieco et al, 2017), however fusion with Inertial Navigation Systems (INS) and other sensors could enhance navigation capabilities of small UAV. A first fusion approach is the loosely-coupled sensor fusion. The radar navigation solution, i.e. the variation of the pose provided by radar odometry solution, is computed separately and fused with INS navigation solution in an EKF. The solution of EKF depends also on the AGL and other possible sensors. Loosely-coupled fusion schematic is shown in Fig. 1. In the tightly-coupled fusion scheme (see Fig. 2), on the contrary, no direct radar navigation is produced but range and bearing contents in the tracks are used directly in EKF. Despite being more complex than the loosely-coupled fusion, this solution can exploit information such as range rate and angular rate in an easier way to augment navigation results.
3. EXPERIMENTAL RESULTS
This section illustrates the main results obtained during two experimental campaigns. The focus is on the understanding radar data to assist navigation.
3.1 Setup and scenes
The radar front-end used during experimental campaigns is FMCW radar 24-GHz SENTIRE Radar by IMST (IMST, 2015). Patch antennas, a single transmitting and two receiving separated in azimuth direction complete the sensor. The angular interval in which is possible to measure unambiguously the bearing angle is approximately 120°, that is, ±60° around boresight direction. The micro UAV adopted for flight tests is a customised version of the 3DR X8+ octocopter. The X8+ is a flexible platform able to embark auxiliary onboard systems up to maximum payload weight of 800 g (or close to 1 kg with reduced flight-time capabilities). The onboard payload for the radar sensing test includes the radar system, an Odroid XU4 embedded CPU running Linux operating system, a DC-DC converter, a dedicated battery for radar, an auxiliary GPS receiver (Ublox LEA-6T) with raw data capabilities, and an associated GPS patch antenna. The radar is located fore to minimize obstructions and disturbances to/from the other electronics components. Odroid XU4, DC-DC converter, the dedicated radar battery, and the auxiliary GPS system, have been installed above a plate under the drone belly. The test strategy relies on data acquisition for offline processing. Proper acquisition software has been developed in Python language to store all the data with an accurate time-tag based on the CPU clock. The CPU time-tag is also provided for GPS measurements, including GPS time, gathered with very small latency, enabling accurate synchronization of data acquired from different sensors.
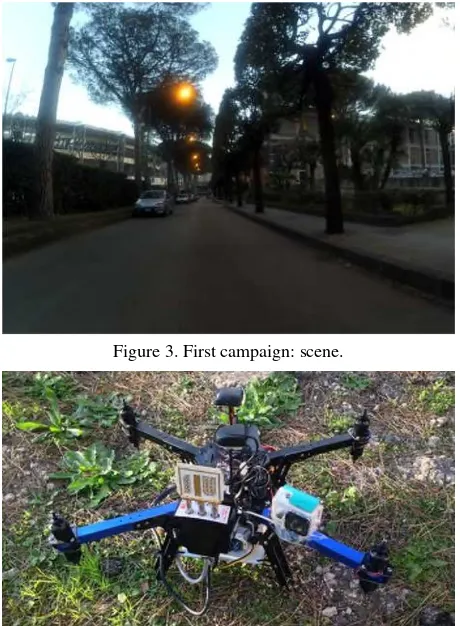
Two different test sites have been selected for experimental campaigns. The first one is a complex GPS-denied and cluttered environment and can be described as urban canyon (see Fig. 3). The radar is mounted in a forward-looking configuration and a Xiaomi YI camera, slightly tilted, provides also optical images. Fig. 4 illustrates the setup. It is worth noting that the rotor blades were added just before the flight. The second test site, instead, is a less challenging environment containing man-made objects such as poles, wired nets, a car (see Fig. 5). In this case the radar is slightly pitched (20°), as shown in Fig. 6. This mounting solution keeps forward-looking capabilities but also improves the illumination of ground targets.
Figure 3. First campaign: scene.
Figure 4. Setup for first campaign. IMST radar is mounted in forward-looking position.
Figure 5. Second campaign: scene.
3.2 Results
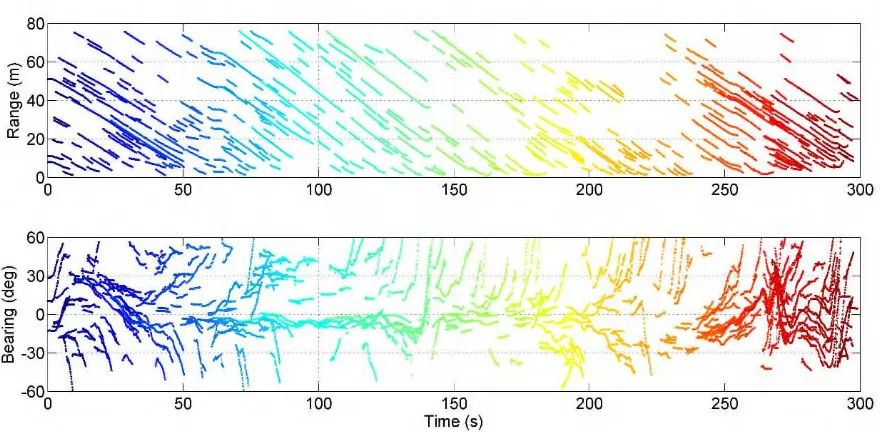
The first result shown in Fig. 7 is the difference in radargram measurement. In the first campaign, the UAV moves forward almost continuously. It stops hovering at around 60 s and experiences a 180° rotation at around 140 s. From the radargram it is also possible to retrieve information on the nature of the targets. Indeed, the slope of range curves indicates the relative range rate. Targets with different relative range rate are moving in a different way. This information is important for navigation as the one proposed relies on fixed targets. The complete understanding of the scene is given after target tracking as shown in Fig. 8. Indeed, in a forward-only motion the targets get closer in range and their bearing moves from the centre to the side of the beam before disappearing. In addition, the sudden rotation is witnessed by the steep angular rate at around 140 s. Each colour is associated to a single track.
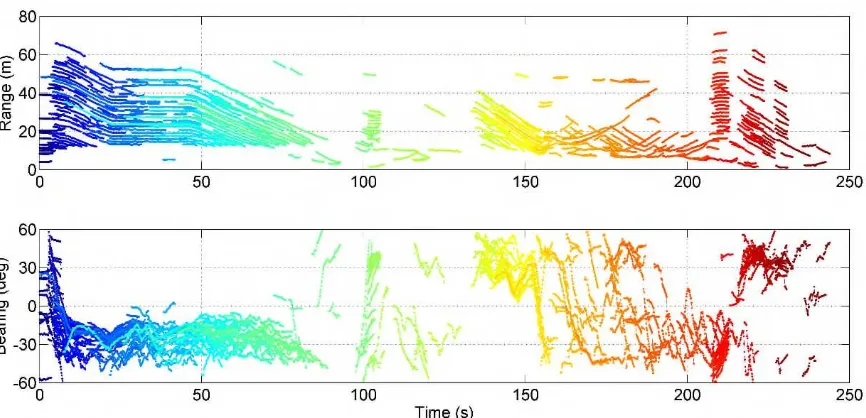
The second scene, on the contrary, shows motion with both forward-looking observation and side-looking observation. This is important because the methods here presented are for platforms that can experience any kind of motion. The radargram in Fig. 9 shows returns from omnidirectional scattering targets, i.e. poles, metallic net and the car. Around 100 s a complete turn is experienced and then the side-looking observation occurs. From the image of the scene it might be expected to see also the corner reflectors. However, they were mounted in the scene in a particular configuration so to highlight that when dealing with radar it is also important the observation angle. Again, target tracking gives relevant information (see Fig. 10). The targets seen by radar are on the left, therefore they are the metallic poles. After rotation, there is side-looking observation, hence the range walks are hyperbolas and there is a linear variation of the bearing angle, because the targets move from right to left. In the last part of the campaign, again forward motion is performed with poles to right of the radar.
Figure 7. Magnitude plot as function of range and time for first campaign.
Figure 9. Magnitude plot as function of range and time for second campaign.
Figure 10. Output of MTT algorithm for second campaign. Each colour corresponds to a single track.
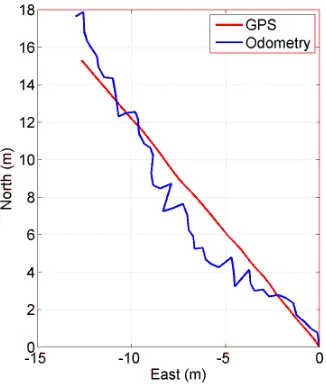
Finally, radar odometry results from forward-motion segment during second campaign are shown in Fig. 11, in which the GPS ground truth is present. The trajectory is in a North-East reference frame. The odometer follows the motion of the platform and its trajectory is in the range of uncertainty of the GPS. Therefore, the results can be considered acceptable for navigation purposes.
4. CONCLUSIONS
In this paper navigation of mini- and micro-UAV in challenging scenario supported by ultralight radar sensor has been discussed. Algorithms for radar-odometry navigation have been provided and sensor fusion strategies anticipated. In addition, the results of two experimental campaigns in target scenarios have been thoroughly analysed. The results indicates that the analysis of target detection outputs and MTT outputs, despite not as straightforward as visual-based information, can lead to a precise
knowledge of motion of the platform. In addition, these results could serve as a basis and aid for comprehension of radar outputs in different scenarios.
Figure 11. UAV trajectory estimated by radar-only odometry. GPS track is also shown for comparison.
5. ACKNOWLEDGEMENTS
This research was carried out in the frame of Programme STAR, financially supported by University of Naples Federico II (UniNA) and Compagnia di San Paolo, and in the framework of “Programma per il finanziamento della ricerca di Ateneo” funded by UniNa.
REFERENCES
Fasano G., Renga A., Vetrella A.R., Ludeno G., Catapano I., and Soldovieri F., 2017. Proof of Concept of Micro-UAV based Radar Imaging. Unmanned Aircraft Systems (ICUAS), 2017 International Conference on.
IMST, 2015. available Online: http://www.radar-sensor.com/products/radar-modules/sr-1200/
Kauffman K, J. Raquet J., Morton Y.T.J., and Garmatyuk D., 2013. Real-time UWB-OFDM radar-based navigation in unknown terrain, IEEE Transactions on Aerospace and Electronic Systems, 49(3), pp. 1453–1466.
Knott E.F., 1990. "Radar Cross Section" in Radar Handbook, McGraw Hill, New York.
Moses A. A., Rutherford M. J., Kontitsis M., and Valavanis K.P., 2011. UAV-borne X-band radar for MAV collision avoidance, Proc. SPIE 8045, Unmanned Systems Technology XIII, 80450U.
Nister D., Naroditsky O., and Bergen J., 2004. Visual odometry, Computer Vision and Pattern Recognition, 2004. CVPR 2004. Proceedings of the 2004 IEEE Computer Society Conference on, 1, pp. I-652-I-659.
Quist E. and Beard R., 2016a. Radar Odometry on Fixed-Wing Small Unmanned Aircraft, IEEE Transactions on Aerospace and Electronic Systems, 52(1), pp. 396 – 410.
Quist E., Niedfeldt P., and Beard R., 2016b. Radar Odometry with Recursive-RANSAC, IEEE Transactions on Aerospace and Electronic Systems, 52(4), pp. 1618 - 1630.
Rohling H., 1983. Radar CFAR Thresholding in Clutter and Multiple Target Situations, IEEE Transactions on Aerospace and Electronic Systems, AES-19 (4), pp. 608 – 621.
Scannapieco A.F, Renga A., and Moccia A., 2015. Preliminary Study of a Millimeter Wave FMCW InSAR for UAS Indoor Navigation, Sensors, 15 (2), pp. 2309-2335.
Scannapieco A.F, Renga A., Fasano G., and Moccia A., 2017. Experimental analysis of radar odometry by commercial ultralight radar sensor for miniaturized UAS, Journal of Intelligent & Robotic Systems, submitted.
Scaramuzza D. and Fraundorfer F., 2011. Visual Odometry Part I: The First 30 Years and Fundamentals, IEEE Robotics & Automation Magazine.
Vetrella A.R, Savvaris A., Fasano G., and Accardo D., 2015. RGB-D camera-based quadrotor navigation in GPS-denied and low light environments using known 3D markers, Unmanned Aircraft Systems (ICUAS), 2015 International Conference on, pp. 185-192.