SAR AND OBLIQUE AERIAL OPTICAL IMAGE FUSION FOR URBAN AREA IMAGE
SEGMENTATION
Julian Fagir, Adrian Schubert, Max Frioud, Daniel Henke
Remote Sensing Laboratories, University of Z¨urich, CH-8057 Z¨urich, Switzerland – [email protected]
KEY WORDS:Remote Sensing, Urban Area, Image Fusion, Image Segmentation, SAR, RGB Image
ABSTRACT:
The fusion of synthetic aperture radar (SAR) and optical data is a dynamic research area, but image segmentation is rarely treated. While a few studies use low-resolution nadir-view optical images, we approached the segmentation of SAR and optical images acquired from the same airborne platform – leading to an oblique view with high resolution and thus increased complexity. To overcome the geometric differences, we generated a digital surface model (DSM) from adjacent optical images and used it to project both the DSM and SAR data into the optical camera frame, followed by segmentation with each channel. The fused segmentation algorithm was found to out-perform the single-channel version.
1. INTRODUCTION
The amount of readily available SAR and optical data has been rapidly increasing in recent times, making the creation of data products using SAR / optical image fusion an interesting research topic that can support extensions, or improve existing methods. However, image segmentation based on the joint use of SAR and optical data is a rarely treated topic. A closely related area, clas-sification, has had some success, although the literature mostly concentrates on nadir-view RGB images, e.g. (Voisin et al., 2014) or (Gaetano et al., 2008).
When both the SAR and the optical sensor are mounted on the same airborne platform, facing the same direction, the optical im-ages will be in oblique view at a very high resolution. This in-creases the geometric differences between SAR and optical even more than nadir-view, but also means that both sensors see the same surfaces. This situation is uncommon and it complicates fusion-related work, but also enables new aspects, as e.g., fac¸ade detection (Schack et al., 2015). The geometric differences can also be used for 3D reconstruction via stereogrammetry (Wegner and Soergel, 2008, Sportouche et al., 2011), as multiple views of a scene may improve classification (Boulch et al., 2017). But without a digital surface model (DSM), the different geometries prevent a direct pixel-based fusion of the two data sources.
In this work, we perform a segmentation of data from the MI-RANDA35 SAR and the IGI DigiCAM RGB (red/green/blue) camera mounted on the same platform (Frioud et al., 2014). The approach is related to the optical-guided despeckling from (Ver-doliva et al., 2015), where an optical image was used as a pi-lot for guiding speckle removal of a SAR image. A DSM for geometry compensation is generated photogrammetrically from adjacent overlapping RGB images. The remaining task involves the fusion of segmentation results from very high-resolution SAR and RGB, along with a low-resolution DSM. Segmentation of RGB is performed with the gPb-owt-ucm pipeline from (Arbe-laez et al., 2011). The SAR image is focussed directly on the generated DSM to avoid interpolation and reprojection from/to slant or ground range. This point cloud is projected into the RGB frame to reweight the RGB ucm by comparing the distributions of neighboring regions. The DSM refines the RGB ucm in the same
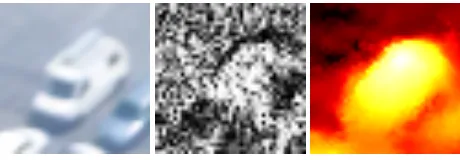
Figure 1. A crop of the van in the top right of figure 2.From left to right: RGB, SAR, DSM. The DSM is depicted in altitude.
SAR and DSM are projected into RGB view.
manner (also projected into RGB view), but with the distance of the average normal vectors used as a criterion. The two ucms generated from SAR and the DSM are then intersected for the final output of the segmentation. In contrast to the ucm output from the regular pipeline as applied to RGB, the output is also thresholded by the weights of the edges in the SAR and DSM projections.
We first describe the test site in section 2, followed by the seg-mentation steps. In section 3, the results of our experiment on the test site are shown and subsequently discussed in section 4. Section 5 concludes our work.
2. METHOD
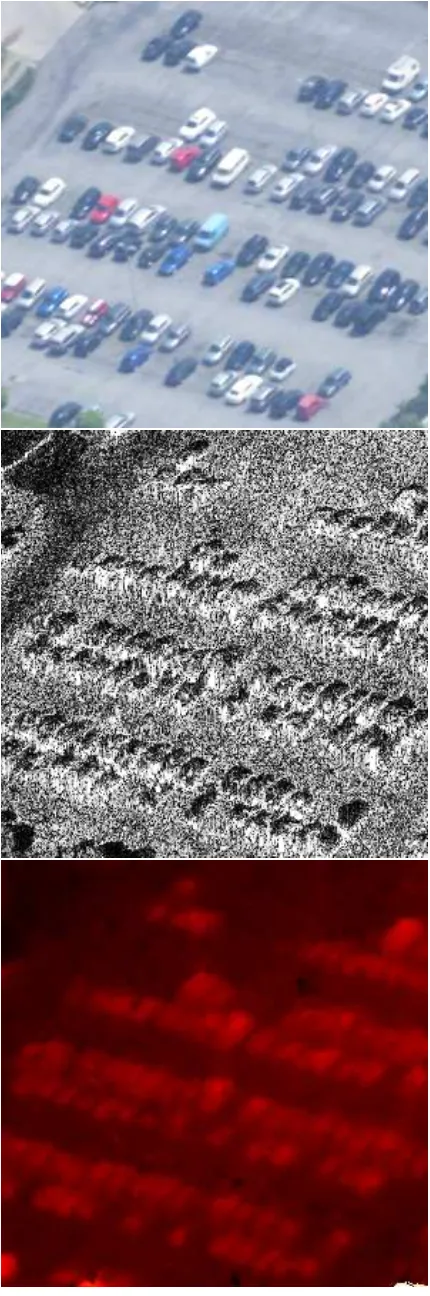
The test site under consideration was a parking lot scene in Em-men (LU), Switzerland, depicted in figure 2. The scene analyzed was300 Px×300 Px(RGB frame) that consisted mainly of as-phalt in the background and 97 cars (partially or fully visible) parked on it, colored mainly black, white and silver. Figure 1 is a close-up of the van in the top right of the image in each imaging modality. The sensors flew at an altitude of1150 m above ground, the camera and the SAR had a depression an-gle of about35◦. The resolution of40 MPxfor the IGI
Digi-CAM resulted in an on-ground resolution of about 20 cmfor RGB (the local resolution depends on the position in the im-age). The MIRANDA35 SAR was operating at a system band-width of 600 MHz(in slant range resolution corresponding to 12 cm×10 cmfor azimuth, range).
The International Archives of the Photogrammetry, Remote Sensing and Spatial Information Sciences, Volume XLII-1/W1, 2017 ISPRS Hannover Workshop: HRIGI 17 – CMRT 17 – ISA 17 – EuroCOW 17, 6–9 June 2017, Hannover, Germany
This contribution has been peer-reviewed.
The proposed segmentation fusion algorithm consists of five steps:
1. Generation and referencing of the DSM. 2. SAR image focussing
3. Projection of SAR and DSM into the optical camera frame. 4. Contour detection and segmentation for RGB.
5. Thresholding of SAR and DSM distances based on the prior RGB segmentation.
Step 1 is a preparatory step before the actual algorithm is ap-plied. The DSM is generated photogrammetrically with the soft-ware Agisoft PhotoScan Pro from subsequent images of the RGB camera. A rough referencing is performed with GPS-measured ground control points (GCPs). The airplane orientation is mea-sured with a GPS and an IMU (Inertial Measurement Unit), but the geometric calibration is not precise enough to work with these measurements alone. Thus, fine referencing is also done by match-ing the DSM with the SAR and the RGB images, keepmatch-ing the height of the selected GCPs, but rotating and translating the point cloud such that a single image suffices for reference. For the DSM, the normals for each point are generated by performing a principal component analysis (PCA) on all points in a fixed en-vironment around it and then taking the third component as the normal vector.
Focussing of the SAR image is done in step 2. With the time domain processor, the SAR image can be focussed directly onto a given digital elevation model (Frioud et al., 2014). Since the DSM is available as a point cloud, the image is directly focussed on that with a single look.
In the following step 3, the different reference systems must be transformed into a common one to be able to fuse the segmenta-tion. The DSM and SAR are available in WGS84, the camera ori-entation for RGB is given by the onboard GPS (in WGS84) and IMU (in roll/pitch/yaw). The DSM and the SAR point clouds are back-projected into the image reference system. The phase and intensity values for the SAR and for the DSM the normals (component-wise) associated with each point are interpolated lin-early to the RGB image frame.
For step 4, RGB is segmented with the Pb contour detector, which proved to be one of the best-performing algorithms in its frame-work (Arbelaez et al., 2011). Pb analyzes the histogram of an environment around each pixel. If the histogram is split in two along a line through the middle pixel, the saliency value for a pixel is then theχ2-distance between the histograms of the left
and the right part. By changing the direction along which left andrightare defined, orientation is introduced. The following oriented watershed transform(owt) is a watershed transform that weights each detected boundary by the underlying contour, deter-mined by the orientation. Theultrametric contour map(ucm) is a hierarchical segmentation from a weighted segmentation, pro-viding a tuneable parameter for changing the degree of fineness of the segments. For every pair of two neighboring regions, the boundary is assigned a weight describing the probability for its existence, i.e., the probability that these two regions are really separate. By thresholding the probability, the level of detail of the segmentation can be selected.
The motivation behind the fusion in step 5 is to take into consider-ation the different scales in which the datasets work. Even though they formally have the same resolution, the information content is different. Given a camera with comparable spatial resolution, RGB will show fine details, while speckle noise and certain kinds
Figure 2.Top:RGB image.Middle:SAR image, projected in RGB view.Bottom:Elevation map of the used DSM ranging from429 m(black) over red and yellow to432 m(white),
projected into optical camera view.
The International Archives of the Photogrammetry, Remote Sensing and Spatial Information Sciences, Volume XLII-1/W1, 2017 ISPRS Hannover Workshop: HRIGI 17 – CMRT 17 – ISA 17 – EuroCOW 17, 6–9 June 2017, Hannover, Germany
This contribution has been peer-reviewed.
of artefacts make the detail in SAR images at the same resolution more difficult to interpret in practice. The DSM has a very high precision but a low resolution, and the required filtering makes it smoother than desired.
LetucmRGBbe the ucm from the RGB image; then two new con-tour mapsucmSAR(ucmRGB)anducmDSM(ucmRGB)are gener-ated to describe the weight of the edges in the SAR and DSM domains, resp. The weight of an edge inucmSARis evaluated by the distributions of the two neighboring regions. For a boundary under consideration separating regionsrands, the amplitude dis-tributions are binned with the same bins to get the histogramshr andhsof the corresponding regions. The weight of the boundary is set to theχ2-distance betweenh
randhs: points inr. The boundary weight between regionsrandsis de-fined as the great-circle distance betweennr andns. For both SAR an DSM, the contour map is generated by iteratively merg-ing the two regionsrm,smwith minimal distance, the weight of the boundary is set tod(rm, sm), until only one region is left.
For the fusion, three thresholds must be chosen:tRGB,tSAR,tDSM. The first one is used to thresholducmRGBbefore the generation of the other ucms. Letucmtdenote all edges in the contour map
ucmthat have a probability of existence higher thant. Thus, we generate the two ucms
that is, all edges that exist in bothucm′tSAR
SAR anducm
′tDSM
DSM . Edges
that do not separate any regions insegare removed and added to the surrounding region.
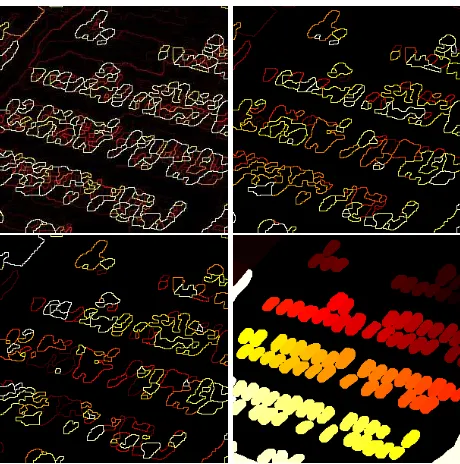
The performance of the segmentation fusion is assessed by com-parison with ground truth by the segmentation covering measure (Arbelaez et al., 2011). This measure takes the region from the segmentation that has the highest overlap for every ground truth region, and compares the ratio of the overlap to the size of the two original regions. Since the asphalt (black in fig. 3) is easy to segment and makes up roughly61 %of the image, making the coverage of single cars negligible, it is not evaluated. Ground truth (fig. 3) was determined by a human observer, instructed to mark whole cars. For both segmentations, the thresholds giving optimal results were determined.
3. RESULTS
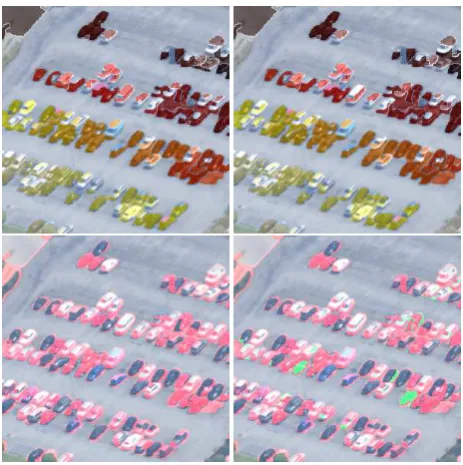
The resulting ucms of the fused and the RGB-only segmentation can be seen in figure 3. The higher the value of an edge, the more likely it is to exist. Segmentation covering values not including asphalt are27.0 %for the fused result and26.5 %for RGB-only, corresponding to a segmentation covering of64.4 %or64.3 % including asphalt. Two out of 97 cars (about2 %) could be de-tected significantly better and four out of 97 cars (4 %) could be detected slightly better with the fused segmentation compared to RGB-only. The results are shown in figure 4: For each region of the ground truth (figure 3), the corresponding selected region is transparently overlaid over the RGB image. The failmaps be-low are the RGB image again with all failed pixels transparently
Figure 3. ucms, ranging from black (low probability) over red and yellow to white (high probability).From top to bottom, left
to right:RGB-only ucm, DSM-weighted ucm, SAR-weighted ucm, ground truth labels.
overlaid in red. The failmap for the fused results also have the re-gions that are failed in RGB, but not in the fused segmentations, overlaid in green. It is noteworthy that the ground truth is de-fined via regions, while the segmentation is based on boundaries, which are not part of a region. Thus, even a perfect segmentation would not have a segmentation covering of100 %, but have the boundaries marked as fails. This is a limitation of the validation process, and not the method itself.
In the results shown, the differences between the segmentations become obvious: RGB barely distinguishes dark cars due to their low contrast with the asphalt. SAR and DSM based segmenta-tion, in contrast, find their outlines clearly. In the fused results, the mixture of the segmentation results does not degrade the abil-ity to distinguish different objects and categories. However, as is visible in figure 3, RGB is still preferred for characterizing the brightly colored cars.
One problem with the fusion method became clear: When the thresholdtRGBis too high, the separating edges are not available anymore. In the top of the fusion image, the large area over the three dark cars illustrates exactly this problem, as can be seen from the ucms in figure 3. The windshield from the van depicted in figure 1 is also not included in the thresholded ucm used as a basis forucm′
SARanducm′DSM.
4. DISCUSSION
The segmentation based on multiple sensors provides better re-sults than the RGB channel alone. We found that the airborne RGB images provide the highest level of detail, but high-level object contours are indifferently strong as low-level object con-tours and colors confuse object borders. DSM and SAR prod-ucts, in contrast, provide useful information about the geometry and surface roughness, which is especially important in urban ar-eas. But they also contain complementary information: While SAR captures even small changes and edges caused by multi-ple bounces or casting shadows, the photogrammetry-generated
The International Archives of the Photogrammetry, Remote Sensing and Spatial Information Sciences, Volume XLII-1/W1, 2017 ISPRS Hannover Workshop: HRIGI 17 – CMRT 17 – ISA 17 – EuroCOW 17, 6–9 June 2017, Hannover, Germany
This contribution has been peer-reviewed.
Figure 4.Top:Hitmap for the ucm alone thresholded at the highest segmentation covering (left) and hitmap with the presented algorithm (right).Bottom:The failed pixels marked in
red. In the fused segmentation, the fails from the RGB segmentation not present in the fused one are marked in green.
DSM is often over-smoothed. But it is also not affected by lay-over and foreshortening and thus enables a better distinction of these (predictable) areas.
The presented pipeline is based on the gPb-owt-ucm and extends the hierarchical segmentation to different sensors. But the one-way hierarchy also creates difficulties: Where RGB at the given threshold did not detect a boundary, SAR and DSM also could not. A system that enables weighted combination of all chan-nels as a preparatory step, and not only RGB, might be better suited. Pb is already older, and newer segmentations for RGB look promising both in terms of speed and segmentation results (Isola et al., 2014). However, for our scene, other results, includ-ing the intended extensions of the Pb like the global Pb (gPb), produced worse results. The weighting used for the SAR and DSM is a very simple one. For SAR, more sophisticated models exist that were already used for segmentation with good results (Rodrigues et al., 2016).
Looking at the DSM in figure 2, it is not yet understood why the height information was not used during the segmentation, as the cars are clearly distinguishable: In the oblique view, a great amount of the information is spread out vertically, e.g. building fac¸ades. For the sake of generality, the height information was not used for this experiment.
Inaccuracies in the projection pose a serious problem. In this experiment, this was circumvented by a precise referencing of the DSM. But even then, in addition to the single channels displaying different features, small misregistrations render the segmentation inaccurate and the contours in the channels in different places.
5. CONCLUSION
We have presented a new fusion scheme for the segmentation of decimeter-resolution SAR and RGB data acquired from the same
platform, based on the gPb-owt-ucm pipeline, which performs better than RGB-only input segmentation. The benefits are still small, but have the potential for further gains. The main chal-lenge faced when fusing high-resolution SAR and optical data is the different geometric representations. These were partially overcome by first generating a DSM from the optical data, then focussing the SAR data onto it, and finally projecting it into the RGB camera reference frame. Using this method, the DSM also helped to guide the segmentation.
REFERENCES
Arbelaez, P., Maire, M., Fowlkes, C. and Malik, J., 2011. Con-tour detection and hierarchical image segmentation.IEEE Trans-actions on Pattern Analysis and Machine Intelligence 33(5), pp. 898–916.
Boulch, A., Le Saux, B. and Audebert, N., 2017. Unstructured point cloud semantic labeling using deep segmentation networks. In:Proceedings of the Eurographics 2017 Workshop on 3D Ob-ject Retrieval, Eurographics Association. to appear.
Frioud, M., Wahlen, A., Wellig, P. and Meier, E., 2014. Process-ing of MIRANDA35 FMCW-SAR Data usProcess-ing a Time-Domain Algorithm. In: Proc. European Conference on Synthetic Aper-ture Radar (EUSAR), VDE.
Gaetano, R., Moser, G., Poggi, G., Scarpa, G. and Serpico, S. B., 2008. Region-based classification of multisensor optical-sar im-ages. In:Proc. IEEE International Geoscience and Remote Sens-ing Symposium (IGARSS), Vol. 4, IEEE, pp. IV–81.
Isola, P., Zoran, D., Krishnan, D. and Adelson, E. H., 2014. Crisp boundary detection using pointwise mutual information. In: Proc. European Conference on Computer Vision (ECCV), Springer, pp. 799–814.
Rodrigues, F. ´A., Neto, J. R., Marques, R. P., de Medeiros, F. S. and Nobre, J. S., 2016. Sar image segmentation using the rough-ness information. IEEE Geoscience and Remote Sensing Letters 13(2), pp. 132–136.
Schack, L., Soergel, U. and Heipke, C., 2015. Persistent scatterer aided facade lattice extraction in single airborne optical oblique images. ISPRS Annals Photogrammetry, Remote Sensing and Spatial Information Sciences2(3), pp. 197.
Sportouche, H., Tupin, F. and Denise, L., 2011. Extraction and three-dimensional reconstruction of isolated buildings in urban scenes from high-resolution optical and sar spaceborne images. IEEE Transactions on Geoscience and Remote Sensing49(10), pp. 3932–3946.
Verdoliva, L., Gaetano, R., Ruello, G. and Poggi, G., 2015. Optical-driven nonlocal sar despeckling. IEEE Geoscience and Remote Sensing Letters12(2), pp. 314–318.
Voisin, A., Krylov, V. A., Moser, G., Serpico, S. B. and Zerubia, J., 2014. Supervised classification of multisensor and multires-olution remote sensing images with a hierarchical copula-based approach.IEEE Transactions on Geoscience and remote sensing 52(6), pp. 3346–3358.
Wegner, J. D. and Soergel, U., 2008. Bridge height estimation from combined high-resolution optical and sar imagery. In:Proc. ISPRS Symposium, Beijing, IAPRS, Vol. 37, pp. 1071–1076.
The International Archives of the Photogrammetry, Remote Sensing and Spatial Information Sciences, Volume XLII-1/W1, 2017 ISPRS Hannover Workshop: HRIGI 17 – CMRT 17 – ISA 17 – EuroCOW 17, 6–9 June 2017, Hannover, Germany
This contribution has been peer-reviewed.