www.elsevier.com / locate / econbase
Observed and unobserved heterogeneity in the duration
dependency parameter
*
Michael Rosholm
´
Institute of Economics, Aarhus School of Business, Fuglesangs Alle 20, 8210 Aarhus V, Denmark Received 21 January 1999; received in revised form 30 June 1999; accepted 8 July 1999
Abstract
We present a duration model, which allows for non-homogenous duration dependence with respect to observed and unobserved variables. The model is examined in a simulation study, and it is estimated on unemployment spells of a sample of male Danish workers. 2000 Elsevier Science S.A. All rights reserved.
Keywords: Non-homogenous duration dependence; Unobserved heterogeneity JEL classification: J64
1. Introduction
Numerous papers have discussed dynamics of long-term unemployment and how negative duration dependence may lead first to long-term unemployment and subsequently to detachment from the labour market and social exclusion, e.g. Machin and Manning (1998). The problem is that when the duration of unemployment is estimated taking into account unobserved heterogeneity, there is rarely negative duration dependence. In this paper we extend an idea of Jensen (1993) to allow for observed and unobserved heterogeneity in the level as well as the slope (duration dependence) of the hazard rate in a duration model. The performance of the model is examined in a simulation study, and the model is estimated on the unemployment durations of a sample of male Danish workers. It is shown that there are indeed some groups with significant levels of negative duration dependence, in particular older workers and workers without much working experience, although the overall level of duration dependence is weakly positive.
*Tel.:145-89-486-670; fax: 145-89-155-175. E-mail address: [email protected] (M. Rosholm)
2. Data
The data consists of a flow sample (0.2%) of all unemployment spells commenced in Denmark during the period Jan. 1, 1981 to Dec. 31, 1990. It is a highly reliable data set, as it is based on registers used for UI-benefit payments. For each unemployment spell, we know the starting time, the duration of the spell, and the subsequent destination state. If the spell does not end before Dec. 31, 1990, it is right censored. In this paper, we are only interested in unemployment spells that end with a transition into a new job, that is, we treat all other destinations as independent right censoring. If a person has sequences of unemployment–nonparticipation–unemployment, the second unemployment spell is removed, as it seems unjustifiable to treat this as a fresh unemployment spell.
For the purpose of the present analysis, we select men in the age group 25–59. The sample contains 1239 individuals with a total of 6656 fresh unemployment spells, of which 3420 end with a transition into a new job.
A number of explanatory variables are available; Previous state is an indicator for being nonparticipant immediately before the unemployment spell (the reference category being employed).
Experience measures actual working experience, and its square is also used. Educ0-9 (reference
category), Educ10–11, Educ12, Educ13–14, Educ15–16, Educ171 are indicators of the length of formal education. Age25–29 (reference category), Age30–39, Age40–49, and Age50–59 are age group indicators.
3. Econometric model
Let T be a random variable measuring the time in unemployment until a new job is found. In most studies, the hazard rate at time t, defined as the instantaneous escape rate from unemployment at time
t, is specified as a mixed proportional hazard, that is
h t
s
ux,vd
5ls dt ?exp(xb1v) (1)where x is a vector of observed variables, and v is unobserved. This specification allows for differences in the level of the hazard rate across individuals. However, the slope of the hazard rate, the amount of duration dependence, is assumed to be the same for all individuals. To allow for the possibility of observed and unobserved heterogeneity in the baseline hazard, ls d? , consider the Weibull hazard, which writes
a21
h t
s
ux,vd
5a?t ?exp(xb1v) (2)Allowing for observed and unobserved heterogeneity in duration dependence meansa5asx,z , whered z may or may not equal v. Thus, it is no longer a proportional hazards model. Assume that
asx, zd5exp(xg1z) (3)
` ` not identified with single-spell data, that is, multiple spells are required for at least some persons in the sample.
4. Simulations and results
Two models are estimated; the standard Weibull mixed proportional hazard rate model corre-sponding to a hazard rate like (2) above, and the more general specification with the Weibull parameter specified as (3) above. The mixing distribution is assumed to be discrete with 2 points of support in the standard model (C1 and C ) and 22 32 points of support in the more general specification (the two values taken by the unobserved variable z are denoted a1 and a2 in the table
1
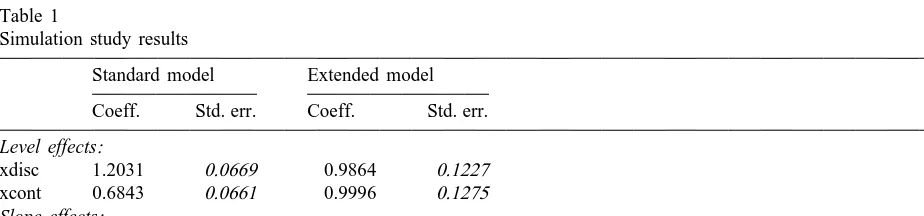
below). To assess the performance of the estimator in the case of misspecification of the unobservables’ distribution, we first conduct a simulation study. We generate a data set with 500 persons, each with 3 unemployment spells. There are two observed variables, xdisc and xcont, one discrete and one continuous. The true model is
a(x, z)21
h(tux,v, z)5exp(v1xdisc1xcont)?a(x, z)?t
a(x, z)5exp(z10.1?xdisc20.1?xcont)
v, z|BVN(23,0, 0.5, 0.1, 0.5)
that is, v has mean 23 and variance 0.25, z has mean zero and variance 0.01, and the correlation between the two variables is 0.5. Of course,v, z is individual specific. The dataset was generated and the model estimated 100 times. Table 1 reports the mean estimates and standard deviations of the
Table 1
Simulation study results
Standard model Extended model Coeff. Std. err. Coeff. Std. err. Level effects:
parameters of interest. As can be seen, the model performs fairly well, in terms of approaching the true values of the parameters of interest, whereas the standard Weibull model does not.
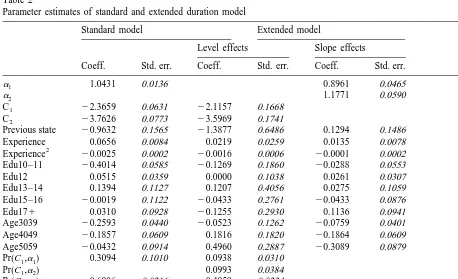
The results of the estimation on real data are reported in Table 2. The results demonstrate clearly that the proportional hazards model hide a number of important points. Firstly, in the standard model there is positive duration dependence, whereas in the more general specification, there is much variation in duration dependence across individuals, with respect to observed as well as unobserved variables. For those who were nonparticipants before registering as unemployed, the hazard rate is much lower initially than for those who were employed, but the difference decreases over time due to more positive duration dependence for the first group. The effect of experience is seen to become a slope effect in the more general specification — more experience leads to more positive duration dependence. For the age dummies, the standard model estimates a negative level effect for all age groups, when compared to the 25–29 year olds. However, the hazard rate is lowest for the 30–39 year olds, and thereafter increases with age. In the more general specification, the results change dramatically. The level effect is now increasing in age, at least from the age group 30–39, and the slope effect is strictly decreasing in age. That is, the older a person is the higher is his hazard rate when he becomes unemployed. However, his hazard rate falls much faster (or increases more slowly) than that of a younger person. With respect to unobservables, note that there is a significant difference in the parameter estimates of a1 and a2.
Table 2
Parameter estimates of standard and extended duration model
Standard model Extended model
Level effects Slope effects
Coeff. Std. err. Coeff. Std. err. Coeff. Std. err.
a1 1.0431 0.0136 0.8961 0.0465
a2 1.1771 0.0590
C1 22.3659 0.0631 22.1157 0.1668
C2 23.7626 0.0773 23.5969 0.1741
Previous state 20.9632 0.1565 21.3877 0.6486 0.1294 0.1486
Experience 0.0656 0.0084 0.0219 0.0259 0.0135 0.0078
2
Experience 20.0025 0.0002 20.0016 0.0006 20.0001 0.0002 Edu10–11 20.4014 0.0585 20.1269 0.1860 20.0288 0.0553
Edu12 0.0515 0.0359 0.0000 0.1038 0.0261 0.0307
Edu13–14 0.1394 0.1127 0.1207 0.4056 0.0275 0.1059
Edu15–16 20.0019 0.1122 20.0433 0.2761 20.0433 0.0876
Edu171 0.0310 0.0928 20.1255 0.2930 0.1136 0.0941
Age3039 20.2593 0.0440 20.0523 0.1262 20.0759 0.0401
Age4049 20.1857 0.0609 0.1816 0.1820 20.1864 0.0609
Age5059 20.0432 0.0914 0.4960 0.2887 20.3089 0.0879
Pr C ,s 1a1d 0.3094 0.1010 0.0938 0.0310
Pr C ,s 1a2d 0.0993 0.0384
Pr C ,s 2a1d 0.6906 0.0216 0.4059 0.0234
Pr C ,s 2a2d 0.4011 0.0384
5. Conclusion
In this paper we have presented a generalization of the Weibull duration model, which allows for non-homogenous duration dependence, both with respect to observed and unobserved variables. The model is identified with repeated spells. Monte Carlo simulations show that the model is robust to misspecification of the distribution of unobservables. Further, it is shown that in many cases the proportional hazards model is too restrictive in the sense that it hides some points that are important for policy making, such as the extent and distribution of negative duration dependence. It is seen that duration dependence is more negative for older age groups, and that it is more negative the less previous working experience a person has.
Acknowledgements
I am grateful to an anonymous referee for some very helpful suggestions.
References
Heckman, J.J., Singer, B., 1984. A method for minimizing the impact of distributional assumptions in econometric models for duration data. Econometrica 52 (2), 271–320.
Jensen, P., 1993. Heterogeneous duration dependence: econometric methods and empirical evidence. In: Bunzel, H., Jensen, P., Westergaard-Nielsen, N. (Eds.), Panel Data and Labour Market Dynamics, North-Holland.