ANALYSIS
Rethinking the optimal level of environmental quality:
justifications for strict environmental policy
Amy Farmer
a, James R. Kahn
b, Judith A. McDonald
c,*, Robert O’Neill
daDepartment of Economics,Uni6ersity of Arkansas,AR,USA
bEn6ironmental Studies Program and Department of Economics,Washington and Lee Uni6ersity,USA cDepartment of Economics,Lehigh Uni6ersity,621Taylor Street,Bethlehem,PA18015-3117,USA
dEn6ironmental Sciences Di6ision,Oak Ridge National Laboratory,USA
Received 25 October 1999; received in revised form 24 August 2000; accepted 5 September 2000
Abstract
Traditional environmental theory suggests that the optimal level of a pollution emission occurs when the marginal damage created by the emissions is equal to the marginal cost of reducing the emissions. We argue that the benefits from reducing pollution should be much more broadly defined to include at least three other sources of benefits. First, we develop a game-theoretic model in which firms may under-invest in cost-saving ‘green technologies’. Second, we demonstrate that consideration of future damages and abatement costs leads to a lower current optimal pollution level than that obtained in traditional models. Finally, we show that ecological complexity creates indirect pathways by which greater pollution increases the likelihood of generating irreversible environmental damage. This broader definition of the benefits of pollution abatement yields an optimal level of pollution that may actually belessthan the level at which conventionally-measured marginal damages are equal to marginal abatement costs. Thus, environmen-tal policy should be stricter. © 2001 Elsevier Science B.V. All rights reserved.
Keywords:Environmental policy; Game-theoretic model; Ecological complexity; Environmental benefits; Environmental damages; Ecological services
www.elsevier.com/locate/ecolecon
1. Introduction
Excessive levels of environmental degradation occur when those making decisions about using resources do not consider social costs. This
omis-sion generates a market failure and creates a need for policy intervention to correct the market fail-ure. However, before policy-makers intervene to attempt to correct this externality, they must have a policy goal, which, in the case of pollution, should be the optimal level of pollution. In deter-mining policy addressing environmental degrada-tion such as polludegrada-tion or land-use changes, it is essential to value the damage accurately and then * Corresponding author. Tel.: +1-610-7585345; fax: +
1-610-7584677.
E-mail address:[email protected] (J.A. McDonald).
to compare it with the costs of preventing the degradation. Measuring the damage carefully is a critical and very difficult part of this process because estimating economic value entails many practical problems.1
Traditional environmental economic theory suggests that the optimal level of a pollution emission occurs when the marginal damage cre-ated by the emissions is equal to the marginal cost of reducing the emissions. Lately, this result has been challenged by those who postulate that the optimal level of pollution may actually be less than the level at which conventionally measured marginal damages are equal to marginal abate-ment costs. This result is not due to an abandon-ment of optimization and marginal analysis, but to a broader definition of the benefits of pollution abatement. In general, advocates of ‘strict envi-ronmental policy’ believe that the benefits from reducing the level of emissions are greater than the economic value of the direct physical damages that are prevented by lowering emissions.
This paper focuses on this broader definition of the benefits of pollution abatement and presents theoretical arguments to determine whether there is reason to rethink what constitutes the optimal level of pollution. After more explicitly discussing the traditional view of the optimal level of pollu-tion (and associated policy making) in Secpollu-tion 2, three categories of potential benefits associated with stricter environmental policy are defined. In Section 3, we develop a model in which firms may under-invest in ‘green technologies’ due to the leader firm’s inability to prevent other firms from imitating its innovation if successful, and not following (and thus having lower costs and poten-tially useful information about the correct way to innovate successfully) if the leader firm’s innova-tion fails. In this case, government interveninnova-tion in the form of stricter environmental regulation would lower production costs in a fashion similar to what has been suggested in the ‘Porter Hypoth-esis’ (Porter, 1990, 1991). Section 4 examines the optimal level of current pollution in a dynamic
context. Consideration of future damages and abatement costs also leads to a lower current optimal pollution level than that obtained in tra-ditional models. Section 5 looks at the importance of ecosystem complexity and nonlinearities which can lead to thresholds and irreversibilities, intensi-fying the potential damages associated with a given level of pollution emissions.
These three factors broaden our perceptions of the damages arising from pollution which leads us to argue that the optimal level of pollution is lower than conventionally determined and that environmental policy should be stricter than is currently the case.
2. The traditional view of the optimal level of environmental quality
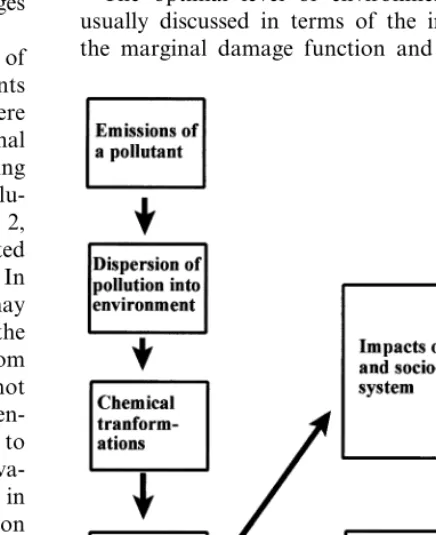
The optimal level of environmental policy is usually discussed in terms of the intersection of the marginal damage function and the marginal
Fig. 1. Schematic of marginal damage function. 1See Georgiou et al. (1997), Bjornstad and Kahn (1996),
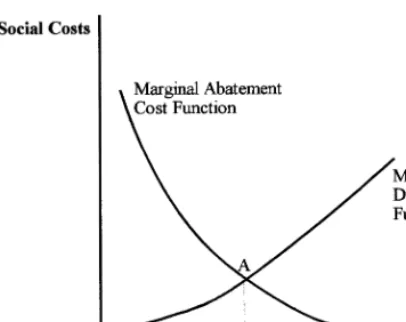
Fig. 2. The optimal level of pollution.
ally lower their production costs. The argument is that stricter environmental standards force firms to be more efficient in converting inputs to eco-nomic outputs as they seek methods to reduce their production of waste outputs. Porter argues that this reduction in cost will increase the inter-national competitiveness of US firms and have positive impacts on balance of payments, employ-ment, and other macroeconomic variables. Of course, many economists question the underlying premise of these arguments; if cost savings oppor-tunities exist, why don’t firms take advantage of them without government intervention?
Palmer and Simpson (1993) and Oates et al., (1993) examine this question and critically evalu-ate three possible explanations of why these un-seized opportunities exist. These are: (1) firm stupidity; (2) firm short-sightedness and the fixed-cost nature of abatement activities; and (3) the public good properties of research and development.
Although corporation-bashing is a popular ac-tivity and there are certainly a number of firms that make apparently stupid decisions, firm stu-pidity is not a particularly satisfying explanation for the existence of these unseized opportunities. While a number of ‘stupid’ firms may exist at any point in time, Darwinian market forces should favor the existence of smart firms over stupid firms in the long run.
The second argument, which is related to the first, is that firms are short-sighted and will not incur short-term costs in order to achieve long-term gain. This point is articulated by Simpson (1993), who argues that the way green technolo-gies reduce costs is that the firm incurs initial increases in fixed cost (e.g., more energy efficient and less polluting capital) that result in reductions in variable cost over the lifetime of the capital (e.g., less energy consumption, less waste gener-ated, and less waste disposal cost). While this argument has more appeal than the first, and there is certainly much anecdotal evidence sug-gesting that many firms are myopic, Simpson notes that Darwinian market forces should favor the survival of far-sighted firms over short-sighted firms in the long run.
abatement cost function. The marginal damage function shows pollution as a function of emis-sions of a particular pollutant, and is actually composed of a chain of functional relationships, as depicted in Fig. 1. The marginal abatement cost function shows the cost of reducing emissions below the level that would take place in an unreg-ulated market economy (Eu in Fig. 2). The opti-mal level of pollution occurs atE* and minimizes the total social damages from emissions (the area OAEuof Fig. 2).
There is no question thatE* is the optimal level of emissions of pollution because it minimizes the sum of total abatement costs (area AEuE*) and total damages (area OAE*). Our argument does not conflict with this important principle. Rather, our argument is that as traditionally conceptual-ized (and sometimes measured), the marginal damage function represented by the flow diagram in Fig. 1 and illustrated in Fig. 2 excludes impor-tant damages from emissions, or conversely, does not include important benefits arising from reduc-ing the level of pollution.
3. The effect of strict environmental policy on production costs
actu-The third explanation is that research and de-velopment into cost-saving green technologies has public good benefits since innovations are easy to copy. Because firms only respond to private benefits, there is insufficient expenditure on re-search and development of green technologies. Porter goes further to argue that forcing the green technology will not only lower cost, but lower cost relative to foreign competitors. The second part of this argument follows from the first only if it is assumed that innovations that are easily copied by domestic rivals are not as easily copied by foreign rivals.2
Thus, unless inter-country copying is difficult, domestic firms would not be likely to develop and maintain a competitive edge over foreign rivals.
Although these three reasons provide insuffi-cient support for the Porter Hypothesis, we ad-vance an argument that may explain the potential existence of unseized cost-saving opportunities. This discussion, based on the strategic behavior of firms, follows below.
3.1. Insufficient in6estment in green technologies
as a game-theory problem
This part of our paper builds on the idea that there may be unseized cost-reducing opportunities by illustrating a situation in which individual firms will choose not to adopt a potentially cost-saving green technology that would raise the ex-pected profits of all firms in the industry. This situation is generated by the existence of asym-metries in the realization of the potential gains from innovation that are generated by strategic
behavior. Under such circumstances, we demon-strate a case in which intervention may be re-quired to encourage risk-neutral, profit-maximizing firms to adopt a technology that will raise expected profits.
Some researchers (see, e.g., Simpson 1993, p. 26) claim that ‘strong’ environmental policy is inferior to both direct production subsidies and R&D subsidies in terms of advancing industrial policy objectives by inducing innovation expendi-tures. In the discussion that follows it is the existence of strategic behavior rather than market failure (such as some flaw in the capital market that would better be fixed by governmental subsi-dies to R&D) that causes a sub-optimal outcome. In this case, the traditional solutions to market failure, such as ‘fixing’ capital markets or R&D subsidies, would not change the strategic behavior unless they would address the asymmetry that gives rise to the strategic behavior.3
Therefore, strict en6ironmental policy may be the first-best
policy because it impacts directly on strategic beha6ior.
The intuition driving the possibility that such an inefficient outcome will occur without inter-vention is as follows. Suppose that a particular abatement technology exists, but the potential impact of its adoption on production costs is unknown ex ante. If one firm takes the lead in adoption, the remaining firms make their decision with superior information. Whichever firm makes the initial investment bears the sole cost of gather-ing the information. If the new technology lowers production costs, the remaining firms in the in-dustry will follow the original firm’s adoption decision and the benefits of the cost savings are shared. However, if the technology has no impact or possibly even a negative impact on production costs, then no other firms will choose to follow and adopt the technology; thus, the leading firm 2There are a variety of differences in culture, economic
institutions, social institutions, human capital and technology that can impact the process of diffusion and adoption of technology. Therefore, the speed at which an innovation that occurs in one country is adopted by another country will vary by technology and country. For example, many Pacific rim countries are noted for the rapid introduction of new technolo-gies and, in fact, some of these countries do not enforce copyrights and intellectual property rights that originate in other countries. Thus, one cannot make a general proposition that innovations are or are not easily copied across countries. However, if only a subset of countries copy the innovation, the competitive advantage will be lost.
bears all of the costs of acquiring the information. This asymmetry implies that it may be possible for the expected benefits of the technology to exceed the expected costs for every firm in the industry if they were all to simultaneously adopt, but still no firm has the incentive to be the first. In short, it pays to be a follower rather than a leader and the strategic role of timing can result in a Pareto inferior solution for the industry.
It is straightforward to illustrate a Cournot duopoly example in which both firms’ expected profits rise if they are required to adopt the technology, but, independently, neither will make the choice to adopt. The illustration presented below is not intended to show that firms will never take the lead and adopt new potentially cost-saving technologies. Without explicit data, it is impossible to make general statements concern-ing the prevalence of this problem across indus-tries. It is our goal to demonstrate through the use of an example the potential need for interven-tion to achieve optimality. Specifically, what this example does show, however, is that situations do exist in which a technology that will raise firms’ expected profits is not adopted because of this type of strategic behavior. Since standard eco-nomic intuition suggests that regulation is not needed to induce firms to undertake ventures that are profitable, we use a set of specific (but reason-able) assumptions to develop a counter-example illustrating that this intuition is not necessarily correct and should be re-evaluated. Of course, further research is needed to determine particular industries to which these difficulties might apply. Through our counter-example, we are simply sug-gesting that strategic behavior might imply the need for stricter environmental regulation and that this issue should be further investigated.
Consider a simple example in which two identi-cal, risk-neutral, Cournot competing firms have a constant marginal cost of production equal to k. They face a market demand for their product of P=A−BQ, where Q is their total output. A technology exists and costs C to adopt and, if adopted, this technology results in a new marginal cost equal to k%, which may be larger or smaller
thank. Althoughk%is unknown, its distribution is
common knowledge. If the distribution were
un-known, it would further strengthen our arguments as the additional uncertainty would create greater incentive to be a follower.
It is obvious that each firm prefers to follow. But, if a firm’s opponent refuses to lead, the decision must be whether to lead or accept the status quo. In order to reach a decision, the firm must consider the potential equilibrium outcomes and profits that may result in either case, in order to reach a decision. Consider first the decision to accept the status quo.
3.1.1. Firm 1 does not adopt
If neither firm takes action, then each simply chooses output to maximize profit of
p1=P(Q)q1−kq1 (1)
where Q=q1+q2. After finding standard Cournot reaction functions and solving for the equilibrium, this strategy yields each firm the fol-lowing profit level:
p1=p2=(A−k)
2
9B (2)
3.1.2. Firm 1 chooses to lead
If instead firm 1 chooses to be a leader and adopt the technology at a cost of C, the resulting marginal cost isk%(which may be higher or lower
thank). The important question is whether or not firm 2 will follow. Prior to computing firm 1’s expected profit from leading, it is necessary to isolate firm 2’s reaction strategy and the equi-librium profits that will result in either case.
In the first case, when firm 1 chooses to lead, firm 2 follows. In this case each firm spends the fixed adoption cost and then chooses the optimal Cournot output given its new marginal cost k%.
Final equilibrium profit for each firm is then
p
1=p2=
(A−k%)2
9B −C. (3)
marginal cost of both firms because each firm is reacting to the other’s strategy, and equilibrium output is simultaneously determined. Profits are found in Eqs. (4) and (5) below:
Comparison of Eq. (3) and (5) reveal that firm 2 will follow firm 1 and adopt the technology iff
k−k%] 9BC
4(A−k). (6)
Note that if adoption is costless (C=0) then firm 2 chooses to adopt as long as the new technology reduces costs (k\k%). Otherwise, if adoption costs
are positive, then the cost savings must be suffi-ciently large to induce adoption. Note also that the larger the demand, the smaller this per unit savings must be to encourage adoption by firm 2.
3.1.3. Firm 1’s initial decision
Given that firm 2 will adopt only if Eq. (6) is satisfied, firm 1 must decide whether or not to choose to be a leader. This decision depends upon the probability that Eq. (6) will ultimately hold, as well as on the profits firm 1 can expect in each instance. Firm 1 faces three possibilities. The first possibility is to maintain the status quo and receive profits found in Eq. (2), while the second is to adopt the technology and firm 2 will follow. Profits are found in Eq. (3) wherek% is small enough to have
encouraged following. The third possibility for firm 1 is to adopt the technology, firm 2 does not follow, and profits are found in Eq. (4).
Let us consider this problem first for some general distribution of the final marginal costs. Defineoto bek%−k; note that this will be negative
if the new technology reduces costs. Then ifoB−
9BC/4(A−k), adoption will be followed by firm 2. Given some known distribution of o, firm 2 will follow with probabilityF(−9BC/4(A−k)). Firm 1’s expected profit from adoption is then the expected profit in each case conditional on the values ofo that would induce each case, weighted
by the probability that o falls in that range. Firm
1 will take the lead if this expected profit exceeds the status quo. More specifically, firm 1 will adopt the technology iff
Note that the first term is the expected profit to firm 1 when firm 2 follows (Eq. (3)) conditional on
o being small enough to induce firm 2 to follow, weighted by the probability that o fits that
con-straint. The second term is a similar expression when following does not occur (Eq. (4)) and the right-hand side is the equilibrium expected profits if the status quo is maintained (Eq. (2)).
3.1.4. Efficient simultaneous adoption
Eq. (7) identifies the necessary condition for either firm to be willing to assume a leadership role and adopt the technology. However, if both firms could simply agree to simultaneously adopt the technology prior to any knowledge of its cost effects, then they would both benefit from doing so if expected Cournot profits given the distribution ofk%exceed profits given in Eq. (2). This occurs iff
E
(A−k%) 29B −C
n
\E(A−k)2
9B
n
. (8)After some algebraic manipulation, this condition simplifies to
2(k−A)E(o)+E(o2
)\9BC. (9)
text. It will be shown that current decisions about the target level of pollution can have beneficial effects on future periods and actually influence the optimal level of pollution. Two types of dynamic the relevant condition from the standpoint of the individual firm.
The obvious question then becomes whether there are situations in which Eq. (9) holds (i.e., both firms would be better off if they were somehow forced to simultaneously adopt this technology), but Eq. (7) does not hold (i.e., neither firm will make that choice independent of regulation).
To answer this question, we use a very simple distribution foro to illustrate a case in which this
will occur. Supposek%is eitherk+1 ork−1 each
which occurs with probability 0.5. In other words,
o is either +1 or −1 with probability 0.5. To
simplify the example further, let us assume that adoption costs are zero. SinceC=0 andE(o)=0,
Eq. (9) implies that adoption would be optimal if E(o2)\0. In this example,E(o2)=1, thus adoption is optimal for every value of the parameters.
However, we can illustrate that neither firm has the incentive to take the lead independently. From Eq. (6) we know that firm 2 will choose to follow if it turns out thatk%Bk(i.e, ifoB0). Substituting
k%=k+ointo Eq. (7), we know that firm 1 will take
the lead and adopt the technology if
F(0)E
(A−k−o)Note first that for this specific distribution F(0)=0.5 and 1−F(0)=0.5. Computing the ex-pected profits conditional ono(whether or not firm
2 follows) is straightforward in this simple example. In the case that firm 2 chooses not to follow then
o \0; the distribution onoimplies thato =1 and
therefore firm 1’s expected equilibrium profits will ultimately be
Substituting both the probabilities and the con-ditional profits into Eq. (7), we find that firm 1 will adopt the new technology if A−kB5/2. In other
words, if demand is sufficiently large relative to costs, firm 1 will not choose to lead and adopt the technology first. Of course, since firms are identical, if firm 1 is willing to accept the status quo rather than adopt the technology, so too is firm 2. Recall, however, that for every value of the parameters, simultaneous adoption raises both firms’ expected profits.
Although this basic example does not prove a general result, it does illustrate a simple point. Circumstances can exist in which the welfare of each and every firm will be improved if they are forced to implement a technology that they would not otherwise choose to implement. Individual strategic behavior can generate a Pareto inferior equilibrium in which some form of binding contract or outside intervention is needed to assist firms in moving to a superior equilibrium. Although the idea that firms may need external coordination to help them achieve the Pareto efficient solution is not new, the implications of this for environmental policy are new and important: under certain cir-cumstances firms would not adopt cost-saving green technologies without government interven-tion. Thus, stricter environmental policy could raise social welfare, not only through improving envi-ronmental quality, but also through decreasing the costs of production.
4. Dynamic considerations and the current benefits of emissions abatement
con-interaction are examined. First, the impact of current target levels of pollution on technological innovation and future abatement costs is ana-lyzed. Second, the impact of prior period emis-sions on later period damages is examined.
Before examining the dynamic considerations, it is useful to derive the optimal level of pollution in the static case. This is shown below in Eq. (13), where the total social costs of pollution (TSC) are the sum of abatement costs (TAC) and the dam-ages from the remaining emissions (TD). Solving Eq. (13) gives the familiar result that the level of emissions is chosen so that marginal abatement costs (MAC) and marginal damages (MD) are equal in each period:
Min TSC=TAC(Q)+TD(Q) wrtQ
dTAC dQ B0,
dTD
dQ \0. (13)
This model can be made slightly more sophisti-cated by allowing the preference for environmen-tal quality to be increasing over time, as in Eq. (14),
Although the optimal level of pollution will be declining over time, optimality still requires MAC to equal MD and the model is still basically a static model as each period’s decision is indepen-dent of every other period.
Similarly, adding exogenously-determined tech-nological innovation (which is represented by making TAC a decreasing function of time in Eq. (15)) creates an optimal pollution path that is declining over time. However, as in the above case, each period’s decision is independent of the decision in every other time period.
Min
&
However, if technological innovation is not only related to the passage of time, but also to current incentives to innovate, a very different picture emerges. In Eq. (16), an optimization problem is considered in which the costs of abate-ment are a function of the state of technology, (TECH), and the current rate of technological innovation (d) is a function of the state of tech-nology and current incentives for technological innovation (current total abatement costs):
Min
&
Eq. (17) contains the Hamiltonian for this opti-mization problem and the optimality condition and co-state equation are contained in Eq. (18). Eq. (19) contains the solution to the optimality condition and shows that when technological in-novation is endogenous, optimality is not deter-mined by an emission level where current marginal damages equal current marginal ment costs, but one where current marginal abate-ment costs are greater than current marginal damages. If marginal abatement costs are a de-clining function of emissions and marginal dam-ages are an increasing function of emissions, the optimal level of emissions in a given period will be less than the level at which that period’s MAC equals that period’s MD.
This is an extremely important result because it illustrates that even if emissions at time t only cause damages at timet, the determination of the optimal level of pollution at any point in time is a dynamic problem, which must take into account the impact of the current level of regulation on future abatement costs. In other words, today’s strictness improves future welfare by generating reduced costs of abatement in the future. These reduced costs mean that the future can obtain better environmental quality at a lower abatement cost. Strict environmental policy cannot only be viewed as a potentially more efficient policy, but it can also be viewed as a form of investment, allowing future periods to obtain higher levels of both environmental quality and GDP. This does not mean we should implement the most strict policies possible, as cost savings in the future must be balanced against the costs imposed at the present time.
Previously, dynamic considerations in the deter-mination of optimal emissions levels were only thought to occur when the emissions from one period accumulated into future periods and caused damages in future periods (such as emis-sions of DDT, heavy metal, CFCs, or CO2). This intertemporal dependency is well discussed in the literature4, but may be even more important than suggested because this type of dynamic consider-ation would also occur even if the emissions do not accumulate, but if ecological stresses do. For example, emissions of nitrogen oxides, sulfur ox-ides, and volatile organic compounds have rela-tively short residence periods in the atmosphere, as does tropospheric ozone, the by-product of their interaction. However, the stress that this period’s ozone generates for ridge-top forests may make them more susceptible to damage from ozone in future periods5
.
5. The importance of ecological complexity
Ecological services are an important source of
social benefits that are not often explicitly consid-ered when measuring the damages associated with environmental degradation. Ecological services in-clude outputs of ecosystems, such as nutrient cycling, waste assimilation, maintenance of local and global climate, carbon sequestration, biodi-versity, watershed protection and soil formation. Ecological services are important at many levels. At the most basic level, they provide life support services for humans and other species. They also provide basic inputs to economic processes as crops grow better in a clean air environment, and beer and other products are cheaper to produce if you start with clean water. At a more complex level, the economic and social systems are con-tained within the larger environmental system. The more productive the ecosystem in terms of the production of ecological services, the greater the prospects for economic productivity and the quality of life in general [see Kahn and O’Neill (1999) for further discussion].
Another justification of the importance of eco-logical services (in an area where they have been traditionally excluded from economic consider-ation) can be found in a criticism of the econom-ics literature’s discussion of sustainability. For example, Hartwick (1977) examines the prospects for sustainability when output is produced by human-made capital, labor and exhaustible re-sources. He finds that sustainability is feasible if the rents from the exhaustible resource are re-in-vested back into human-made capital. In the nar-row context of this model, he is correct. An important, but justifiable assumption of this model is that human-made capital and labor are good substitutes for exhaustible resources (such as oil or iron).
However, let us consider the case where, in addition to labor, human-made capital and ex-haustible resources, productive inputs include en-vironmental resources that provide ecological services. In this case, the Hartwick rule will break down (see Franceschi and Kahn, 1999a and Franceschi and Kahn, 1999b) as the depletion of environmental resources cannot be compensated for by investing in additional human-made capi-tal, as human-made capital is not a good substi-tute for environmental resources. This assertion may at first seem absurd, as one might expect that 4See, for example, Ko et al., (1992), Brito and Intriligator
(1987) and Benford (1998).
ecological services such as nutrient cycling, waste processing, and soil formation can be provided by the application of labor and human-made capital in human-engineered systems. However, at the scale that the ecosystems provide these services, it is completely infeasible to produce these ecological services in human-engineered systems. For exam-ple, Costanza et al. (1997) estimated the ecosystem services provided by the world’s oceans would cost about US $20 trillion per year to replace with human technology.
The argument above suggests that ecological services are important. The value of ecological services has traditionally been excluded from the measurement of the damages from environmental degradation. Indeed, this exclusion itself supports the view that the traditional conception of the optimal level of emissions is too high and that a higher level of environmental quality would be a potential Pareto improvement. The existence of non-linearities, complexity and irreversibilities in ecological relationships strengthens these arguments.6
In economics, all functional relationships tend to be viewed as marginal. A marginal change in variableXgenerally leads to a marginal change in variable Y. However, in both ecological and eco-nomic relationships, this is often not true.7 It is particularly true when marginality is not viewed in the strict mathematical sense (a change of arbitrar-ily small nature), but in a policy sense where marginal would refer to the smallest types of adjustments that are possible with policy or that would take place in the absence of policy. This non-marginality from a policy perspective may take the form of a nonlinear, but continuous damage function, where a small (but discrete) change in one variable leads to an extremely large change in other
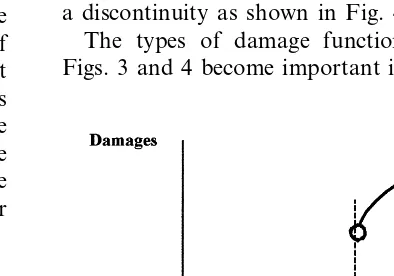
Fig. 3. Nonlinear damage function.
variable(s). For example, initially, marginal changes in carbon dioxide emissions will lead to marginal changes in atmospheric concentrations of carbon dioxide, which will lead to marginal changes in global temperature and marginal changes in social welfare. However, global temperature will eventually rise to the point where positive feed-backs occur (such as the melting of the tundra and the massive release of methane, a powerful green-house gas), causing an accelerating increase in both concentrations of greenhouse gases and global temperature. Thus, thresholds may be crossed (O’Neill et al., 1989) leading to marginal damage functions such as the one in Fig. 3, where emissions in excess of E1 are associated with very large damages. The threshold may also take the form of a discontinuity as shown in Fig. 4.
The types of damage functions presented in Figs. 3 and 4 become important in the context of
Fig. 4. Discontinuous damage function. 6The argument is further strengthened by the existence of
complex relationships among pollutants, which often lead to non-linear relationships between emissions (such as ozone precursors) and ambient concentrations of pollution (such as tropospheric ozone).
irreversibility. A conventional perspective of eco-nomics is that most activities are reversible. While the existence of irreversibilities has long been rec-ognized in environmental economics8, irreversibil-ities have generally been viewed as the direct consequence of economic activity. For example, Krutilla and Fisher (1975) use examples involving the conversion of unique natural environments, such as daming a wild river or mining in a wilderness area. Other examples of irreversibilities discussed in the environmental economics litera-ture involve the emissions of long-lived pollutants that accumulate in the environment (heavy metals, dioxins, DDT, carbon dioxide, PCBs, CFCs, etc.) and the extinction of species through over-harvesting.
Kahn and O’Neill (1999) introduce the concept of indirect irreversibilities, whereby economic ac-tivities affect the complex interactions of species and ecological communities and generate new equilibria which are substantially different than the existing equilibria. As these interactions are impacted by economic activity, irreversible change is generated as other species or other ecological communities have gained a competitive advan-tage, preventing the return of the initial equilibrium.
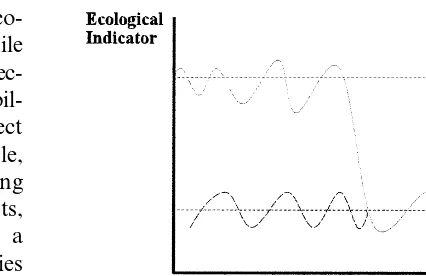
A good example of this can be found in the ridge-top forests of the Southern Appalachian Mountains. Ridge-top spruce and fir forests are stressed by the synergistic impacts of acid rain, tropospheric ozone, and non-native insects. These stresses are weakening the spruce and fir and allowing other species to become established. If some time in the future the stresses are removed, the spruce and fir forests will not be able to re-establish themselves as the other species be-come established and maintain a competitive ad-vantage. This process is illustrated in Fig. 5, where the horizontal axis measures the level of environmental degradation or stress and the verti-cal axis measures an ecologiverti-cal characteristic which is an indicator of the health of that particu-lar ecosystem. This ecological characteristic will
Fig. 5. Ecological instability and environmental change. fluctuate with changes in environmental charac-teristics (such as climate), but as the environmen-tal degradation increases, the character of the fluctuations changes. The amplitude increases and there may be a gradual downward trend. Eventu-ally, a bifurcation occurs, and the system will flop to a new equilibrium. Even if the environmental degradation is reduced (as shown by the fluctuat-ing dotted curve), the system will not restore the original equilibrium.9
The above discussion suggests that the target level of environmental quality should be more ambitious than the level that is traditionally ad-vanced in both the economics literature and in the policy process. First, ecological services have not been included in the quantitative measures of the benefits of environmental improvement. Second, ecological complexities and non-linearities imply an additional source of irreversibility that has not been articulated in the economics literature. Kru-tilla and Fisher (1975) and Arrow and Fisher (1974) argue very persuasively that the presence of irreversibility and uncertainty generates the need for more caution when considering the target level of environmental quality or environmental preser-vation. The existence of this additional source of irreversibility (indirect irreversibility) will imply the need for even greater caution.
8See, for example, Krutilla and Fisher (1975) and Arrow and Fisher (1974).
6. Conclusions
The typical approach to defining the optimal level of pollution has been to equate the marginal damages of an additional unit of pollution with the marginal costs of reducing the pollution. Damages are typically measured as impacts to human health, recreational activity, materials and other physical impacts of pollution. Often at-tempts are made to measure existence values and other indirect use values (also called non-use and passive use) through contingent valuation and other techniques.
We argue that the damages from pollution (or the benefits from reducing pollution) should be much more broadly defined to include at least three other sources of benefits. First, we show that there may be obstacles associated with strategic behavior that reduce the incentives for firms to adopt cleaner cost-saving technology. A more stringent environmental policy would reduce the incentives that underlie this strategic behavior. Second, we demonstrate that the dynamic consid-eration of the effect of environmental strictness on technological innovation implies future benefits of stricter environmental policy today. Other dynam-ical factors (such as the intertemporal accumula-tion of ecological stresses) make the intertemporal consideration of pollution even more important. Finally, we show that ecological complexity cre-ates indirect pathways by which increasing the level of pollution increases damages by increasing the likelihood of crossing a threshold, generating irreversible environmental change.10
The implications of this paper are associated with the way we define our goals for environmen-tal quality. Our arguments suggest that if we have set our environmental goals based on a more traditional measure of damages then social wel-fare would be increased by establishing more am-bitious policy goals. Of course, our paper has not established the magnitude by which we should become more ambitious nor has it addressed the additional costs that would be incurred from stricter policy. These costs must be balanced against the benefits we have enumerated. Our paper has focused on outlining those conceptual arguments that call for more ambitious environ-mental policy. Measures of the size and relative importance of the components of a more broadly defined conceptualization of damages await the implementation of empirical research in these im-portant areas.
Acknowledgements
The authors would like to thank the reviewers for their comments and suggestions. Any errors remain the responsibility of the authors.
References
Arrow, K., Fisher, A., 1974. Environmental preservation, un-certainty, and irreversibility. Q. J. Econ. 88, 312 – 319. Barbier, E., 1998. The Economics of Environment and
Devel-opment: Selected Essays. Edward Elgar, London, UK. Benford, F., 1998. On the dynamics of the regulation of
pollution: incentive compatible regulation of a persistent pollutant. J. Environ. Econ. Manage. 36, 1 – 25.
Bjornstad, D., Kahn, J., 1996. The Contingent Valuation of Environmental Resources: Methodological Issues and Re-search Needs. Edward Elgar, London, UK.
Brito, D., Intriligator, M., 1987. Stock externalities, Pigovian taxation and dynamic stability. J. Pub. Econ. 33, 59 – 72. Costanza, R., d’Arge, R., De Groot, R., Farber, S., Grasso,
M., Hannon, B., Limburg, K., Naeem, S., O’Neill, R., Paruelo, J., Raskin, R., Sutton, P., van den Belt, M., 1997. The value of the world’s ecosystem services and natural capital. Nature 387, 253 – 260.
Franceschi, D., Kahn, J., 1999a. The economic implications for sustainable mining within the paradigm of sustainable development. Analise Economica. 17 (31), 141 – 154. 10A fourth important factor lies in the potential existence of
Franceschi, D. and Kahn, J., 1999b. Capital accumulation and sustainable development: the role of capital, mineral resources and environmental resources in the sustainable development of the Brazilian Amazon. Department of Economics, University of Tennessee, Knoxville (unpubl.). Freeman, A., III, 1993. The measurement of environmental
and resource values: theory and methods. Resources for the Future, Washington, DC.
Georgiou, S., Pearce, D., Whittington, D., Moran, D., 1997. Economic Values and the Environment in the Develop-ing World. Edward Elgar, London, UK.
Hartwick, J., 1977. Intergenerational equity and the invest-ing of rents from exhaustible resources. Am. Econ. Rev. 67, 972 – 974.
Kahn, J., Farmer, A., 1999. The double dividend, second-best worlds, and real-world environmental policy. Eco-logical Economics 30, 433 – 439.
Kahn, J., O’Neill, R., 1999. Ecological interaction as a source of economic irreversibility. S. Econ. J. 66, 391 – 402.
Ko, II-Dong, Lapan, H., Sandler, T., 1992. Controlling stock externalities, flexible versus inflexible Pigovian cor-rections. Eur. Econ. Rev. 36, 1263 – 1276.
Krutilla, J., Fisher, A., 1975. The Economics of Natural Resources: Studies in the Valuation of Commodity and
Amenity Resources. Johns Hopkins University Press, Baltimore.
Oates, W., Palmer, K. and Portney, P., 1993. Environmental regulation and competitiveness: thinking about the Porter hypothesis. Discussion Paper 94-02. Resources for the Future, Washington, DC.
O’Neill, R., 1999. Recovery in complex ecosystems. J. Aquat. Ecosyst. Stress Recov. 6, 181 – 187.
O’Neill, R., Johnson, A., King, A., 1989. A hierarchical framework for the analysis of scale. Landscape Ecol. 3, 193 – 205.
Palmer, K., Simpson, D., 1993. Environmental policy as in-dustrial policy. Resources 112, 17 – 21.
Porter, M., 1990. The Competitive Advantage of Nations. Free Press, New York.
Porter, M., 1991. America’s green strategy, Scientific Ameri-can, April, 168.
Rosser, J., 1991. From Catastrophe to Chaos: a General Theory of Economic Discontinuities. Kluwer Academic, Dordrecht/Boston.
Simpson, D., 1993. Taxing variable cost: environmental reg-ulation as industrial policy. Discussion Paper ENR 93 – 12. Resources for the Future, Washington, DC.
World Bank, 1992. World Development Report 1992: Devel-opment and the Environment. Oxford University Press: Oxford/New York.