Gas-exchange response and stomatal and non-stomatal
limitations to carbon assimilation of sunflower under
salinity
P. Steduto
a,*, R. Albrizio
a, P. Giorio
b, G. Sorrentino
baCIHEAM-IAMB,6ia Ceglie9,70010Valenzano,Bari,Italy bC.N.R.-ISPAIM,6ia Cupa Patacca85,80056Ercolano,Napoli,Italy
Received 28 April 2000; received in revised form 27 July 2000; accepted 27 July 2000
Abstract
Sunflower (Helianthus annuus) was grown in both open-field and outdoor potted conditions in Southern Italy, and irrigated with water having electrical conductivity ranging between 0.9 and 15.6 dS m−1obtained by different NaCl concentrations. The aim of the work was to study the leaf area and photosynthetic responses of sunflower to mild salt stress. The response curve (A/ci) of assimilation (A) to leaf internal CO2concentration (ci) was used to determine leaf gas-exchange parameters, in order to evaluate stomatal and non-stomatal limitations to photosynthesis in relation to salt stress. In the field, a reduction of 19% in leaf area expansion occurred, while no correlation was observed between
Cland stomatal conductance to water vapour (gsw) ranging between 0.76 and 1.35 mol m−2s−1. This result was also evident at a higher salinity level reached in the pot experiment where leaf osmotic potential (cs) varied from −1.35 to−2.67 MPa as compared with the field experiment, wherecsranged from−1.15 to−1.42 MPa. Considering the two experiments as a unique data set, the assimilation rate, the stomatal conductance to CO2(gsc) and the sensitivity ofAtocivariation (g*) were not significantly influenced by salinity in the whole range ofcs. As a consequence, the stomatal and non-stomatal limitations to photosynthesis were not affected by salt treatment, averaging around 20 and 80%, respectively. The variation inA(from 44 to 29mmol m−2s−1) was paralleled by the variation ingsc(from 0.47 to 0.84 mol m−2s−1), with a remarkable constancy of bothc
i(200912.5mmol mol−1) and normalized water-use efficiency (590.7mmol mmol−1kPa), showing the optimal behaviour of the plant processes. These findings indicate
that, under mild salt stress, the same as observed under water deficit, sunflower controls assimilation mainly by modulating leaf area rather than by stomatal closure, and that non-stomatal limitation of photosynthesis was not affected at all by the level of salinity reached in this study. © 2000 Elsevier Science B.V. All rights reserved.
Keywords:Leaf water potential; LAI; Photosynthesis;Helianthus annuus
www.elsevier.com/locate/envexpbot
1. Introduction
Most of the studies reported in the litera-ture concerning sunflower response to saline
* Corresponding author. Tel.:+39-80-4606224; fax: + 39-80-4606201.
E-mail address:[email protected] (P. Steduto).
P.Steduto et al./En6ironmental and Experimental Botany44 (2000) 243 – 255
244
conditions refer to the classical approach of Maas and Hoffman (1977), relating final yield to salinity of the soil water extract (for example, Francois, 1996). The works that explained the causes of reduced growth and yield through investigations on leaf area expansion and gas-exchange refer to water stress, but not to salt stress under field conditions. Rawson and Munns (1984) showed the high sensitivity of leaf growth to salinity con-ditions for potted sunflower plants. They observed a leaf area reduction of about 50% with 5 dS m−1 electrical conductivity in the nutrient solution. Giorio et al. (1996) also noticed the high sensitiv-ity of leaf area expansion to salinsensitiv-ity in open field experiments, in response to small reductions in total leaf water potential. Such ‘phenotypic plas-ticity’ in modulating leaf area in response to small reductions in leaf water potential represents one of the most relevant adaptive properties of sunflower (Connor and Sadras, 1992).
In addition to leaf area expansion (the ‘sink-size’ for carbon assimilation), productivity de-pends also on the carboxylation capacity per unit leaf area (the ‘sink-intensity’ for carbon assimila-tion), compounded by stomatal and non-stomatal contributions to photosynthesis. Most of the stud-ies on stomatal and non-stomatal components in sunflower refer to water stress conditions but report conflicting results (Lawlor, 1995). While some authors underline stomatal limitation as the main cause of carbon assimilation reduction (Plesnicar et al., 1995), others attribute the de-crease in photosynthetic rate to non-stomatal lim-itation (Gimenez et al., 1992; Tezara and Lawlor, 1995).
Under salinity conditions, the majority of the works dealing with stomatal and non-stomatal limitation to photosynthesis concern various crops but sunflower. In bean, a salt-sensitive spe-cies, the reduction in assimilation was found to be mostly due to stomatal limitation (Brugnoli and Lauteri, 1991), and to both stomatal and non-stomatal limitations (Seemann and Critchley, 1985). Among other salt-sensitive species, Bethke and Drew (1992) on pepper and Chartzoulakis et al. (1995) on kiwi ascribed the observed reduction in photosynthesis to non-stomatal limitation. These conflicting results are also found for more
salt-tolerant species. For instance, Brugnoli and Lauteri (1991) indicated that stomata played the major role in limiting photosynthesis of cotton, whereas Dunn and Neales (1993) suggested that non-stomatal components limited the photosyn-thesis of barley. All these works were conducted in a controlled environment with a variable range of boundary conditions and thus resulting in a low degree of comparability. Moreover, no infer-ences could be drawn for open-field conditions, where the degree of stress development, intensity and duration is such that plants can activate adaptation mechanisms for adjusting to the changing environment (Lawlor, 1995).
Concerning sunflower grown in the field, no information is available on the stomatal and non-stomatal limiting components of photosynthesis under salinity, with few studies confined to inves-tigation on stomatal response. Katerji et al. (1994) showed a decrease in stomatal conductance with increasing salt concentration of irrigation water of potted sunflower plants, while Giorio et al. (1996) found no response of stomatal conductance with salinity of plants grown in the field.
From that already reported, our hypothesis is that if leaf area modulation remains the most important stress avoidance mechanism under salinity and if stomatal closure is of less signifi-cance, non-stomatal limitations to photosynthesis should be the least or not at all induced by salinity. This hypothesis would be consistent with the optimization theory of plant processes (Cowan, 1982; Givnish, 1986).
Thus, in order to verify it, the present study investigated the effect of gradually developing salinity stress on leaf expansion, leaf gas-exchange parameters, and stomatal and non-stomatal limi-tations to carbon assimilation.
2. Materials and methods
2.1. The field experiment
The field trial took place in 1996 at the experi-mental farm of C.N.R.-ISPAIM located in Vitu-lazio (Caserta), Southern Italy (40°07% N, 14°50%
E, 25 m above sea level), having a typical Med-iterranean climate. The soil is an alluvial mont-morillonite clay loam type, defined as Mollic Haplaquept according to the USDA soil classifi-cation, with physical and chemical characteristics through the upper 1.2 m depth as reported in Table 1.
Sunflower (Helianthus annuus), hybrid Turbo-sol, was sown on 14 June 1996, in rows 0.75 m apart in three nearby 24×15 m2 plots, with final plant density of 5 plants m−2. The crop received a presowing fertilization, with 96 kg ha−1 ureic nitrogen and 95 kg ha−1 P
2O5, and was grown under healthy conditions. Furrow irrigation started at 36 days after planting (DAP) when plants had eight fully expanded leaves, and was scheduled according to the soil water balance method applied over 1.35 m depth. The control treatment (I0) was irrigated with fresh water of 0.9 dS m−1
electrical conductivity (ECw, dS m− 1
) and the salt treatments, I1 and I2, with saline solutions having ECw equal to 7.8 and 15.6 dS m−1, respectively, obtained by adding commercial sea-salt (NaCl) to irrigation water. Soil salinity was monitored measuring the electrical conductiv-ity in 1:2.5 soil extract, in the 0 – 0.6 m soil layer, and at different stages of the crop cycle, by a laboratory conductimeter (model Micro CM 2201; Crison Instruments SA, Barcelona, Spain). An empirical factor of 3.7 was used to calculate the equivalent saturation extract (ECe, dS m−1).
2.2. The pot experiment
The trial took place in 1997 at the experimental field of the Mediterranean Agronomic Institute, located in Valenzano (Bari), Southern Italy (41°03% N, 16°52% E, 72 m above sea level), about
200 km from the field experimental site of Vitulazio.
The same hybrid (Turbosol) as in the previous experiment was sown on 12 May 1997 in pots of 35 dm3, filled with coarse river sand and
clay-loam soil in a 3:1 ratio on weight basis, mixed with 200 g per pot of a ternary fertilizer (30/30/
30). The resulting pH of the saturated extract was 7.6 and the soil cation exchange capacity (CEC) was 5597 mmol kg−1.
Five treatments with five pots per treatment (one plant per pot) were established by adding, like in the field trial, different amounts of com-mercial sea-salt (NaCl) to the irrigation water. During the season, the control treatment (I0) was irrigated with fresh water (ECw=0.9 dS m−1) and the salt treatments I1, I2, I3, and I4 with a saline solution having ECw of 3.9, 7.8, 11.7 and 15.6 dS m−1, respectively.
Irrigation started at 37 DAP, when the plants had eight fully expanded leaves, and continued during the whole life cycle applying one to two waterings per day, allowing abundant leaching in order to maintain a stable salt content in the root zone. Electrical conductivity was measured on the drainage water using the same type of conduc-timeter used for the field experiment. In the same irrigation water, a nutrient solution was added to keep the plants in healthy and vigorous conditions.
2.3. Leaf area de6elopment and water status
In the field experiment, green leaf area (LA, cm2) was determined along the crop cycle by non-destructive measurements of the leaf lamina length (Le, cm) and maximal width (Wi, cm), using an empirical equation (Giorio et al., 1996). Measurements of Le and Wi were taken on all leaves of five plants per plot (randomly selected) and repeated for the same plants every five days. In the pot experiment, measurements were carried out only at the flowering stage on the third leaf from the top (for all plants) to have an adequate magnitude of the surface area of the leaves em-ployed for gas-exchange determinations.
P
.
Steduto
et
al
.
/
En
6
ironmental
and
Experimental
Botany
44
(2000)
243
–
255
246
Table 1
Soil physical and chemical characteristics of the experimental site
Field capacity Wilting point Bulk density pH CEC Total CaCO3
Texture Organic matter Total nitrogen
(%) (%) (t m−3) (mmol kg−1) (%) (%) (‰)
Osmotic potential (cs, MPa) determinations were carried out for both the field and pot experiments on the same leaves where gas-exchanges had been measured. Ten leaf diskettes of 2 cm2 each were frozen in liquid nitrogen and squeezed at fixed pressure to extract the cellular sap. The osmolality of the sap was measured using a micro-osmometer (13/13 DR-Autocal-Hermann; Roebling Messtechnik, Berlin, Germany) and was then converted into osmotic potential using Morse’s equation (Morse, 1914).
2.4. Leaf gas-exchange measurements
Gas-exchange parameters and the assimilation (A, mmol m−2 s−1) versus substomatal CO2 con-centration (ci,mmol mol
−1) response curve (A/c i) of leaves were measured in both field and pot experiments, with two portable photosynthesis open systems (model Li-6400; LiCor Inc., Lin-coln, Nebraska, USA).
The A/ci response curve was generated after setting, inside the leaf chamber, the vapour pres-sure deficit (VPD, kPa) and leaf temperature con-stant at about the same values as those measured in the surrounding atmosphere of the leaf. Light intensity at 2000 mmolphoton m
−2 s−1 was
pro-vided by a red light diode source emitting at 670 nm. An external CO2 tank provided different CO2 concentrations in the range 0 – 2000 mmol mol−1.
TheA/ci measurements started at CO2 concen-tration of 2000mmol mol−1 and continued down
to 40 mmol mol−1 in a step-wise fashion with
shorter and shorter intervals (200, 150, 100 and 50). At each step, gas exchange variables were recorded after 15 – 20 min to achieve steady-state conditions, and about 2 h were needed to obtain each A/ci curve. Calculations of gas-exchange parameters were performed according to von Caemmerer and Farquhar (1981). Water use effi-ciency (WUEN, mmol mmol
−1 kPa), normalized
for VPD, was derived as the ratio of assimilation rate to transpiration rate.A/cicurves were taken around noon (from 11:00 to 15:30), on exposed uppermost leaves (usually the third from the top) over a clipped leaf surface of 6.0 cm2.
In the field experiment, measurements started at 46 DAP, when plants had ten fully expanded leaves, and continued every 4 – 5 days until 76 DAP. In the pot experiment, A/ci curves were all taken at the flowering stage (80 DAP), after exposure to salinity treatments from 37 DAP.
2.5. Stomatal and non-stomatal limitation estimates
In the present work, the analysis of the A/ci curve follows the model of Farquhar and Sharkey (1982). The data of eachA/cicurve were interpolated by linear regression to fit a non-rectangular hyperbola equation (Jones, 1983).
The fitted equationA=f(ci) was used to derive the carboxylation efficiency (a0, mol m
−2 s−1),
the maximum photosynthetic rate at saturated light and CO2 (Amax, mmol m− and g* parameters were calculated from the first derivative of the equation (A/(ci at ci=0 and
ci=operational, respectively. The Rl and Amax parameters were obtained from A=f(ci) when
ci=0 andci=, respectively. The CO2 compen-sation point was derived as the value of ci when
A=0.
The relative contributions of stomatal (ls,%) and non-stomatal (lm,%) limitations to photosyn-thesis were calculated according to the differential method (Jones, 1985) as tance for CO2, corresponding to the reciprocal of the slope of the line joining the point where ci equals ambient CO2 concentration to the assimi-lation value at operational ci.
P.Steduto et al./En6ironmental and Experimental Botany44 (2000) 243 – 255
248
3. Results
3.1. Field experiment
During the experiment, the atmospheric evapo-rative demand (ET0) was appreciably higher than the 30-year mean, with a maximum value of 7.5 mm and maximum air temperature of 30°C recorded during the month of July. The watering sequence was of 44, 44 and 37 mm (as irrigation) at 33, 46 and 53 DAP, respectively, and of 24, 33 and 22 mm (as rainfall) at 48, 60 and 70 DAP, respectively.
ECe values of the two salinity treatments, at any DAP, were significantly different (P50.05) from the control, but not from each other, al-though I2shows consistently higher values than I1 (Table 2). After the last irrigation (53 DAP), salinity increased with the advance of the season, reaching the maximum values of 0.6 dS m−1in I
0, 3.1 dS m−1in I
1and 3.6 dS m−1in I2at 69 DAP. Despite the high electrical conductivity of the irrigation water, the resultingECewas damped by the notable buffering capacity of the soil, in con-junction with the dilution effect of rainfall.
The relatively mild salinity regimes of I1 and I2 treatments corresponded to a slight reduction in leaf water potentials (Cl), measured along the season (data not shown), as compared with the control (I0). The values ofClin I0ranged between
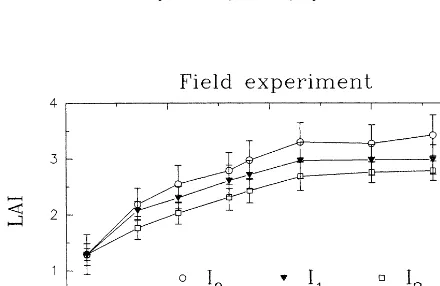
−0.85 and −1.3 MPa. Cl values of I1 and I2 were −0.1 and −0.3 MPa significantly lower than I0, respectively, on the average. Most likely, the slight reduction in Cl was sufficient to deter-mine an appreciable reduction in leaf area index (LAI) as illustrated in Fig. 1.
The maximum LAI differentiation between treatments was achieved at 52 DAP when leaf area expansion was 10 and 19% significantly lower than I0 for I1 and I2, respectively. There-after, this difference remained about constant un-til the end of anthesis (69 DAP) when I0 reached the maximum LAI value of 3.4. Contrary to LAI reduction, the variation in Cl of all treatments (from −0.85 to−1.67 MPa) did not affect stom-atal conductance for water vapour (gsw, mol m−2 s−1), as shown in Fig. 2, which remained at very high values, ranging between 0.76 and 1.35 mol m−2 s−1. Fig. 2 clearly shows decreasing C
l values going from I0 to I2. Furthermore, the se-quence ofCl(from higher to lower values) within each treatment evolves with the season.
Six A/ci curves per treatment were determined to derive the non-stomatal photosynthetic parameters. Two A/ci curves per treatment are illustrated in Fig. 3, to show the largest difference observed within each treatment. The variability in trends between curves is not related to salinity variation. This observation is confirmed by the analysis performed on carboxylation efficiency (a0), maximum photosynthetic rate (Amax), CO2
Table 2
Mean values and standard deviations of ECe for the three
salinity treatments I0, I1, and I2during the season*
DAP ECe(dS m−1)
* Significant differences between treatments, at each DAP, were evaluated byt-test (P50.05,n=3) and are indicated by lower-case letters. The same letters denote a non-significant difference. To obtain salt concentrations (mg l−1), multiply the
electrical conductivity values (dS m−1) by 640.
Fig. 2. Stomatal conductance to water vapour (gsw) in relation to leaf water potential (Cl) of sunflower, for all salinity treatments
during the field experiment. Slope of regression line non-significantly different from zero.
Fig. 3.A/ciresponse curves of sunflower measured in the field experiment. Two curves are reported for each treatment, representing
the largest difference observed.
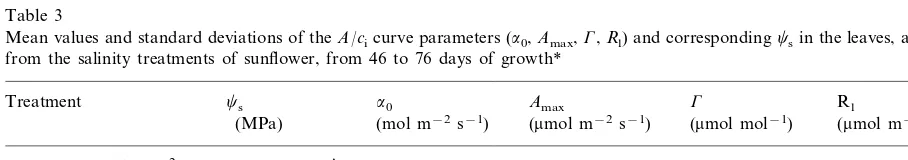
Table 3
Mean values and standard deviations of theA/cicurve parameters (a0,Amax,G,Rl) and correspondingcsin the leaves, as obtained
from the salinity treatments of sunflower, from 46 to 76 days of growth*
Rl
Amax G
a0
Treatment cs
(mmol m−2s−1) (mmol mol−1)
(MPa) (mol m−2s−1) (mmol m−2s−1)
50.594.41a
80.4910.69a 16.091.71a
0.3390.04a
I0(ECW=0.9 dS m−2) −1.1590.06A
49.994.82a 15.393.13a
I1(ECW=7.8 dS m−2) −1.3590.09Bb 0.3290.07a 74.3913.44a
47.594.60a 15.292.49a
I2(ECW=15.6 dS m−2) −1.4290.16Bb 0.3390.04a 79.6910.43a
78.1911.24 49.394.53
Overall −1.2990.14 0.3390.05 15.592.39
P.Steduto et al./En6ironmental and Experimental Botany44 (2000) 243 – 255
250
compensation point (G) and light respiration (Rl) parameters, reported in Table 3, along with leaf osmotic potential (cs).
Leaf osmotic potential measured on the same leaves of the A/ci curves, expresses a relative measure of within-leaf salinity status induced by I1 and I2treatments, in comparison with the con-trol I0. The mean cs values of treatments I1 and I2 were −0.20 and −0.27 MPa lower than that of I0 (−1.15 MPa), respectively. The means dif-ference of the two salinity treatments was highly significant with respect to I0 (P50.01), but not between each other. The limited reduction in cs for I1and I2 compared with I0 reflected the mod-erate salinity difference observed in the soil (Table 2), and thus the non-significant differences in photosynthetic parameters between treatments are not surprising.
3.2. Pot experiment
Weather conditions during the pot experiment were relatively warmer than in the field experi-ment, with ET0 and air temperature reaching maximum values of 8 mm and 40°C, respectively, during the month of July.
Having purposely chosen a coarse-textured soil, the electrical conductivity of drainage water
(ECdw) was of the same values as irrigation water (ECw).
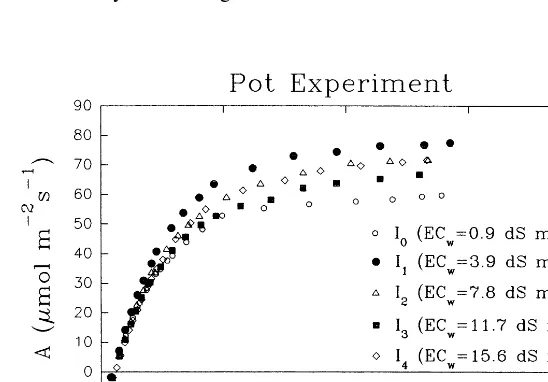
FiveA/cicurves were determined (one for each salinity level) to derive the photosynthetic parameters (Fig. 4). Also, in this case, the ob-served variability between curves is not related to variation in salinity. Measurements of leaf area (LA) and cs were obtained from the same leaves of the A/ci determinations. The results of a0,
Amax, G, andRl, along with the corresponding cs and LA, are reported in Table 4.
It is worth noticing that, in this case, the re-duction of cs from −1.35 to −2.67 MPa reflected adequately the increased salt concentra-tion in the irrigaconcentra-tion water. Nevertheless, the highest salinity level (I4), with ECw almost 15 times greater than the control (I0), corresponded only to a twofold decrease in cs. The achieved level of cs in the leaves of the pot experiment, however, is high as compared with the field ex-periment (statistically different at P50.05). The leaf area, in fact, reduced progressively by 16% for I1, 23% for I2 and I3, and 60% for I4 treat-ment, as compared with the control, while in the field experiment, the maximum LA reduction was only 19%. Conversely, the mean values of all the photosynthetic parameters did not significantly differ from those of the field experiment.
Table 4
Mean values and standard deviations of theA/cicurve parameters (a0,Amax,G,Rl), leaf area (LA), and correspondingcsin the
leaves, from each salinity treatment
Treatment cs a0 Amax G Rl LA
(mol m−2s−1) (
mmol m−2s−1) (mmol mol−1)
(MPa) (mmol m−2s−1) (cm2)
−1.35
I0(ECw=0.9 dS m−1) 0.28 63.7 48.8 13.1 94.0
0.32 80.2 52.1
−2.05 15.7
I1(ECw=3.9 dS m−1) 79.4
0.31 84.0 46.2
I2(ECw=7.8 dS m−1) −2.15 13.9 72.6
0.33 73.7 53.3
−2.23 16.0
I3(ECw=11.7 dS m−1) 72.0
0.29 79.0 56.2 15.6 38.1
I4(ECw=15.6 dS m−1) −2.67
0.31 76.1 51.3
−2.09 14.9
Mean 71.2
S.D. 0.48 0.02 7.86 3.90 1.29 20.52
3.3.Photosynthetic response and limitations for the whole data set
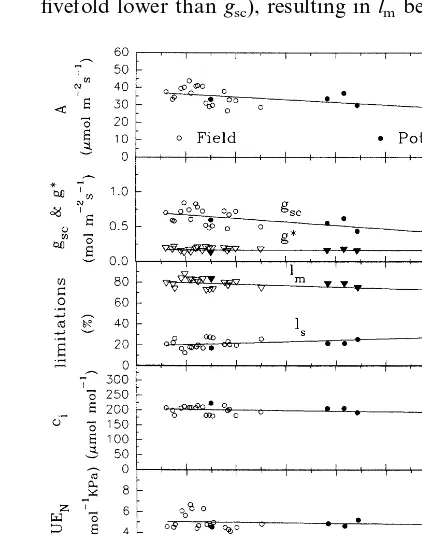
The assimilation response and the parameters of the limiting components in relation to osmotic potential are reported in Fig. 5, combining the results of both field and pot experiments. Maxi-mum values of net assimilation rates (Fig. 5a) ranging around 40 – 44 mmol m−2 s−1 were
ob-tained at high values of cs (around −1.2 MPa) reached in the field. AlthoughAtends to decrease with decreasing cs, the regression slope is not significantly different from zero. In fact, minimum
Avalues (about 29 mmol m−2 s−1) are obtained
both at relatively high (−1.6 MPa) and low (−2.6 MPa)csvalues.
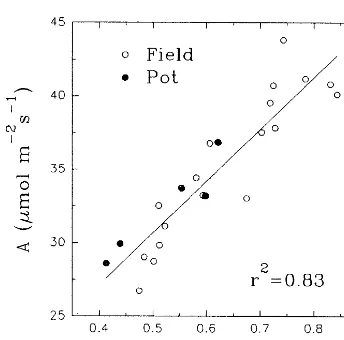
The regression of A versus cs is paralleled by the regression ofgscversuscs(Fig. 5b), because of the strict link between A and gsc as illustrated in Fig. 6. This linear relationship implies the con-stancy of ci (Fig. 5d) as well as of water-use efficiency (Fig. 5e) when normalized for VPD (Steduto, 1996). The ci values remained constant at about 200 mmol mol– 1 (S.D.=12.5) over the
whole cs range. The mean value of WUEN was constant mostly around 5 mmol mmol−1 kPa
(S.D.=0.7) over the wholecsrange and it is close to that found by other authors (Rawson and Constable, 1980; Lauteri et al., 1992). Regarding the role played by stomatal and non-stomatal components of photosynthesis, there is no varia-tion in g* with cs (Fig. 5b), which reflected the absence of variation in non-stomatal limitation
(lm) to assimilation (Fig. 5c). Values ofg*ranged between 0.12 and 0.20 mol m−2 s−1 (three- to fivefold lower thangsc), resulting inlmbetween 72
Fig. 5. Variation of (a) assimilation rate (A), (b) stomatal (gsc)
and non-stomatal (g*) conductances for CO
2, (c) stomatal (ls)
and non-stomatal (lm) limitations to photosynthesis, (d)
inter-nal CO2concentration (ci) and (e) normalized photosynthetic
water use efficiency (WUEN) of sunflower at ambient CO2
concentration, with variation in leaf osmotic potential (cs)
P.Steduto et al./En6ironmental and Experimental Botany44 (2000) 243 – 255
252
Fig. 6. Relationship between assimilation rate (A) and stom-atal coductance for CO2 (gsc) at ambient CO2 concentration
merging both field () and pot ( ) experiments with sunflower.
1999), which adjusts its canopy size to water availability, while maintaining adequate cellular turgour pressure (Turner et al., 1978; Gollan et al., 1986), which keeps stomata wide open. This behaviour seems to be related to the high elastic-ity of sunflower cell walls (Jones and Turner, 1980), representing one of the stress avoidance mechanisms (Connor and Sadras, 1992; Merrien, 1992) allowing one to cope with environmental stresses. The almost non-existent response of stomatal conductance to Cl (Fig. 2) resembles what has been reported by other authors for water stress experiments (for example, Rawson, 1979; Connor and Sadras, 1992; Plesnicar et al., 1995). The observed conductances are typical of sunflower (for example, Katerji et al., 1996; Pankovic et al., 1999), which exhibits some of the highest gsw values encountered in the literature for field crops (Ko¨rner et al., 1979) due to large stomatal size and density (Merrien, 1992).
The reduction in Cl down to −1.6 MPa (Fig. 2) did not induce any significant reduction in assimilation rate whose maximum values are typi-cal of sunflower under optimal water and nutri-tional status (Tezara and Lawlor, 1995; Connor and Hall, 1997). In contrast with these results, Lawlor (1995), in reviewing the effects of water deficit on photosynthesis, found that sunflower showed a 75% reduction in assimilation at the same Cl value. However, the findings of this author refer to severe water stress developed dur-ing a few days. Conversely, some authors (for example, Connor et al., 1985; Connor and Sadras, 1992) found low sensitivity of assimila-tion capacity to Clunder mild water stress in the field with a gradual increase in water deficit. All these facts highlight the relevance of the boundary conditions within which stress experi-ments are carried out.
The photosynthetic apparatus was not influ-enced by salinity, as also clearly shown by the absence of any effect on the A/ci curve parame-ters (Tables 3 and 4, and Figs. 3 and 4) and by the remarkably constant g* (Fig. 5b). While G
values are typical of C3 plants, a0 and Amax are consistent with the values found by other authors (for example, Jacob and Lawlor, 1991; Gimenez et al., 1992) and well above those of most C3 and 87%, as opposed tols values between 13 and
27%, with both limitations showing slight sloping regressions with cs not significantly different from zero.
4. Discussion
The present experiment covered a relatively moderate salt regime under field conditions (ECe up to 3.6 dS m−1), which is, however, of rele-vance for agriculture systems prone to salinity hazards (Shannon, 1997). Such salinity in the soil resulted in a decreased osmotic potential at leaf scale (from −1.15 down to −1.42 MPa), indi-cating a mild salt stress for the plant. The os-motic potential in leaves was then extended to
−2.67 MPa through the open-field pot experi-ment. The reduced impact of soil salinity on the leaf osmotic potential is most likely due to the property of sunflower to be a salt-excluder (Jeschke, 1983).
species (Connor and Sadras, 1992). Similarly, the light respiration (Rl) shows relatively high values. This resulted in a consequent lack of variation in non-stomatal limitations (Fig. 5c), whereas only a slight, but not significant, increase in stomatal limitation occurred (Fig. 5c).
Our results indicate the ability of sunflower to maintain high physiological activities when sub-jected to mild salt stress. In addition to the salt exclusion capacity of sunflower, the compartmen-tation of ions in its large vacuoles (Greenway and Munns, 1980) can explain the scarce salinity effect on the biochemistry of photosynthesis.
Our findings show that sunflower adjusts mor-phologically, rather than physiologically, to the salinity stress achieved in our experimental con-ditions, with the non-stomatal component to photosynthesis not influenced by salinity. This confirms our hypothesis since a reduction in the photosynthetic capacity, not associated with a corresponding reduction in stomatal conduc-tance, would imply a suboptimal use of resources (namely, water). Evidence, instead, for an opti-mal behaviour is given by the constancy in wa-ter-use efficiency (Fig. 5e) and ci (Fig. 5d) over the whole appreciable range of assimilation rate and stomatal conductance variations (Fig. 6), in-dicating the concerted action of stomatal and non-stomatal components (Cowan, 1982). Fur-thermore, all the variables reported in Fig. 5 were measured at different growth stages, mean-ing also different ages and nitrogen contents. In fact, over the cs range from −1.15 to −2.67 MPa, leaf nitrogen content varied from 3 to 6% (data not shown). Therefore, irrespective of the concurrent variation of other plant expressions, along with cs, the observed constancy in g*, ci, and WUEN reveals a strong ability of sunflower to optimize the available resources.
Objections to the A/ci curve, as a valuable approach to investigate stomatal and non stom-atal limitations to photosynthesis, can be raised because of the possible effects on ci calculations of: (i) the patchy stomatal closure under stress conditions, overestimating ci (Brugnoli and Lau-teri, 1991); and (ii) the reduction in CO2 liquid-phase conductance due to possible increase in
cell wall thickness (Syvertsen et al., 1995; Delfine et al., 1998), as may occur under salinity stress. Nevertheless, patchiness is generally not observed when water stress occurs gradually (Cheeseman, 1991; Gunasekera and Berkowitz, 1992; Hi-rasawa et al., 1995), while the adoption of the differential method to derive stomatal and non-stomatal limitations minimizes the effects of liq-uid-phase CO2 transport on the A/ci relationship (Jones, 1985).
In conclusion, the results of this work support the observation that, under salinity conditions, the control of assimilation in a sunflower crop is dominated by the modulation in leaf area (the sink-source size) rather than by the reduction in stomatal and non-stomatal components of pho-tosynthesis (the sink-source intensity). Specifi-cally, the non-stomatal limitation to photo-synthesis of sunflower was not affected at all by the level of salinity reached in the present experi-ments.
Acknowledgements
This work falls within the research line on salinity of C.N.R.-ISPAIM and the Master of Science Program of CIHEAM-IAMB. The au-thors thank Prof. Pasquale Tedeschi, Director of C.N.R.-ISPAIM, and Dr Cosimo Lacirignola, Director of CIHEAM-IAMB, for their institu-tional support. The authors are grateful to Fil-ippo Busiello (C.N.R.-ISPAIM), Carlo Ranieri and Rocco Laricchia (CIHEAM-IAMB) for their technical assistance during the experiments.
References
Bethke, P.C., Drew, M.C., 1992. Stomatal and non-stomatal components to inhibition of photosynthesis in leaves of Capsicum annuum during progressive exposure to NaCl salinity. Plant Physiol. 99, 219 – 226.
P.Steduto et al./En6ironmental and Experimental Botany44 (2000) 243 – 255
254
Chartzoulakis, K.S., Therios, I.N., Misopolinos, N.D., Noit-sakis, B.I., 1995. Growth, ion content and photosynthetic performance of salt-stressed kiwifruit plants. Irrig. Sci. 16, 23 – 28.
Cheeseman, J.M., 1991. Patchy: simulating and visualizing the effects of stomatal patchiness on photosynthetic CO2
ex-change studies. Plant Cell Environ. 14, 593 – 599. Connor, D.J., Fereres, E., 1999. A dynamic model of crop
growth and partitioning of biomass. Field Crops Res. 63, 139 – 157.
Connor, D.J., Hall, A.J., 1997. Sunflower physiology. In: Sunflower Technology and Production, Agronomy Mono-graph No. 35. American Society of Agronomy, Crop Sci-ence Society of America, Soil SciSci-ence Society of America, Madison, WI, pp. 113 – 182.
Connor, D.J., Sadras, V.O., 1992. Physiology of yield expres-sion in sunflower. Field Crops Res. 30, 333 – 389. Connor, D.J., Palta, J.A., Jones, T.R., 1985. Response
of sunflower to strategies of irrigation. III. Crop photo-synthesis and transpiration. Field Crops Res. 12, 281 – 293.
Cowan, I.R., 1982. Regulation of water use in relation to carbon gain in higher plants. In: Lange, O.L., Nobel, P.S., Osmond, C.B., Zigler, H. (Eds.), Physiological Plant Ecol-ogy II. Encyclopedia of Plant PhysiolEcol-ogy (NS), vol. 12B. Springer-Verlag, Berlin, pp. 589 – 613.
Delfine, S., Alvino, A., Zacchini, M., Loreto, F., 1998. Conse-quences of salt stress on conductance to CO2 diffusion,
Rubisco characteristics and anatomy of spinach leaves. Aust. J. Plant Physiol. 25, 395 – 402.
Dunn, G.M., Neales, T.F., 1993. Are the effects of salinity on growth and leaf gas exchange related? Photosynthetica 29, 33 – 42.
Farquhar, G.D., Sharkey, T.D., 1982. Stomatal conductance and photosynthesis. Annu. Rev. Plant Physiol. 33, 317 – 345.
Francois, L.E., 1996. Salinity effects on four sunflower hy-brids. Agron. J. 88, 215 – 219.
Gimenez, C., Mitchell, V.J., Lawlor, D.W., 1992. Regulation of photosynthetic rate of two sunflower hybrids under water stress. Plant Physiol. 98, 516 – 524.
Giorio, P., Sorrentino, G., Caserta, P., Tedeschi, P., 1996. Leaf area development of field-grown sunflower plants (Helianthus annuus L.) irrigated with saline water. Helia 24, 17 – 28.
Givnish, J., 1986, p. 717. On the Economy of Plant Form and Function. Cambridge University Press, New York. Gollan, T., Passioura, J.B., Munns, R., 1986. Soil water status
affects the stomata conductance of fully turgid wheat and sunflower leaves. Aust. J. Plant Physiol. 13, 459 – 464. Greenway, H., Munns, R., 1980. Mechanisms of salt tolerance
in nonhalophytes. Annu. Rev. Plant Physiol. 31, 149 – 190. Gunasekera, D., Berkowitz, G.A., 1992. Heterogenous stom-atal closure in response to leaf water deficits is not a universal phonomenon. Plant Physiol. 98, 660 – 665. Hirasawa, T., Wakabayashi, K., Touya, S., Ishihara, K.,
1995. Stomatal responses to water deficits and abscisic
acid in leaves of sunflower plants (Helianthus annuus L.) grown under different conditions. Plant Cell Physiol. 36, 955 – 964.
Jacob, J., Lawlor, D.W., 1991. Stomatal and mesophyll limi-tations of photosynthesis in phosphate-deficient sunflower, maize and wheat plants. J. Exp. Bot. 42, 1003 – 1011. Jeschke, W.D., 1983. Cation fluxes in excised and intact roots
in relation to specific and varietal differences. Plant Soil 72, 197 – 212.
Jones, H.G., 1983. Plants and Microclimate. Cambridge Uni-versity Press, New York, pp. 130 – 168.
Jones, H.G., 1985. Partitioning stomatal and non-stomatal limitations to photosynthesis. Plant Cell Environ. 8, 95 – 104.
Jones, M.M., Turner, N.C., 1980. Osmotic adjustment in expanding and fully expanded leaves of sunflower in re-sponse to water deficits. Aust. J. Plant Physiol. 7, 181 – 192.
Katerji, N., Van Hoorn, J.W., Hamdy, A., Karam, F., Mas-trorilli, M., 1994. Effect of salinity on emergence and on water stress and early seedling growth of sunflower and maize. Agric. Water Manage. 26, 81 – 91.
Katerji, N., Van Hoorn, J.W., Hamdy, A., Karam, F., Mas-trorilli, M., 1996. Effect of salinity on water stress, growth, and yield of maize and sunflower. Agric. Water Manage. 30, 237 – 249.
Ko¨rner, C., Scheel, J.A., Bauer, H., 1979. Maximum leaf diffusive conductance in vascular plants. Photosynthetica 13, 45 – 82.
Lauteri, M., Brugnoli, E., Spaccino, L., Guido, M.C., 1992. Long-term drought in sunflower: seasonal variations of water-use efficiency and carbon isotope discrimination. G. Bot. Ital. 127, 111 – 112.
Lawlor, D.W., 1995. The effects of water deficit on photosyn-thesis. In: Smirnoff, N. (Ed.), Environment and Plant Metabolism Flexibility and Acclimation. BIOS, Oxford, pp. 129 – 160.
Maas, E.V., Hoffman, G.J., 1977. Crop salt tolerance: current assessment. J. Irrig. Drain. Div. Am. Soc. Civ. Eng. 103, 115 – 134.
Merrien, A., 1992. Proceedings of the 13th International Sunflower Conference, 1, Pisa, 7 – 11 September 1992, pp. 481 – 498.
Morse, H.N., 1914. The osmotic pressure of aqueous solu-tions. Carnegie Institute, Washington, Publication number 198.
Pankovic, D., Sakac, Z., Kevresˇan, S., Plesnicar, M., 1999. Acclimation to long-term water deficit in the leaves of two sunflower hybrids: photosynthesis, electron transport and carbon metabolism. J. Exp. Bot. 50 (330), 127 – 138. Rawson, H.M., Constable, G.A., 1980. Carbon production of
sunflower cultivars in field and controlled environments. I. Photosynthesis and transpiration of leaves, stems and heads. Aust. J. Plant Physiol. 7, 555 – 573.
Seemann, J.R., Critchley, C., 1985. Effects of salt stress on the growth, ion content, stomatal behaviour and photosyn-thetic capacity of a salt-sensitive species,Phaseolus6ulgaris L. Planta 164, 151 – 162.
Shannon, M.C., 1997, pp.76 – 119. Adaptation of plants to salinity. In: Advances in Agronomy, vol. 60. Academic Press, San Diego, CA.
Steduto, P., 1996. Water use efficiency. In: Pereira, L.S., Feddes, R.A., Gilley, J.R., Lesaffre, B. (Eds.), Sustinability of Irrigated Agriculture. NATO ASI Series E: Applied Sciences. Kluwer Academic, Dordrecht, pp. 193 – 209. Syvertsen, J.P., Lloyd, J., McConchie, C., Kriedemann, P.E.,
Farquhar, G.D., 1995. On the relationship between leaf anatomy and CO2 diffusion through the mesophyll
of hypostomatous leaves. Plant Cell Environ. 18, 149 – 157.
Tezara, W., Lawlor, D.W., 1995. Effects of water stress on the biochemistry and physiology of photosynthesis in sunflower. In: Mathis, P. (Ed.), Photosynthesis: From Light to Biosphere, vol. IV. Kluwer Academic, The Hague, pp. 625 – 628.
Turner, N.C., Begg, J.E., Tonner, M.L., 1978. Osmotic adjust-ment of sorghum and sunflower crops in response to water deficits and its influence on the water potential at which stomata close. Aust. J. Plant Physiol. 5, 597 – 608. von Caemmerer, S., Farquhar, G.D., 1981. Some relationships
between the biochemistry of photosynthesis and the gas exchange of leaves. Planta 153, 376 – 387.