Estimating least-developed countries
’
vulnerability
to climate-related extreme events over the next
50 years
Anthony G. Patta,1, Mark Tadrossb, Patrick Nussbaumerc, Kwabena Asanted, Marc Metzgere,f, Jose Rafaelg, Anne Goujona,h, and Geoff Brundriti
aInternational Institute for Applied Systems Analysis, 2361 Laxenburg, Austria;bClimate Systems Analysis Group, University of Cape Town, Rondebosch 7701, South Africa;cInstitute of Environmental Science and Technology, Autonomous University of Barcelona, 08193 Bellaterra, Spain;dClimatus LLC, Mountain View, CA 94041;eCentre for the Study of Environmental Change and Sustainability, University of Edinburgh, EH8 9XP, Scotland;fAlterra, Wageningen University and Research Centre, 6700 AA Wageningen, The Netherlands;gDepartment of Geography, University of Eduardo Mondlane, Maputo, Mozambique;hVienna Institute of Demography, Austrian Academy of Sciences, 1040 Vienna, Austria; andiDepartment of Oceanography, University of Cape Town, Rondebosch 7701, South Africa
Edited by Stephen H. Schneider, Stanford University, Stanford, CA, and approved December 4, 2009 (received for review September 10, 2009) When will least developed countries be most vulnerable to climate
change, given the influence of projected socio-economic develop-ment? The question is important, not least because current levels of international assistance to support adaptation lag more than an order of magnitude below what analysts estimate to be needed, and scaling up support could take many years. In this paper, we examine this question using an empirically derived model of human losses to climate-related extreme events, as an indicator of vulner-ability and the need for adaptation assistance. We develop a set of 50-year scenarios for these losses in one country, Mozambique, using high-resolution climate projections, and then extend the results to a sample of 23 least-developed countries. Our approach takes into account both potential changes in countries’exposure to climatic extreme events, and socio-economic development trends that influence countries’own adaptive capacities. Our results sug-gest that the effects of socio-economic development trends may begin to offset rising climate exposure in the second quarter of the century, and that it is in the period between now and then that vulnerability will rise most quickly. This implies an urgency to the need for international assistance tofinance adaptation.
vulnerability
|
adaptive capacity|
development|
natural disasters|
natural hazardsS
everal international organizations, including the World Bank, the Organization for International Cooperation and Devel-opment, and the secretariat of the United Nations Framework Convention on Climate Change (UNFCCC), have assessed the costs of adapting to climate change in developing countries. Drawing from a wide range of sectoral and national case studies, their estimates ranging from $9 billion to more than $100 billion annually (1–3). The UNFCCC secretariat, for example, estimated annual adaptation expenditures by 2030 across six areas: agri-culture,fisheries, and forestry ($14 billion); water resources ($11 billion); human health ($4–5 billion); ecosystems ($12–22 billion); coastal zones ($11 billion); and infrastructure ($8–130 billion). Yet, although many industrialized countries have committed to providefinancial assistance to least developed countries (LDCs) for these costs, current bilateral and multilateral adaptation sup-port appears to be several orders of magnitude below assessed needs, and none of the various proposed mechanisms to scale up internationalfinancial assistance for adaptation appears likely to cover this gap within the coming years (4). Whether the slow pace of adaptation funding presents a major problem depends, in part, on how urgently such support is needed: Is the need immediate, or will it ramp up gradually over time?The need for adaptation assistance is predicated by a country’s vulnerability to climate change. Vulnerability, however, depends not only on exposure to climatic stressors, but also on a country’s
sensitivity to those stressors, which in turn is determined by a complex set of social, economic, and institutional factors col-lectively described as determining its adaptive capacity (5, 6). As the UNFCCC secretariat suggested in its needs assessment,“one of the key limitations in estimating the costs of adaptation is the uncertainty about adaptive capacity. Adaptive capacity is essen-tially the ability to adapt to stresses such as climate change. It does not predict what adaptations will happen, but gives an indication of differing capacities of societies to adapt on their ownto climate change or other stresses”(1, p. 97).
Human losses to extreme weather events can serve as a reliable indicator for this vulnerability, and with it the need forfinancial assistance, for two reasons. First, measures to reduce vulnerability to extreme weather events account for a particularly large share of estimated adaptationfinancial needs (1). Second, in the context of efforts to achieve a wide range of development goals, it is only within the last few years that development assistance funds have been used to help mitigate losses from extreme weather events (7), and so analysis based on these types of losses may generate a more accurate measure of autonomous adaptive capacity than that based on other climate change impacts.
Several recent empirical studies suggest that socio-economic indicators can be used to estimate adaptive capacity quantita-tively (8–10). Two studies have taken the approach of estimating future patterns of one particular climate impact, rates of malaria transmission, consistent with scenarios of climate change and human development; both of these have projected that the effects of increased wealth and literacy will become more important than those of climate change by the second half of the century, leading to declining numbers of malaria cases (11, 12). No study, however, has looked at vulnerability more generally, or at losses from extreme weather events as an indicator of vul-nerability, and how this will be affected by socio-economic development on the one hand and climate change on the other. This is the approach that we take here.
First, we estimate a statistical model of losses to climate-related extreme events, as a function of climate exposure and a set of socio-economic indicators, by conducting a cross-sectional analy-sis of national level disaster data. Next, we construct scenarios for
Author contributions: A.G.P. designed research; A.G.P., M.T., P.N., K.A., M.M., J.R., A.G., and G.B. performed research; A.G.P., M.T., P.N., K.A., A.G., and G.B. analyzed data; and A.G.P. wrote the paper.
The authors declare no conflict of interest.
This article is a PNAS Direct Submission.
Freely available online through the PNAS open access option. 1To whom correspondence should be addressed. E-mail: [email protected].
This article contains supporting information online atwww.pnas.org/cgi/content/full/ 0910253107/DCSupplemental.
SUSTAIN
ABILITY
SC
each of these variables through 2060, combining them according to the statistical model to estimate expected losses over that same period. Arguably the best possible estimate of changes in climate exposure requires the use of high-resolution climate scenarios that one can compare with historical data for both climate and extreme-event occurrence. For this reason we focus on a single country—Mozambique—which represents an LDC with high cli-mate exposure (13), and for which we had the necessary local data to engage in statistical downscaling. We then conduct a coarser analysis to generalize the qualitative results from the Mozambique case study to a wider sample of LDCs. Our results suggest that vulnerability, and likely with it the need for internationalfinancial assistance for adaptation, will rise faster in the next two decades than it will in the three decades thereafter.
Results
Thefirst stage of our analysis was to estimate statistical models of losses from climate-related disasters, based on a set of climatic and socio-economic variables that will likely change over time, which appear in Table 1. The dependent variables are logged values of the number of people per million of national pop-ulation killed or affected, respectively, by droughts, floods, or storms over the period 1990–2007. The variablenumber of dis-astersis the logged value of numbers reported by each country over the same period, and accounts for climate exposure; esti-mated coefficient values greater than 1 in both models indicate that average losses per disaster are higher in more disaster-prone countries. We expected that larger countries are likely to expe-rience disasters over a smaller proportion of their territory or population, and also benefit from potential economies of scale in their disaster management infrastructure, both resulting in lower average per capita losses; the negative coefficient estimates for the variable national population in both models are consistent with this expectation. The variableHDI represents the Human Development Index, a United Nations (UN) indicator comprised of per capita income, average education and literacy rates, and average life expectancy at birth. Recent studies of disaster losses —not limited to climate-related events—have shown that coun-tries with medium HDI values experience the highest average losses, whereas countries with high HDI values experience the lowest (14, 15). We therefore included the logged HDI values in quadratic form. Negative coefficient estimates for bothHDIand HDI2in both models are thus consistent with these expectations, given that logged HDI values are always negative, and the square of the logged values are in turn positive. Finally, we considered
several additional socio-economic variables not directly captured by HDI, and found only two that improved modelfit. For the model of the number of people killed, the positive coefficient estimate for female fertilityindicates that countries with higher birth rates experience greater average numbers of deaths. We do not take this to mean that there is a direct connection between fertility and natural hazard deaths, but rather that higher birth rates are associated with lower female empowerment, and lower female empowerment is associated with higher disaster vulner-ability, as has been shown previously (16, 17). For the model of the number of people affected, the negative coefficient estimate for the proportion urban population is consistent with urban residents being less likely to require postdisaster assistance than rural residents, also observed previously (18, 19). Both models yield an R2 statistic slightly greater than 0.5, indicating that variance in the independent variables explains just over half of the variance in the numbers killed and affected. This is consistent with results from past analyses based on similar data and methods (8–10).
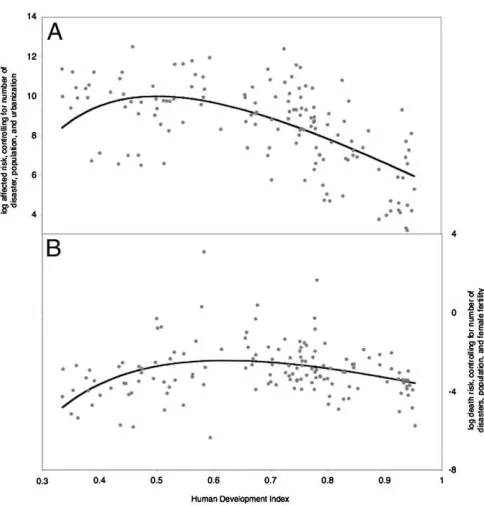
Of particular importance to rapidly developing countries is the observed nonlinear relationship between HDI and disaster los-ses. Fig. 1 illustrates the magnitude of this effect in both models, compared with the background variance, and taking into account the effects of the other variables. The estimated regression curve in Fig. 1Asuggests that the risk of being affected by a climate disaster is highest in countries with HDI values of∼0.5, whereas the curve in Fig. 1B suggests that the highest risk level is for countries with HDI values somewhat higher,∼0.6. This suggests that for countries with HDI values of less than 0.5, the transition to higher levels of development could potentially, in the absence of targeted intervention, exacerbate vulnerability.
Table 1. Ordinary least-squares regression results
Independent variables Killed Affected
Number of disasters 1.36* (0.15) 1.88* (0.19)
National population −0.56* (0.09) −0.79* (0.11)
HDI −5.97* (1.95) −13.55* (2.16)
HDI2
−6.26* (1.52) −9.82* (1.86)
Female fertility 1.45* (0.43)
Proportion urban population −0.41 (0.37)
Constant −3.86* (0.49) 5.33* (1.71)
Number of observations 150 154
R2 0.52 0.55
The dependent variable in the Killed model is the logged value of the number of people reported by CRED as killed by the three types of disasters considered (droughts, floods, and storms) divided by population. The dependent variable in theAffectedmodel is the same for the number of people reported affected, but not killed, by the same disasters. All independ-ent variables are logged values. Because HDI occupies the range of 0–1, all logged HDI values were negative, whereas the squares of these values were positive. *Values significant (two-tailed student’s ttest) at the 99% confi -dence level. Values in parentheses are SEs.
Fig. 1. Relationship between risk and HDI for (A) the number of people
affected, i.e., needing emergency or recovery assistance, by aflood, drought, or cyclone, per million of population, and (B) the number of people killed. Each dot represents a country in the CRED database during the period 1990–
The second stage in the analysis was to assemble scenarios for each of the variables appearing in Table 1, concentrating on Mozambique. Beginning with the socio-economic variables, we conformed as closely as possible to the storylines of the Inter-governmental Panel on Climate Change Special Report on Emis-sions Scenarios (SRES) A2 and B1 scenarios (20). The A2 storyline describes high population and economic growth but low global-ization, whereas the B1 storyline describes greater globalization tied to improvements in environmental quality and sustainability, as well as lower population growth. The most important socio-economic variable in our model is HDI. Fig. 2 shows the scenarios of HDI values for Mozambique, comparing them with past HDI values for neighboring countries in southern Africa. All three fac-tors of HDI—life expectancy, education, and income—drive the B1 scenario higher than the A2 scenario, and by 2030 the B1 sce-nario crosses into the region of decreasing risk levels seen in Fig. 1. The climatic driver in Table 1 is the frequency of droughts,
floods, and storms. For each hazard, we estimated a range of linear change to 2060 through a modeling analysis based on data derived from downscaled general circulation models (GCM), and a separate linear change based on the extrapolation of observed natural disaster rates from 1970–2007. Based on the GCM-derived data, we estimated the change in frequency from the baseline period of 1960–2000 to the period 2046–2065 to range from a 5% decrease to a 15% increase in the case of droughts, to range from a 10% decrease to a 25% increase in the case offloods, and to range from no change to a 25% increase in the case of storms. Based on a linear extrapolation of observed natural disaster frequency, we estimated an increase in the combined total of disasters from the 25 observed in the period 2000–2007 to 57 in the period 2050–2060.
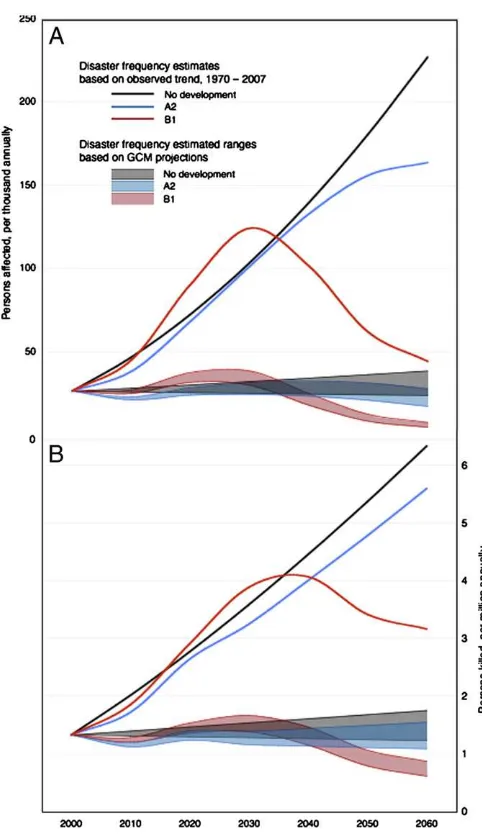
Combining the two statistical models shown in Table 1 with the socio-economic and climate scenarios yielded estimates of the expected number of people killed and affected by climate-related disasters in Mozambique. Because the lower end of the range of GCM disaster estimates corresponded to almost no change in frequency, this value roughly captures the effects of socio-economic development alone. To consider the effects of climate change alone, we also computed estimates assuming no development in population or socio-economic indicators. Fig. 3A shows the full set of alternative scenarios for the expected number of people affected by climate disasters, whereas Fig. 3B
shows the expected numbers killed. As the results are decadal averages centered on 10-year time steps, the base year from which all scenarios diverge is 2000.
In Fig. 3,A andB, the most noticeable gap lies between the scenarios based on GCM projections and those derived from the extrapolation of observed disaster frequency. Across both cli-mate exposure scenarios, however, there is a similar temporal pattern to losses for both expected numbers affected and killed. Losses rise fastest under both the A2 and B1 scenarios until 2030, after which point they decelerate, and indeed in the B1 scenario begin to fall. In the no-development scenario, by con-trast, they continue to accelerate upward.
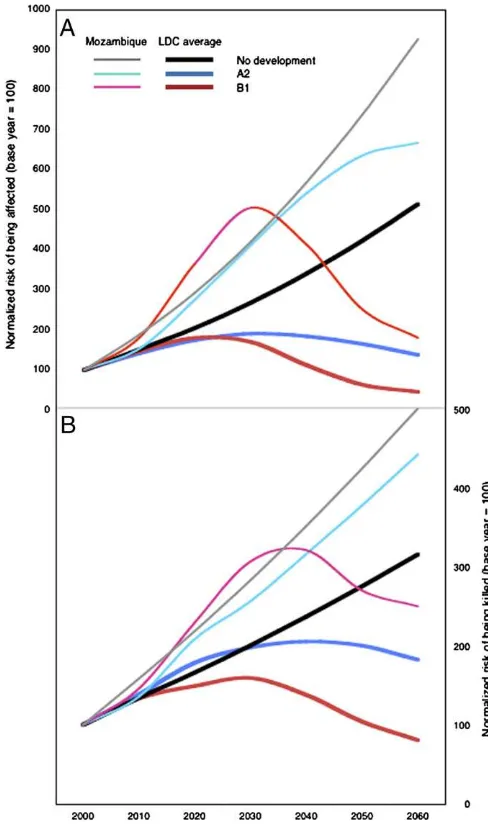
We then examined whether it is possible to generalize this qualitative pattern to other LDCs. We did not have access to sufficient data to downscale and to apply GCMs in the manner that we had done for Mozambique, and so we limited our climate projections to the linear extrapolation of observed disasters from 1970 to 2007. Fig. 4 shows the results for Mozambique, and for the average values of a sample of 23 LDCs, normalized to the values observed in each country over the period 2000–2007. As in the case of Mozambique, the full sample shows the qualitative
Fig. 2. Projected Human Development Index (HDI) levels for Mozambique
consistent with the IPCC A2 and B1 scenario storylines, compared with his-torical data for neighboring countries. The B1 scenario translates into higher values for each of the three component parts of HDI (life expectancy at birth, education and literacy, and per capita gross domestic product) compared with the A2 scenario.
Fig. 3. Mozambique risk scenarios to 2060. (A) Expected numbers of people
affected, i.e., needing emergency or recovery assistance, byfloods, droughts, and cyclones in Mozambique. (B) Expected number of people killed.
SUSTAIN
ABILITY
SC
pattern of losses under both the A2 and B1 scenarios rising fastest until 2030, and then rising less fast, or falling, thereafter.
Discussion
The results suggest that vulnerability may rise faster in the next two decades than in the three decades thereafter. Importantly, the overall need for adaptation measures will continue to rise, as the no-development scenarios shown in Figs. 3 and 4 indicate. How-ever, assuming that their development paths fall somewhere close to the range bounded by the A2 and B1 scenarios, by the second quarter of the century LDCs will likely engage in a greater share of this adaptation autonomously, thereby reducing both their losses, and their need forfinancial assistance. This is especially the case if socio-economic conditions change in a manner close to that described in the B1 scenario.
There are some important limitations to our methods, which deserve attention. First, we used a cross-sectional regression
model to make forward-looking estimates. This approach is not without precedent—Ricardian estimates of climate change impacts on agriculture have done the same (21), for example— and yet the practice ignores important complexities associated with systemic change (22). This worry is especially strong where there is not a well-accepted causal explanation for cross-sectional patterns that would also explain time series effects. The non-monotonic relationship between HDI and disaster losses—which appears to be a key driver of our results—is one for which a well-accepted causal explanation is indeed lacking (14, 15). Second, all of our climate exposure scenarios rely on an assumption of a linear increase in disaster frequencies over the next 50 years. Although we believe this to be a reasonable assumption for this time period, there may be important feedbacks in the climate system that could lead to rapidly increasing impacts not accounted for in current projections (23). Third, the uncertain-ties are large and difficult to estimate. It is likely that considering the magnitude of disasters, rather than just their frequency, would allow the statistical models to explain a greater share of the variance in risk levels, and yet limitations in global disaster data and uncertainties inherent in multiple GCM projections of the future made this impossible. Other uncertainties stem from using just one statistical downscaling methodology and ignoring of the effects of increased adaptation assistance on the pace of economic development. All of these limitations are more serious with respect to longer-term effects, and leave as most robust the conclusion that vulnerability is now rising quickly.
Looking beyond 2060 and the crossing of temperature thresholds such as 2 °C, it may well be that steadily rising climate impacts— such as sea level rise or the effects of cumulative changes on eco-systems—create problems that go well beyond the ability of any country, rich or poor, to adapt (24). Until that point, a primary argument for ramping up assistance slowly—namely, that adapta-tion needs can only increase as climate change continues—is incomplete, because it ignores the role that socio-economic development and the concurrent changes in adaptive capacity will have to play. Although there are important caveats to our results, they provide afirst estimate of how vulnerability will unfold over the next 50 years, if one assumes, as do all of the SRES scenarios, that incomes will continue to rise. They suggest that the urgency of efforts to reduce vulnerability, including the provision of interna-tionalfinancial assistance, is high.
Materials and Methods
To estimate the two statistical models of vulnerability, we relied on an online database of national level disaster losses from droughts,floods, and storms maintained by the Centre for the Research on the Epidemiology of Disasters (CRED) with support from the Office of United States Foreign Disaster Assistance. The CRED database provides national level estimates of economic losses, loss of life, and the numbers of persons affected (needing assistance during or after a disaster, but not killed) for every disaster recorded since 1970. Given concerns over the quality of the CRED data for losses before 1990 and for economic losses over all periods (10), we restricted our analysis to the number of people killed and affected since 1990. The CRED data also supplied us with the number of natural disasters occurring in each country. For the remaining independent variables, we relied on an online database maintained by the United Nations Development Program. We then used multi-variate regression analysis on logged data to estimate models of disaster losses that make use of independent variables for which theory offers a causal explanation, and for which scenario estimates are available or easily constructed. We describe the data and methods more completely inS1ofSI Text.
To construct scenarios of national population and the socio-economic variables, we relied on several sources. For national population and the urban share of that population, we relied on an updated version of the SRES demographic and economic growth estimates developed by the International Institute for Applied Systems Analysis (IIASA) and made available online (25). To generate female fertility scenarios, we relied on projections made by the United Nations Population Division and available online, using the high estimate for the A2 scenario and the low estimate for the B1 scenario, and extrapolating both to 2060. For HDI, we relied on life expectancy projections to 2050 made by the United Nations Population Division, again
extrapolat-Fig. 4. Comparison of Mozambique results with averages from a sample of
ing them to 2060. We combined these with IIASA A2 and B1 scenarios for gross domestic product, adjusted according to anticipated purchasing power parity based on established theory (26). For the educational and literacy component of HDI, we made original projections to 2060 based on estab-lished forecasting methods (27, 28). We provide a more complete description of the separate scenarios for each variable inS2ofSI Text.
To construct scenarios of the frequency of disasters, we developed a range of projections based on a downscaled analysis of GCMs, previous GCM-based analysis in the literature, and an extrapolation of observed trends. In general, GCMs indicate that Mozambique will be growing warmer, leading to increased soil dryness but in most regions also a high likelihood of increased rainfall (29). To examine the relative influence of the countervailing factors on both droughts andfloods, we used a suite of seven GCMs, forced with the SRES A2 emissions scenarios and local station data, to estimate past and future stat-istically downscaled (30) changes in rainfall and potential evapotranspiration. We did not conduct a separate analysis based on GCMs forced with the SRES B1 scenario, as the differences observed by 2060 appear slight. To estimate changing drought frequency, we calculate from these data the frequency with which a simple index of soil moisture (rainfall–potential evapotranspiration) falls below thresholds associated with drought conditions, over both the baseline (1960–2000) and future (2046–2065) periods. To estimate future
flood risks, we forced a statisticalflood frequency model (31) with the same seven sets of data, and then used a weighted average of the changed risk levels by river basin. To estimate the change in frequency of tropical cyclones, we did not engage in original modeling, but rather drew from a number of studies based on empirical observation and GCM experiments. Analyses using the HadCM3 (32) and ECHAM5 (33) models individually, and using an ensemble of models (34), have suggested that the southwest Indian Ocean is likely to experience an increase in the intensity of tropical cyclones, with changes in frequency relatively uncertain. Data limitations prevented us from estimating frequencies within the period considered, and so we assumed a linear trend between 2000 and 2060 for our projections.
Many consider the ability of GCMs to capture the change in frequency in extreme events to be highly problematic (35), and this led us to generate a second climate exposure scenario based on the observed frequency of natural hazards over the period 1970–2008. For the Mozambique estimates, we sup-plemented CRED data with additional records from the Mozambique National Institute for Disaster Management. The trend we estimated represents a much
greater increase in the frequency of disasters than the GCM-based analysis suggests, and for two reasons may be an upwardly biased estimate. First, disasters were likely to have been under-reported in the early years of the sample. Second, changing land-use patterns may have led to an increase in the number of climate hazards that caused sufficient damages so as to be counted as disasters. For the latter reason, some part of this trend may reflect not cli-mate change, but rather the very changes in socio-economic development already included elsewhere in the model. With these caveats in mind, the trend does represent an exploratory climate impact scenario that is more severe than the GCM analysis produced, yet not inconsistent with recent data. We provide more detail on our methods used, as well as spatially dis-aggregated results, for all climate scenarios inS3ofSI Text.
Forthemulticountry comparison,weexaminedall countries on thelist ofleast developed countries maintained by the United Nations Development Program. We restricted the sample to those that did not experience a major war during the period 1970–2007, and for which complete data were available on natural disasters during that period from the CRED database, and scenarios or projec-tions available for all variables from the IIASA and United Naprojec-tions databases. This restricted our sample to 23 countries. For each country, we projected the risks for being killed or affected by the three types of natural disasters, and then normalized these to the model estimates for the ten-year period centered on 2000. We describe the methods used in more detail, and provide scenario estimates for each country in theS4ofSI Text.
ACKNOWLEDGMENTS.This work results from a project coordinated by the
Mozambique National Institute for Disaster Management, withfinancial support from the Danish Agency for International Development Assistance, the German Agency for Technical Cooperation, and the United Nations Development Programme. Additional support for A.G.P. came from the Greenhouse Gas Initiative of the International Institute for Applied Systems Analysis. The downscaling code uses the CMIP3 dataset, and we acknowl-edge the modeling groups—the Program for Climate Model Diagnosis and Intercomparison (PCMDI) and the World Climate Research Programme’s Working Group on Coupled Modelling (WGCM)—for their roles in making available the WCRP CMIP3 multimodel dataset. Support for this dataset is provided by the Office of Science, US Department of Energy. We thank additional project team members, in particular Barbara van Logchem, for their useful insights and suggestions, as well as colleagues and two anony-mous reviewers who have commented on earlier versions of this manuscript.
1. UNFCCC (2007)Investment and Financial Flows to Address Climate Change(United Nations Framework Convention on Climate Change Secretariat, Bonn), pp 271. 2. World Bank (2006) Clean Energy and Development: Towards and Investment
Framework(World Bank, Washington, DC), pp 146.
3. Agrawala S, Fankhauser S (2008)Economic Aspects of Adaptation to Climate Change: Costs, Benefits and Policy Instruments(Organization for Economic Cooperation and Development, Paris).
4. Müller B (2008)International Adaptation Finance: The Need for an Innovative and Strategic Approach(Oxford Institute for Energy Studies, Oxford), pp 43.
5. Turner BL, et al. (2003) A framework for vulnerability analysis in sustainability science.
Proc Natl Acad Sci USA100:8074–8079.
6. Adger WN, et al. (2007)Climate Change 2007: Impacts, Adaptation and Vulnerability. Contribution of Working Group II to the Fourth Assessment Report of the Intergovernmental Panel on Climate Change, eds Parry ML, Canziani OF, Palutikof J, van der Linden P, Hanson C (Cambridge University Press, Cambridge), pp 717–743.
7. Linnerooth-Bayer J, Mechler R, Pflug G (2005) Refocusing disaster aid.Science309: 1044–1046.
8. Yohe G, Tol RSJ (2002) Indicators for social and economic coping capacity: Moving toward a working definition of adaptive capacity.Glob Environ Change12:25–40. 9. Brooks N, Adger WN, Kelly PM (2005) The determinants of vulnerability and adaptive
capacity at the national level and the implications for adaptation.Glob Environ Change15:151–163.
10. UNDP (2004)Reducing Disaster Risk: A Challenge for Development(United Nations Development Programme, Bureau for Crisis Prevention and Recovery, New York), pp 161. 11. Tol RSJ (2002) Estimates of the damage costs of climate change: Part II. Dynamic
estimates.Environ Resourc Econ21:135–160.
12. Tol RSJ, Ebi KL, Yohe G (2007) Infectious disease, development, and climate change: A scenario analysis.Environ Dev Econ12:687–706.
13. Thornton PK, et al. (2006)Mapping Climate Vulnerability and Poverty in Africa(United Kingdom Department for International Development, Nairobi, London), pp 171. 14. Kellenberg DK, Mobarak AM (2008) Does rising income increase or decrease damage
risk from natural disasters?J Urban Econ63:788–802.
15. de Haen H, Hemrich G (2007) The economics of natural disasters: Implications and challenges for food security.Agric Econ37:31–45.
16. Carr ER (2008) Between structure and agency: Livelihoods and adaptation in Ghana’s central region.Glob Environ Change18:689–699.
17. Patt AG, Dazé A, Suarez P (2009) Gender and climate change vulnerability: What’s the problem, what’s the solution?The Distributional Effects of Climate Change: Social and Economic Implications, eds Ruth M, Ibarrarán M (Edward Elgar, Cheltenham, UK), pp 82–102.
18. Vincent K (2007) Uncertainty in adaptive capacity and the importance of scale.Glob Environ Change17:12–24.
19. Wisner B, Blaikie P, Cannon T, Davis I (2004)At Risk: Natural Hazards, People's Vulnerability and Disasters(Routledge, New York).
20. Nakicenovic N, Swart R (2000)Special Report on Emission Scenarios(Intergovernmental Panel on Climate Change, Geneva), pp 570.
21. Mendelsohn R, Nordhaus W, Shaw D (1994) The impact of global warming on agriculture: A Ricardian analysis.Am Econ Rev84:753–771.
22. Schneider SH, Easterling WE, Mearns LO (2000) Adaptation: Sensitivity to natural variability, agent assumptions and dynamic climate changes.Clim Change45:203–221. 23. Allen MR, Frame DJ (2007) Call off the quest.Science318:582–583.
24. Parry ML, Canziani OF, Palutikof J, van der Linden P, Hanson C, eds (2007)Climate Change 2007: Impacts, Adaptation and Vulnerability. Contribution of Working Group II to the Fourth Assessment Report of the Intergovernmental Panel on Climate Change(Cambridge University Press, Cambridge), pp 976.
25. Riahi K, Grübler A, Nakicenovic N (2007) Scenarios of long-term socio-economic and environmental development under climate stabilization.Technol Forecast Soc Change
74:887–935.
26. Samuelson PA (1994) Facets of Balassa-Samuelson thirty years later.Rev Int Econ2:201–226. 27. Lutz W, Goujon A (2001) The world’s changing human capital stock: Multi-state
population projections by educational attainment.Popul Dev Rev27:323–339. 28. Lutz W, Goujon A (2005)Literacy Projections. Paper Commissioned for the EPFA
Global Monitoring Report 2006, Literacy for Life(UNESCO, Paris).
29. Boko M, et al. (2007)Climate Change 2007: Impacts, Adaptation and Vulnerability. Contribution of Working Group II to the Fourth Assessment Report of the Intergovernmental Panel on Climate Change, eds Parry ML, Canziani OF, Palutikof J, van der Linden P, Hanson C (Cambridge University Press, Cambridge, UK), pp 433–467. 30. Hewitson BC, Crane RG (2006) Consensus between GCM climate change projections with empirical downscaling: Precipitation downscaling over South Africa.Int J Climatol
26:1315–1337.
31. Asante K, Artan G, Pervez S, Rowland J (2008) A linear geospatial streamflow modeling system for data sparse environments.Int J River Basin Manage6:1–9. 32. McDonald R, Bleaken D, Cresswell D, Pope V, Senior C (2005) Tropical storms: Representation
and diagnosis in climate models and the impacts of climate change.Clim Dyn25:19–36. 33. Bengtsson L, et al. (2007) How may tropical cyclones change in a warmer climate?
Tellus A59:539–561.
34. Emanuel K, Sundararajan R, Williams J (2008) Hurricanes and global warming: Results from downscaling IPCC AR4 simulations.Bull Am Meteorol Soc89:347–367. 35. Easterling DR, et al. (2000) Climate extremes: Observations, modeling, and impacts.
Science289:2068–2074.
SUSTAIN
ABILITY
SC