Changes in fatty acid concentrations in tissues of African catfish,
Clarias gariepinus
Burchell, as a consequence of dietary carnitine,
fat and lysine supplementation
R. O. A. Ozo´rio*, J. L. A. Uktoseja, E. A. Huisman and J. A. J. Verreth
Fish Culture and Fisheries Group, Wageningen Institute of Animal Science (WIAS),Wageningen University, P.O. Box 338, 6700 AH Wageningen, The Netherlands
(Received 29 January 2001 – Revised 2 July 2001 – Accepted 16 July 2001)
A study was undertaken to examine the effect of different dietary carnitine (200 and 1000 mg/kg diet) and fat (90 and 190 g/kg diet) supplementation on growth and fatty acid concentrations of
fish fed either with a low- (13 g/kg) or a high-lysine (21 g/kg) diet. African catfish (22:7 g/fish),
Clarias gariepinus Burchell, juveniles were stocked (sixteen aquaria, twenty-five fish per aquarium) and fed for a maximum of 74 d. Dietary lysine had a clear effect on growth performance and feed conversion ratios, but dietary carnitine supplements had no effect.
High-carnitine supplements increased total High-carnitine content (P,0:0004) and reduced tissue free
carnitine: acyl-carnitine ratio (P,0:05) compared with low-carnitine supplements. High-fat
supplements decreased liver carnitine concentrations. Clear effects on liver fatty acid concentrations were observed in high-carnitine-fed fish compared with low-carnitine-fed fish.
The primary liver fatty acids affected were 18:2n-6 (linoleic acid), 20:5n-3 (eicosapentanoic
acid) and 22:6n-3 (docosahexanoic acid). The whole-body fatty acid balance suggested that
20:5n-3 disappeared (apparently byb-oxidation) more readily than 18:2n-6 and/or 22:6n-3.
From 774 mg 20:5n-3 eaten by high-lysine – high-fat – low-carnitine fish, 58 % was not
assimilated into body tissues. High-carnitine-fed fish showed an increase in 20:5n-3 oxidation
by 7 % compared with low-carnitine fish. Although dietary carnitine did not improve body growth, these results support the hypothesis that carnitine can enhance the mobilisation of long-chain fatty acids towards oxidation.
Carnitine: African catfish: Fatty acid balance: Lysine
Carnitine is synthesised in the liver from the amino acid lysine with methionine acting as a methyl donor (Broquist, 1997). It functions as a cofactor for the transport of fatty acids into the mitochondrial and thus facilitating the use of fatty acids for energy. Since total excretion rate of carnitine
in mammals can reach 10:4mmol/d (Brooks & McIntosh,
1975) and synthesis alone is not always sufficient (Cederblad & Lindstedt, 1976) fatty acid oxidation may become impaired if carnitine and/or its precursors are not supplemented in the diet. According to Van Kempen & Odle (1995) the capacity of fatty acid oxidation in neonatal pigs depends on dietary carnitine supplementation. Considering that carnitine supplements increase import of fatty acids into the mitochondria, it may be that carnitine can indirectly prevent protein from catabolism. Thus, animals fed diets with elevated carnitine and fat contents may have more
protein energy available for growth. Early work of Bilinski & Jonas (1970) indeed showed that free fatty acid oxidation by trout muscle mitochondria was highly activated by the addition of carnitine. In the past decade evidence was provided both to support and to reject this hypothesis. Rabie
& Szilagyi (1998) and Heoet al.(2000) also demonstrated
that in broilers and piglets weight gain and fatty acid
oxidation were improved by dietary carnitine. Groppet al.
(1994) showed that this effect, however, was more apparent when lysine and/or methionine were marginally present in quail. A number of studies in mammals have shown that lysine deficiency can diminish carnitine content of body tissue (Sachan & Mynatt, 1993; Krajcovicova-Kudlackova
et al.2000). Effects of dietary carnitine on growth and lipid oxidation was also reported in several aquaculture species,
e.g. African catfish (Clarias gariepinus Burchell), Red Sea
*Corresponding author:Dr Rodrigo Ozo´rio, fax +31 317 483937, email [email protected]
Abbreviations:FAME, fatty acid methyl ester; FCR, feed conversion ratio; HSI, hepatosomatic index; PUFA, polyunsaturated fatty acid; SGR, specific growth rate.
British Journal of Nutrition(2001),86, 623–636 DOI: 10.1079/BJN2001447
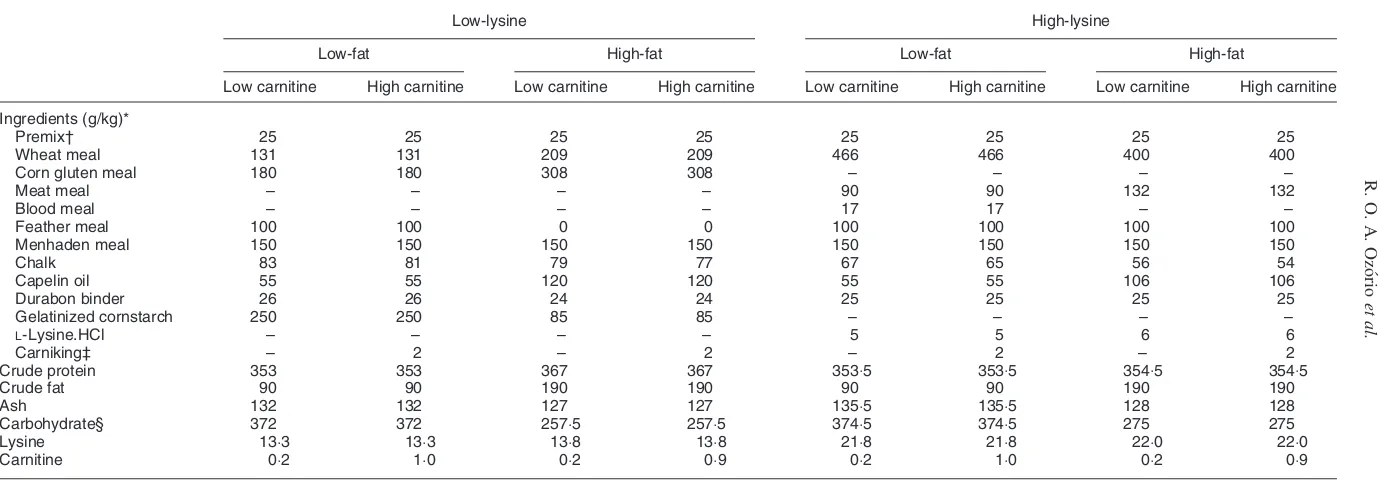
Table 1. Formulation of experimental diets
Low-lysine High-lysine
Low-fat High-fat Low-fat High-fat
Low carnitine High carnitine Low carnitine High carnitine Low carnitine High carnitine Low carnitine High carnitine
Ingredients (g/kg)*
Premix† 25 25 25 25 25 25 25 25
Wheat meal 131 131 209 209 466 466 400 400
Corn gluten meal 180 180 308 308 – – – –
Meat meal – – – – 90 90 132 132
Blood meal – – – – 17 17 – –
Feather meal 100 100 0 0 100 100 100 100
Menhaden meal 150 150 150 150 150 150 150 150
Chalk 83 81 79 77 67 65 56 54
Capelin oil 55 55 120 120 55 55 106 106
Durabon binder 26 26 24 24 25 25 25 25
Gelatinized cornstarch 250 250 85 85 – – – –
L-Lysine.HCl – – – – 5 5 6 6
Carniking‡ – 2 – 2 – 2 – 2
Crude protein 353 353 367 367 353:5 353:5 354:5 354:5
Crude fat 90 90 190 190 90 90 190 190
Ash 132 132 127 127 135:5 135:5 128 128
Carbohydrate§ 372 372 257:5 257:5 374:5 374:5 275 275
Lysine 13:3 13:3 13:8 13:8 21:8 21:8 22:0 22:0
Carnitine 0:2 1:0 0:2 0:9 0:2 1:0 0:2 0:9
* All ingredients, with exception of Carniking, and formulations were provided by Provimi (Rotterdam, The Netherlands).
† Contained (per kg mixture): Vitamin A 774 mg, vitamin D 6:35 m, vitamin E 20 000 mg, CuSO4501 mg, ZnSO415 000 mg, MnSO40:001 mg, CoSO4500 mg, KI 500 mg, Na2SeO335 mg.
‡ Contained (g/kg):L-carnitine 500, silica 350, water 150 (Lonza Group Ltd, Basel, Switzerland).
§ Carbohydrate data were estimated from the measured values of DM, crude protein, crude fat and ash according to: carbohydrate=DM2crude protein2crude fat2ash (modified by Cloet and Heinsbroek, unpublished results from Brafield, 1985).
R.
O.
A.
Ozo
´rio
et
al.
bream (Pagrus major), white prawn (Penaeus indicus)
(Torreeleet al.1993; Chatzifotiset al.1995; Jayaprakas &
Sambhu, 1996 respectively). In contrast to these studies, extra carnitine did not alter growth or body lipid composition in tilapia, salmonids, ornamental cichlid fish (Pelvicachromis pulcher) and hybrid striped bass,Morone chrysops femaleM-saxatilis male (Becker et al. 1999;
Rodehutscord, 1995; Ji et al. 1996; Harpaz et al. 1999;
Gaylord & Gatlin, 2000). These difference of results between species suggest that the effects of dietary carnitine supplements are associated with different factors such as age and feed composition. In addition, metabolic require-ments of the species under study may be important for occurence of the effect.
Similar to the study of Gropp et al. (1994), we
hypothesised that growth and fatty acid concentrations of fish tissues are positively related to dietary carnitine levels. Carnitine supplementation is expected to increase fatty acid oxidation and as a result protein:fat ratio in African catfish body will increase. In addition, one may expect that nutritional conditions, which give decreased carnitine synthesis, e.g. dietary lysine deficiency, will enhance the effect of dietary carnitine.
Since in the effects of carnitine on metabolism and concentration of long-chain fatty acids is most obvious, we
decided to study C14– C22, as defined by Odle (1997), in
tissues of the African catfish.
Material and methods
Experimental animals and husbandry
This experiment was approved by the Dutch Experimental Animal and Welfare Committee according to the EC Directive applied to vertebrate animals.
African catfish (10 g) were obtained from a Dutch commercial catfish hatchery (Fleuren, Someren, The Netherlands). All fish were full siblings and had an identical nutritional history.
The experiment was conducted at the experimental facilities of the Fish Culture and Fisheries Group, Wageningen Institute of Animal Science (WIAS), Wagen-ingen-UR. After arrival, the fish were equally distributed over four aquaria at a density of approximately 230 fish per 70 litre aquarium. The animals were allowed acclimatis-ation to the recirculacclimatis-ation system conditions for 1 week. During this acclimatisation week, fish were fed on a low-carnitine – low-lysine – low-fat diet at a feeding rate of
24 g/kg0:8per d.
After acclimatisation, fish of uniform size (22:7 g) were
randomly assigned to each of sixteen aquaria, twenty-five fish per aquarium. The aquaria used were glass aquaria
ð703540 cmÞwith a 90 litre capacity, filled to 70 litres,
and a 25 % refreshment once per week. Each aquarium was connected to a recirculation system with capacity of
8:25 m3water, and checked daily for dead fish. The flow
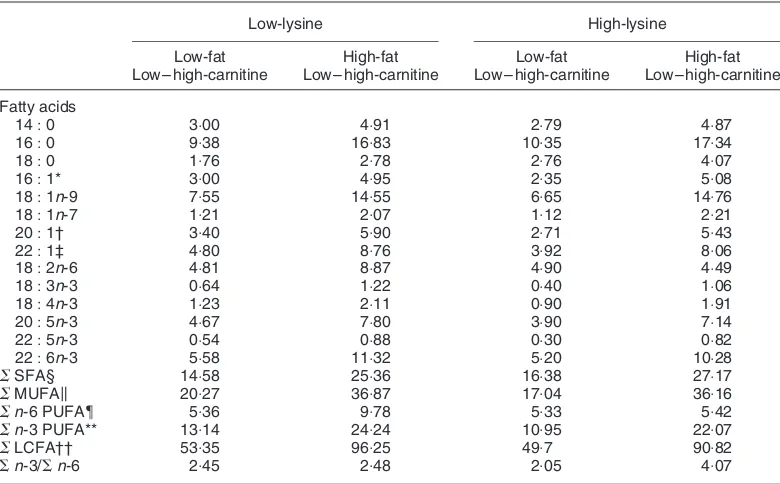
Table 2. Fatty acid concentrations of experimental diets (mg/g diet DM)
Low-lysine High-lysine
Low-fat High-fat Low-fat High-fat
Low –high-carnitine Low– high-carnitine Low– high-carnitine Low –high-carnitine
Fatty acids
14:0 3:00 4:91 2:79 4:87
16:0 9:38 16:83 10:35 17:34
18:0 1:76 2:78 2:76 4:07
16:1* 3:00 4:95 2:35 5:08
18:1n-9 7:55 14:55 6:65 14:76
18:1n-7 1:21 2:07 1:12 2:21
20:1† 3:40 5:90 2:71 5:43
22:1‡ 4:80 8:76 3:92 8:06
18:2n-6 4:81 8:87 4:90 4:49
18:3n-3 0:64 1:22 0:40 1:06
18:4n-3 1:23 2:11 0:90 1:91
20:5n-3 4:67 7:80 3:90 7:14
22:5n-3 0:54 0:88 0:30 0:82
22:6n-3 5:58 11:32 5:20 10:28
SSFA§ 14:58 25:36 16:38 27:17
SMUFAk 20:27 36:87 17:04 36:16
Sn-6 PUFA{ 5:36 9:78 5:33 5:42
Sn-3 PUFA** 13:14 24:24 10:95 22:07
SLCFA†† 53:35 96:25 49:7 90:82
Sn-3/Sn-6 2:45 2:48 2:05 4:07
SFA, saturated fatty acid; MUFA, monounsaturated fatty acids; PUFA, polyunsaturated fatty acids; LCFA, long-chain fatty acid.
* Predominantly 16:1n-7.
† Includes 20:1n-11, 20:1n-9 and 20:1n-7.
‡ Includes 22:n-13, 22:1n-11 and 22:1n-9. § Includes 15:0 and 17:0.
kIncludes 14:1n-3, 15:1n-3 and 18:1n-5.
{Includes 16:3n-6 and 20:3n-6. ** Includes 16:3n-3, 18:2n-3 and 20:4n-3. †† C14– C22as defined by Odle (1997).
rate (6 l/min), water temperature ð27^0:058CÞ; pH
ð7:03^0:38Þ; dissolved O2 (.5 mg/l) and conductivity
ð6:07^0:06 mS=cmÞ were checked daily. NH4 ð0:4^
0:1 mg=1Þ;NO3ð174^29 mg=lÞand NO2ð0:2^0:2 mg=lÞ
were checked once per week. Fish were kept under a 12 h light – dark cycle. In case of mortality, fish were removed and daily feed amount was adjusted to the remaining number.
Diets, feeding and design
The eight experimental diets contained a lysine level of 13 or 21 g/kg, one of two levels of fat (90 and 190 g/kg), and
one of two levels of carnitine (0:2 and 1:0 g/kg) in a
222 factorial design (Table 1). All diets were
isonitrogeneous (350 g crude protein/kg) and close to isoenergetic (about 18 g crude protein/kJ gross energy). Low-carnitine and low-lysine diets were formulated using a combination of wheat meal and corn gluten as the primary protein source. Two levels of dietary lysine and carnitine were selected to represent the below-requirement level and
the above-requirement level for catfish (Robinson et al.
1980; Torreeleet al.1993). Fat levels were set at the outer
margins of the accepted inclusion range for African catfish (Uys, 1989).
Carnikingw (Lonza Group Ltd, Basel, Switzerland) and
L-lysine HCl ingredients were added to each diet by
premixing the respective quantities in the premix prior to extrusion. The ingredients were mixed, extruded using co-rotating screw extruder (APV-Baker, Newcastle, UK)
into 2:24 mm diameter5 mm length pellets and air-dried
to 50 g moisture/kg. The floating diets were fed to fish slowly, in small amounts by hand, two times per day (09.00
and 17.00 hours) at a feeding level of 24 g/kg0:8per d, 7 d per
week. The appetite of the fish was monitored carefully to minimise wastage of food. It was relatively easy to detect the point at which the catfish ceased active feeding from their behaviour since they stop agitating against the water surface and move away from the feeding area of the aquarium. Each feeding lasted about 4 min per aquarium. To obtain the same total feed intake, low-lysine groups were allowed more feeding days. Thus, the experimental sampling was designed in two periods (53 and 74 d).
Diets were analysed for proximate composition and fatty acid concentrations (Table 2) prior to the experiment. Treatments were tested in duplicate aquaria and fish were fed till a total feed intake of 120 g feed/fish was realised.
Sample collection, storage and analytical techniques
Two days before tissue sampling, twelve fish were taken from each treatment, killed by overdose of tricaine methane
sulphonate (0:3 g/l; Crescent Research Chemicals, Phoenix,
AZ, USA) and NaHCO3(0:4 g/l) and weighed individually
to the nearest 0:1 g. Growth performance and feed
conversion were measured from these animals in terms of percentage weight gain (specific growth rate, SGR), feed conversion ratio (FCR) and hepatosomatic index (HSI). Growth response parameters were calculated as follows: SGR ð%=dÞ ¼ ððlnWf2lnW0Þ=tÞ 100 where Wf is the
weight of fish at timet(t¼53 or 74 d),W0is the weight of
fish at time 0; FCR¼total dry feed fed (g)/total wet weight
gain (g); and HSI¼wet weight liver (g)/wet weight fish
(g)100. Proximate compositions and fatty acid
concen-tration were measured from tissues (whole-body, liver and muscle) removed from fifteen fish from each aquarium deprived of food for 24 h prior to sampling. Tissues were
pooled by aquarium, and immediately stored at 2208C.
Frozen muscle samples were cut without thawing into pieces avoiding drip losses, minced using a meat mincer and pooled homogeneously. Frozen liver samples were hom-ogenised using an Ultra Torax grinder (Janke & Kunkel GmbH, Staufen, Germany). After homogenisation, part of each sample was again frozen immediately and freeze-dried to eliminate water interference during certain analyses.
In brief, approximately 100 g sample was placed into the freeze-dryer (FTS system Inc., Stoneridge, NY, USA) and kept under a pressure of 26 Pa and a condenser temperature
of 2858C. The shelf temperature was raised gradually
during the freeze-drying process over 36 h from 2208C to
room temperature. A small sample from each batch was further dried using the standard DM determination (ISO 6496 (International Organization for Standardization, 1983) to evaluate the water content of the freeze-dried material.
After freeze-drying, muscle samples were powdered using a foodstuff mincer (Retsch ZM 100 GmbH, Haan, Germany) and again homogenised. Because of high levels of fat in the liver samples, it was not possible to homogenise them using the foodstuff mincer. Instead, the freeze-dried liver was homogenised using a coffee grinder.
DM was determined by drying the samples for 4 h at
1038C (ISO 6496 (International Organization for
Standardization, 1983)) and ash content was measured by
ashing the samples for 4 h at 5508C (ISO 5984
(Inter-national Organization for Standardization, 1978)). Crude protein was measured by Kjeldahl according to ISO 5983 (International Organization for Standardization, 1978) procedures and calculated as N content multiplied by
6:25. Crude fat was determined by Soxhlet extraction (EEG
18.1.84 no. 15/29 – 30). Gross energy was measured by bomb calorimetry (IKA-C-7000; Fa. IKA-Analysentechnik, Weitersheim, Germany), and fatty acids were measured in duplicate from freeze-dried sample by high resolution GC according to a modified procedure of Lepage & Roy (1984). DM matter, ash, and protein analyses were done from fresh sample of muscle and liver tissues in triplicate and in duplicate respectively. Fat and energy analyses were done from freeze-dried material in duplicate and triplicate respectively. Carnitine determination was performed from freeze-dried material by radiometric detection of free- and acyl-carnitine following the procedure of Christiansen & Bremer (1988).
Fatty acid analysis
Fatty acid methyl ester (FAME) analysis from liver and muscle tissues was performed using a high resolution GC method, employing capillary columns and flame ionisation detection, fitted with an automatic split type injection
1ml:20ml (type SSL 71; Fison Instruments, Milano, Italy).
A small amount (0:2 g) sample was saponified and
transesterified with methanolic KOH and the methyl esters
R. O. A. Ozo´rioet al.
extract into hexane according to a modified direct transesterification technique as described by Lepage & Roy (1984). Tricosanoic acid methyl ester (23:0; Sigma T9900, Sigma, St Louis, MO, USA) was used as internal standard because it is a stable fatty acid, not present in fish tissue and therefore can be easily identified during
chromatography. Injection of 1ml was performed in high
resolution Mega 2 Series (Fison Instruments), fitted with a
30 m0:25 mm i.d. column silicate type and 0:25mm
DB-WAX film 122-7032; J&W Scientific, Folsom, USA). Detector type was the flame ionisation detector and the carrier gas was He with a flow rate of 2 ml/min. The oven
was programmed to start at 808C, rising 58C/min until 1408C
and then 28C/min until 2008C. Thereafter, it rose 18C/min to
the final temperature of 2508C. The injection and detector
temperatures were 2008C and 2508C respectively. Peak
identification and quantification was done by using the relative retention times between each FAME from diet or tissue and the reference standards for the most common
FAME (Sigma kit no. 189-19; Sigma). These include 14:0,
14:1n-5, 15:0, 15:1n-5, 16:0, 16:1n-7, 17:0,
17:1n-7, 18:0, 18:1n-9, 18:2n-6, 18:3n-3, 18:3n-6,
20:0, 20:1n-9, 20:2n-6, 20:3n-3, 20:3n-6, 20:4n-6,
20:5n-3, 21:0, 22:0, 22:1n-9, 22:2n-6, 22:6n-3,
23:0, 24:0 and 24:1n-9. The results are expressed as
FAME and only main FAME are presented. Integration was done by using Chrom-card for Windows, version 1.17 (Fisons Instruments).
Fatty acid balance was calculated assuming no faecal losses of the fatty acids. Therefore, the difference between fatty acid intake and its accumulation in fish body equals their disappearance (apparent oxidation) (Cunnane & Yang, 1995).
Statistical analysis
Results are reported as mean values and standard deviations per treatment unless otherwise stated. Normality was tested using Shapiro-Wilk test. Homogeneity was checked using the absolute residuals according to Levene’s test. Non-homogeneous data were arcsine transformed prior to further
Fig. 1.Effect of feeding different experimental diets on body weight
and feed intake of African catfish (Clarias gariepinusBurchell). For
details of diets and procedures, see Tables 1 and 2. LF, low-fat;
HF, high-fat; LC, low-carnitine; HC, high-carnitine.A, Initial weight;
B, final weight; , feed intake. Values are means for two aquaria
per treatment with twelve fish per treatment, with standard devi-ations shown by vertical bars.
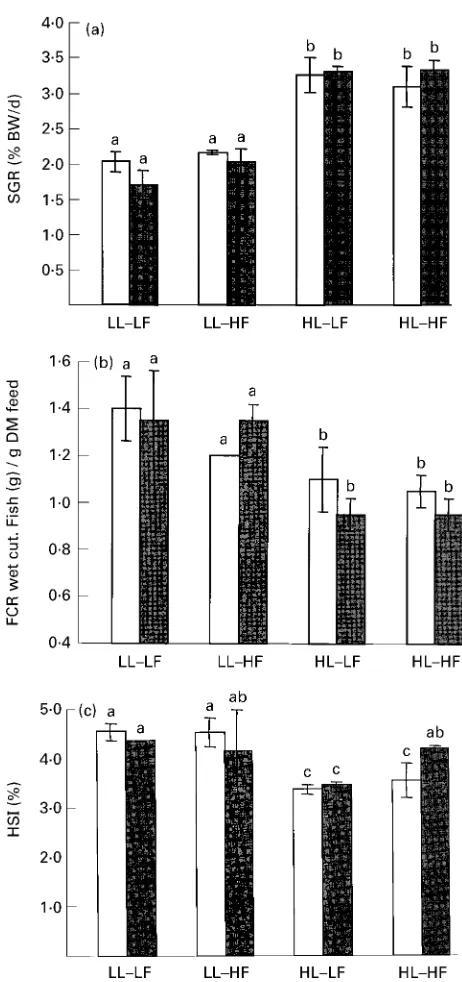
Fig. 2.Effect of feeding different experimental diets on (a) specific growth rate (SGR), (b) feed conversion ratio (FCR) and (c)
hepato-somatic index (HSI) of African catfish (Clarias gariepinusBurchell).
For details of diets and procedures, see Tables 1 and 2 and p. 626. LL, low-lysine; HL, high-lysine; LF, low-fat; HF, high-fat; BW, body
weight.A, Low-carnitine;B, high-carnitine. Values are means for
two aquaria per treatment with twelve fish per treatment, with
stan-dard deviations shown by vertical bars.a,b,cMean values with unlike
superscript letters were significantly different (ANOVA,P,0:05).
statistical analysis. Proximate analysis, FAME analysis and growth data were subjected to the three-way ANOVA according to the model:
Yijkl¼m1Cari1Lysj1Fatk1ðLysCarÞji1ðLys
FatÞjk1ðCarFatÞik1ðCarLysFatÞijk
1eijkl;
where Yijkl corresponds to the growth performance, tissue
proximate composition, carnitine content or fatty acid
concentrations, Cari relates to the dietary carnitine effect,
Lysj to the dietary lysine effect, Fatk to the dietary fat
effect, ðLysCarÞji to the lysine – carnitine interaction
effect, ðLysFatÞjk to the lysine – fat effect; ðCarFatÞik
to the carnitine – fat effect; ðCarLysFatÞijk to the
carnitine – lysine – fat interaction, and eijkl represents the
error term.
Differences between means were reported as significant if
P,0:05. All statistical analyses were performed using SAS
program (Version 6, 1990; Statistical Analysis Systems Inc., Cary, NC, USA).
Results
Growth and proximate composition
The average cumulative mortality during the experiment
was,5 %. Fish grew from a mean initial weight of 22:7 g to
final weights of 105:5 g for low-lysine groups (74 d) and to
129:5 g for high-lysine groups (53 d) (Fig. 1). This gain
coincides with a SGR of 2:3 % body weight/d for low-lysine
groups and 3:3 % body weight/d for high-lysine group
(Fig. 2). Differences in SGR were also reflected in FCR,
which averaged 1:0 g/g in high-lysine groups and 1:5 g/g in
low-lysine groups (Fig. 2). Dietary carnitine supplements
showed no significant effect on the HSI (Fig. 2,P.0:05).
High-lysine diets highly improved SGR and decreased FCR
(P,0:001). Fish receiving low-lysine diets showed higher
HSI than fish fed the high-lysine diets (P,0:01). Dietary fat
supplements showed no apparent effect on growth rates and no interaction whatsoever was observed.
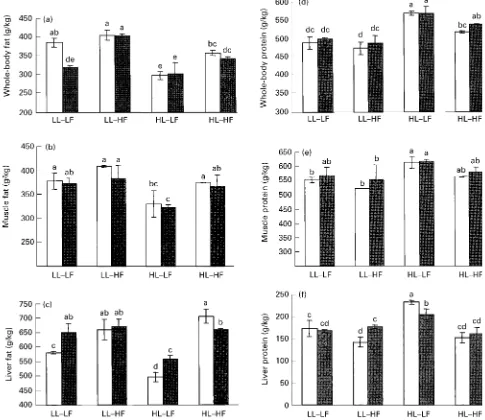
Tissue composition of catfish at the end of the growth experiment varied in crude fat and crude protein contents (Fig. 4). Protein:fat ratio was reduced in all tissues studied as a consequence of high dietary fat supplements
(P,0:05). Dietary low-lysine supplements also increased
body fat contents compared with dietary high-lysine supplements. Dietary carnitine supplements significantly affected whole-body and liver fat content only in low-lysine – low-fat groups.
Tissue carnitine composition
Overall, carnitine content in tissues were positively related
to dietary carnitine level (P,0:001, Fig. 3). High-carnitine
fed fish showed about a 3:5-fold increase in carnitine
content over the low-carnitine groups (P,0:001). Liver
contents of both free- and acyl-carnitine esters were approximately forty times lower than the carnitine contents of the muscle tissue and fifteen times lower than the contents of the whole body. Fish fed low-lysine diets
showed lower liver free-carnitine concentration than
high-lysine animals (P,0:01). High-fat supplements also
reduced liver carnitine. A lysinev.carnitine interaction was
observed (P,0:01), but a carnitinev.fat interaction was not
observed.
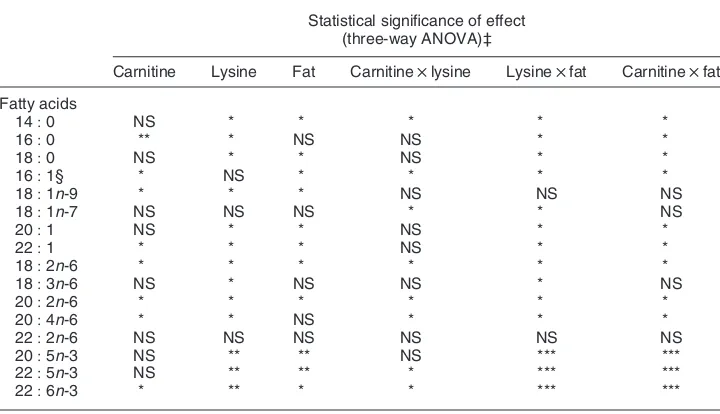
Fatty acid concentration
Effects of dietary carnitine, fat and lysine supplements on fatty acid concentration of the liver and the muscle tissues are shown in Tables 3 and 4 respectively, and the statistical significance is represented in Table 5. Muscle total fatty acids concentration ranged from 271 to 335 mg/kg (Table 3).
Musclen-3 andn-6 long-chain polyunsaturated fatty acids
(PUFA) concentrations were slightly affected after 74 d by
high-carnitine intake (P,0:1). The principal fatty acid
affected was docosahexanoic acid (22:6n-3). The effect of
carnitine on muscle fatty acid concentrations were observed only when fish were offered the low-lysine – low-fat diets.
Fig. 3.Effect of dietary carnitine supplements on free- and
acyl-carnitine content in African catfish (Clarias gariepinus Burchell)
(a) Whole-body; (b) muscle tissue; (c) liver. For details of diets
and procedures, see Tables 1 and 2 and p. 626. ,
Low-lysine– low-fat– low-carnitine; , low-lysine– low-fat–high-carnitine;
, low-lysine–high-fat–low-carnitine; ,
low-lysine–high-fat–high-carnitine; , high-lysine– low-fat–low-carnitine; , high-lysine –
low-fat–high-carnitine; , high-lysine– high-fat– low-carnitine; ,
high-lysine –high-fat–high-carnitine. Values are means for two aquaria per treatment with fifteen fish per aquarium.
R. O. A. Ozo´rioet al.
Table 3.Fatty acid concentrations of muscle total lipids (mg/g tissue DM)*
(Mean values and standard deviations of two aquaria per treatment with fifteen fish per aquarium)
Low-lysine High-lysine
Low-fat High-fat Low-fat High-fat
Low-carnitine High-carnitine Low-carnitine High-carnitine Low-carnitine High-carnitine Low-carnitine High-carnitine
Mean SD Mean SD Mean SD Mean SD Mean SD Mean SD Mean SD Mean SD
Fatty acids
14:0 10:20 0:40 10:58 0:09 13:44 0:85 12:11 1:01 11:72 0:71 11:47 0:07 13:88 0:47 12:90 0:21
16:0 87:95 5:81 82:72 1:86 82:48 0:22 77:84 3:16 71:26 3:59 70:16 0:82 69:50 0:54 69:66 0:16
18:0 18:62 1:50 19:40 0:16 20:81 0:46 20:29 1:59 19:15 1:21 19:92 0:07 20:06 0:34 19:00 0:26
16:1† 15:46 0:82 17:70 0:26 17:29 0:62 16:17 0:88 16:04 0:96 14:81 0:13 16:39 0:64 16:15 0:23
18:1n-9 62:02 1:99 62:52 4:26 65:55 0:30 61:82 7:27 61:26 4:37 59:31 0:04 58:88 0:63 59:43 0:00
18:1n-7 5:94 0:16 6:49 0:03 6:39 0:07 6:08 0:45 6:36 0:02 6:35 0:04 7:04 0:15 6:68 0:21
20:1‡ 10:96 0:30 11:79 0:02 14:50 0:38 13:20 0:86 12:33 0:08 12:31 0:29 14:41 0:47 13:66 0:40
22:1§ 6:99 0:67 7:40 0:14 10:60 0:19 9:19 0:50 8:19 0:27 8:39 0:03 12:04 0:40 10:84 0:68
18:2n-6 18:43 0:47 20:66 0:16 33:01 1:80 28:83 2:84 18:80 0:58 18:58 0:15 18:81 0:33 17:65 0:10
20:2n-6 0:99 0:04 0:94 0:03 1:22 0:04 1:18 0:12 0:81 0:05 0:82 0:02 0:91 0:04 0:88 0:04
20:4n-6 1:03 0:03 1:21 0:04 1:38 0:06 1:33 0:01 1:03 0:06 1:07 0:04 1:27 0:00 1:21 0:02
18:3n-3 1:84 0:12 2:12 0:01 3:50 0:30 2:98 0:28 2:59 0:00 2:54 0:01 3:35 0:09 3:04 0:15
18:4n-3 2:17 0:44 2:69 0:01 4:05 0:38 3:29 0:29 2:93 0:04 2:80 0:01 4:36 0:13 3:71 0:29
20:5n-3 7:21 0:91 8:65 0:24 13:28 1:12 10:73 0:86 9:29 0:08 9:39 0:10 14:20 0:04 12:06 0:20
22:5n-3 2:33 0:11 2:87 0:03 3:66 0:15 3:16 0:25 2:87 0:10 3:01 0:01 3:63 0:21 3:41 0:09
22:6n-3 19:23 0:78 24:53 0:47 34:19 1:93 32:00 1:93 22:24 0:27 22:17 0:37 30:88 1:40 29:32 1:53
SSFAk 118:43 4:74 114:39 2:11 119:08 1:17 112:26 5:83 104:22 5:58 103:70 0:70 106:21 1:40 104:05 0:88
SMUFA{ 102:52 2:63 107:14 3:89 116:15 1:50 108:12 10:07 105:59 5:72 102:64 0:48 110:74 1:09 108:57 1:24
Sn-6 PUFA** 22:79 0:28 25:33 0:14 38:32 2:03 33:86 3:30 22:78 0:87 22:37 0:12 22:77 0:35 21:53 0:00
Sn-3 PUFA†† 34:69 0:66 42:95 0:24 61:72 4:07 54:95 3:80 42:28 0:54 42:34 0:52 59:54 1:84 54:5 2:42
SLCFA‡‡ 278:43 2:66 289:81 5:99 335:27 7:73 309:19 21:13 274:87 44:33 271:05 11:75 299:26 3:65 288:65 2:94
Sn-3/Sn-6 1:52 0:01 1:70 0:02 1:61 0:02 1:62 0:05 1:86 0:05 1:89 0:01 2:62 0:04 2:53 0:11
SFA, saturated fatty acid; MUFA, monounsaturated fatty acids; PUFA, polyunsaturated fatty acids; LCFA, long-chain fatty acid. * For details of diets and procedures, see Tables 1 and 2 and p. 626.
† Predominantly 16:1n-7.
‡ Includes 20:1n-11, 20:1n-9 and 20:1n-7. § Includes 22:n-13, 22:1n-11 and 22:1n-9.
kIncludes 15:0 and 17:0.
{Includes 14:1n-3, 15:1n-3 and 18:1n-5.
** Includes 16:3n-6 and 20:3n-6.
†† Includes 16:3n-3, 18:2n-3 and 20:4n-3.
‡‡ C14– C22as defined by Odle (1997).
Fatty
acids
in
African
catfish
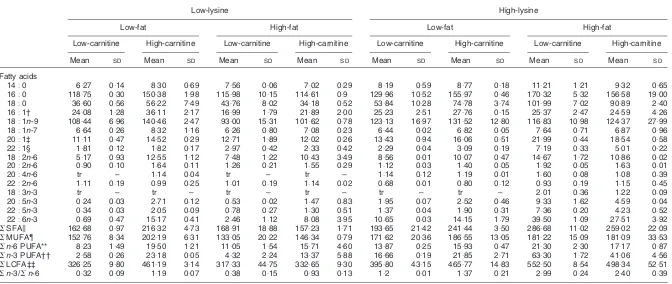
Table 4.Fatty acid concentrations of liver total lipids (mg/g tissue DM)*
(Mean values and standard deviations of two aquaria per treatment with fifteen fish per aquarium)
Low-lysine High-lysine
Low-fat High-fat Low-fat High-fat
Low-carnitine High-carnitine Low-carnitine High-carnitine Low-carnitine High-carnitine Low-carnitine High-carnitine
Mean SD Mean SD Mean SD Mean SD Mean SD Mean SD Mean SD Mean SD
Fatty acids
14:0 6:27 0:14 8:30 0:69 7:56 0:06 7:02 0:29 8:19 0:59 8:77 0:18 11:21 1:21 9:32 0:65
16:0 118:75 0:30 150:38 1:98 115:98 10:15 114:61 0:9 129:96 10:52 155:97 0:46 170:32 5:32 156:58 19:00
18:0 36:60 0:56 56:22 7:49 43:76 8:02 34:18 0:52 53:84 10:28 74:78 3:74 101:99 7:02 90:89 2:40
16:1† 24:08 1:28 36:11 2:17 16:99 1:79 21:89 2:00 25:23 2:51 27:76 0:15 25:37 2:47 24:59 4:26
18:1n-9 108:44 6:96 140:46 2:47 93:00 15:31 101:62 0:78 123:13 16:97 131:52 12:80 116:83 10:98 124:37 27:99
18:1n-7 6:64 0:26 8:32 1:16 6:26 0:80 7:08 0:23 6:44 0:02 6:82 0:05 7:64 0:71 6:87 0:96
20:1‡ 11:11 0:47 14:52 0:29 12:71 1:89 12:02 0:26 13:43 0:94 16:06 0:51 21:99 0:44 18:54 0:58
22:1§ 1:81 0:12 1:82 0:17 2:97 0:42 2:33 0:42 2:29 0:04 3:09 0:19 7:19 0:33 5:01 0:22
18:2n-6 5:17 0:93 12:55 1:12 7:48 1:22 10:43 3:49 8:56 0:01 10:07 0:47 14:67 1:72 10:86 0:02
20:2n-6 0:90 0:10 1:64 0:11 1:26 0:21 1:55 0:29 1:12 0:03 1:40 0:05 1:92 0:05 1:63 0:01
20:4n-6 tr – 1:14 0:04 tr – tr – 1:14 0:12 1:19 0:01 1:60 0:08 1:08 0:39
22:2n-6 1:11 0:19 0:99 0:25 1:01 0:19 1:14 0:02 0:68 0:01 0:80 0:12 0:93 0:19 1:15 0:45
18:3n-3 tr – tr – tr – tr – tr – tr – 2:01 0:36 1:22 0:09
20:5n-3 0:24 0:03 2:71 0:12 0:53 0:02 1:47 0:83 1:95 0:07 2:52 0:46 9:33 1:62 4:59 0:04
22:5n-3 0:34 0:03 2:05 0:09 0:78 0:27 1:30 0:51 1:37 0:04 1:90 0:31 7:36 0:20 4:23 0:52
22:6n-3 0:69 0:47 15:17 0:41 2:46 1:12 8:08 3:95 10:65 0:03 14:15 1:79 39:50 1:09 27:51 3:92
SSFAk 162:68 0:97 216:32 4:73 168:91 18:88 157:23 1:71 193:65 21:42 241:44 3:50 286:68 11:02 259:02 22:09
SMUFA{ 152:76 8:34 202:19 6:31 133:05 20:22 146:34 0:79 171:62 20:36 186:55 13:05 181:22 15:09 181:09 33:53
Sn-6 PUFA** 8:23 1:49 19:50 1:21 11:05 1:54 15:71 4:60 13:87 0:25 15:93 0:47 21:30 2:30 17:17 0:87
Sn-3 PUFA†† 2:58 0:26 23:18 0:05 4:32 2:24 13:37 5:88 16:66 0:19 21:85 2:71 63:30 1:72 41:06 4:56
SLCFA‡‡ 326:25 9:80 461:19 3:14 317:33 44:75 332:65 9:30 395:80 43:15 465:77 14:83 552:50 8:54 498:34 52:51
Sn-3/Sn-6 0:32 0:09 1:19 0:07 0:38 0:15 0:93 0:13 1:2 0:01 1:37 0:21 2:99 0:24 2:40 0:39
tr, trace (,0:5 mg/g); SFA, saturated fatty acid; MUFA, monounsaturated fatty acid; PUFA, polyunsaturated fatty acid; LCFA, long-chain fatty acid. * For details of diets and procedures, see Tables 1 and 2 and p. 626.
† Predominantly 16:1n-7.
‡ Includes 20:1n-11, 20:1n-9, and 20:1n-7.
§ Includes 22:n-13, 22:1n-11 and 22:1n-9.
kIncludes 15:0 and 17:0.
{Includes 14:1n-3, 15:1n-3 and 18:1n-5. ** Includes 16:3n-6 and 20:3n-6. †† Includes 16:3n-6 and 18:2n-3. ‡‡ C14– C22as defined by Odle (1997).
R.
O.
A.
Ozo
´rio
et
al.
Carnitine tended to decrease the concentration of the saturated fatty acids, mainly 16:0, when fish were fed
low-lysine diets. Concentrations ofn-3 andn-6, however, were
elevated by the intake of high-fat diets (P,0:05). Within the
low-lysine groups, high-fat supplements caused an increase
of n-3 and n-6 PUFA deposition respectively, from 38:8
(13:7 %) to 58:3 mg/kg (18:1 %) and from 24:1 (8:5 %) to
36:1 mg/kg (11:2 %) over the feeding trial.
In contrast to muscle, liver of fish fed high-carnitine diets showed an increase in fatty acid concentration, regardless of
dietary lysine and fat level. The fatty acids 18:2n-6,
20:5n-3, 22:6n-3 were the primary fatty acids affected
(Table 4). Dietary carnitine supplements severely raisedn-3
PUFA liver concentration from 2:6 (0:8 %) to 23:2 mg/g
(5 %) when fish were fed 90 g fat and from 2:3 (0:7 %) to
13:4 mg/g (4 %) when fed 190 g fat (P,0:005), and
interactions were also observed (Table 5). The elevation
ofn-3 PUFA concentrations were associated with a 20-fold
increase of 22:6n-3 and 10-fold increase of 20:5n-3
concentrations (P,0:005). Similarly, high-carnitine intake
increased 18:2n-6 concentration 2-fold (P,0:05).
High-carnitine level coupled with low-fat level increased deposition of the saturated and monounsaturated fatty acids.
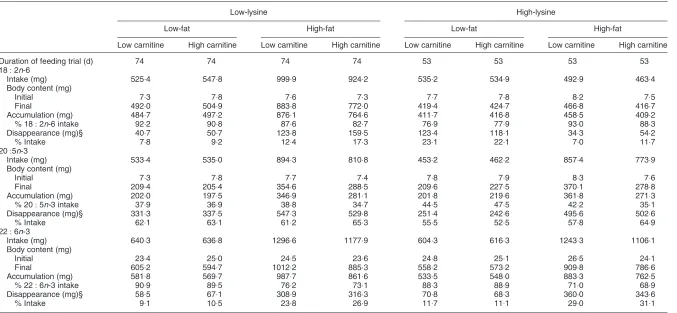
Whole-body fatty acid balance
Effects of dietary treatments on linoleic acid (18:2n-6),
eicosapentanoic acid (20:5n-3) and docosahexanoic acid
(22:6n-3) balance in the whole body of the juvenile
African catfish are presented in Table 6. The whole-body fatty acid balance showed that dietary carnitine and fat supplements clearly affected accumulation and
disappear-ance of 20:5n-3, 18:2n-6 and 22:6n-3. Fish fed
high-lysine supplements accumulated less 18:2n-6 in their
body than the low-lysine animals. In conclusion, dietary
carnitine and fat supplements significantly influenced the whole-body concentrations of linoleic acid and interactions between lysine and fat supplements were observed.
The disappearance of 20:5n-3 was by far the highest
among the PUFA, ranging from 52:5 to 65:3 %. Dietary fat
and carnitine supplements also affected accumulation of
20:5n-3 in the whole body of the African catfish. Within
the low-lysine – low-fat groups, 533:4 and 535 mg 20:5n-3
were consumed respectively by the fish fed the low- and
high-carnitine diets, 202 (37:9 %) and 197:5 mg (36:9 %)
accumulated, and 331:3 (62:1 %) and 337:5 mg (63:1 %)
disappeared. Carnitine supplements slightly increased the
whole-body disappearance of 22:6n-3. Within the
low-lysine – low-fat groups, 640:3 and 636:8 mg 22:6n-3 were
consumed respectively by fish fed low- and high-carnitine
diets, 581 (90:9 %) and 569:7 mg (89:5 %) accumulated, and
58:5 (9:1 %) and 67:1 mg (10:5 %) disappeared. In general,
fish fed 190 g fat/kg diet showed reduced accumulation of
n-6 andn-3 long-chain PUFA compared with fish fed 90 g
fat/kg diet.
Discussion
African catfish
The African catfish is a scaleless fish with an eel-like body shape and a slightly depressed head. African catfish are air-breathers, omnivores, and normally found in turbid waters. It is farmed mainly in Africa and Europe (Huisman & Richter, 1987), although it is now also receiving attention in India, China and some East European countries, and also
has recently been introduced into Brazil (Hechtet al.1996).
It was chosen as a model species because it is a fish easy to farm (robust, rapid growth, closing live-cycle) and because of its well-documented nature of growth and body
Table 5. Three-way ANOVA of individual fatty acid concentration of liver total lipids†
Statistical significance of effect (three-way ANOVA)‡
Carnitine Lysine Fat Carnitinelysine Lysinefat Carnitinefat
Fatty acids
14:0 NS * * * * *
16:0 ** * NS NS * *
18:0 NS * * NS * *
16:1§ * NS * * * *
18:1n-9 * * * NS NS NS
18:1n-7 NS NS NS * * NS
20:1 NS * * NS * *
22:1 * * * NS * *
18:2n-6 * * * * * *
18:3n-6 NS * NS NS * NS
20:2n-6 * * * * * *
20:4n-6 * * NS * * *
22:2n-6 NS NS NS NS NS NS
20:5n-3 NS ** ** NS *** ***
22:5n-3 NS ** ** * *** ***
22:6n-3 * ** * * *** ***
*P,0:05, **P,0:01, ***P,0:005.
† For details of diets and procedures, see Tables 1 and 2 and p. 626. ‡ A three-way interaction was not observed.
§ Predominantly 16:1n-7.
Table 6. Effects of dietary treatments on linoleic acid (18:2n-6), eicosapentanoic acid (20:5n-3) and docosahexanoic acid (22:6n-3) balance in the whole-body (wet weight basis) of the
African catfish (Clarias gariepinusBurchell)*† juvenile
(Mean values for two aquaria per treatment with fifteen fish per aquaria)
Low-lysine High-lysine
Low-fat High-fat Low-fat High-fat
Low carnitine High carnitine Low carnitine High carnitine Low carnitine High carnitine Low carnitine High carnitine
Duration of feeding trial (d) 74 74 74 74 53 53 53 53
18:2n-6
Intake (mg) 525:4 547:8 999:9 924:2 535:2 534:9 492:9 463:4
Body content (mg)
Initial 7:3 7:8 7:6 7:3 7:7 7:8 8:2 7:5
Final 492:0 504:9 883:8 772:0 419:4 424:7 466:8 416:7
Accumulation (mg) 484:7 497:2 876:1 764:6 411:7 416:8 458:5 409:2
% 18:2n-6 intake 92:2 90:8 87:6 82:7 76:9 77:9 93:0 88:3
Disappearance (mg)§ 40:7 50:7 123:8 159:5 123:4 118:1 34:3 54:2
% Intake 7:8 9:2 12:4 17:3 23:1 22:1 7:0 11:7
20:5n-3
Intake (mg) 533:4 535:0 894:3 810:8 453:2 462:2 857:4 773:9
Body content (mg)
Initial 7:3 7:8 7:7 7:4 7:8 7:9 8:3 7:6
Final 209:4 205:4 354:6 288:5 209:6 227:5 370:1 278:8
Accumulation (mg) 202:0 197:5 346:9 281:1 201:8 219:6 361:8 271:3
% 20:5n-3 intake 37:9 36:9 38:8 34:7 44:5 47:5 42:2 35:1
Disappearance (mg)§ 331:3 337:5 547:3 529:8 251:4 242:6 495:6 502:6
% Intake 62:1 63:1 61:2 65:3 55:5 52:5 57:8 64:9
22:6n-3
Intake (mg) 640:3 636:8 1296:6 1177:9 604:3 616:3 1243:3 1106:1
Body content (mg)
Initial 23:4 25:0 24:5 23:6 24:8 25:1 26:5 24:1
Final 605:2 594:7 1012:2 885:3 558:2 573:2 909:8 786:6
Accumulation (mg) 581:8 569:7 987:7 861:6 533:5 548:0 883:3 762:5
% 22:6n-3 intake 90:9 89:5 76:2 73:1 88:3 88:9 71:0 68:9
Disappearance (mg)§ 58:5 67:1 308:9 316:3 70:8 68:3 360:0 343:6
% Intake 9:1 10:5 23:8 26:9 11:7 11:1 29:0 31:1
* Body weight 100 – 130 g.
† For details of diets and procedures, see Tables 1 and 2 and p. 626. § Excludes excretion.
R.
O.
A.
Ozo
´rio
et
al.
composition, which enables a better evaluation of the results.
Performance
Since all treatment groups consumed the same amount of feed, differences in SGR in some groups were reflected in
differences in FCR, which varied between 1:0 and 1:6 g/g.
Low-lysine – fat – low-carnitine and lysine –
high-fat – high-carnitine groups grew 2:3 and 3:3 % body
weight/d respectively. In those situations, the total feed
allowance was consumed in different periods, i.e. 74v.53 d.
Extra lysine supplements to low-lysine diets improved
SGR and decreased FCR (P,0:05). Since juvenile catfish
have a high potential for growth and high food intake, it seems that amino acid imbalance may have a larger impact
on growth depression and feed conversion efficiencies
(Conceic¸a˜o et al. 1998a) than in adult fish. Fish receiving
low-lysine diets showed higher HSI than fish fed the
high-lysine diets (P,0:005). These animals had increased fat and
decreased protein deposition in the liver (Fig. 4). In
addition, Conceic¸a˜oet al.(1998b) showed that amino acid
imbalances between the dietary and the fish amino acid profiles lead to an increase in lipid deposition. Several other studies have also shown supplementation of extra lysine to diets increased protein and reduced fat in tissue of catfish (Munsiri & Lovell, 1993; Li & Robinson, 1998). It has been proposed that fish fed lower dietary fat:carbohydrate ratio
tend to produce higher HSI (Higgs et al. 1992) and lower
growth (Erfanullah, 1998).
The present study showed that dietary carnitine supplementation in low-carnitine diets slightly affected
Fig. 4.Effect of feeding different experimental diets on (a, b, c) fat and (d, e, f) protein content in whole-body, muscle and liver tissues of
Afri-can catfish (Clarias gariepinusBurchell). For details of diets and procedures, see Tables 1 and 2 and p. 626. LL, low-lysine; HL, high-lysine;
LF, low-fat; HF, high-fat.A, Low-carnitine;B, high-carnitine. Values are means for two aquaria per treatment with twelve fish per treatment,
with standard deviations shown by vertical bars. a,b,c,d,eMean values with unlike superscript letters were significantly different (ANOVA,
P,0:05).
SGR and FCR in African catfish. Our results did not support
those of Torreeleet al.(1993), who clearly found faster and
more efficient growth with increased levels of dietary
carnitine. Torreeleet al.(1993) fed commercial diets with
higher crude protein levels compared with our present
study. In addition, Torreele et al. (1993) studied growing
animals from 5 to about 30 g, while in the present experiment, the initial fish size was already 23 g.
Growth rates (per unit of body mass) decrease as fish increase in size therefore a dietary carnitine deficiency may be more easily expressed at small fish size. Our results are in agreement with several other studies (Rodehutscord, 1995;
Chatzifotiset al.1996; Harpazet al.1999), that observed
some effect of carnitine on growth and body composition. The absence of a clear effect of carnitine supplementation on weight gain of fish fed lysine diets suggests that low-lysine level in our present study did not impair the carnitine biosynthesis capacity. It may also be that lysine deficiency overrules any effect of carnitine.
Tissue carnitine content
Dietary lysine and methionine are required for the biosynthesis of carnitine (Broquist, 1997). Dietary lysine deficiency is therefore associated with reduced total body carnitine. It has been reported that endogenous carnitine synthesis alone may not be sufficient to meet the energy demands in fast growing juvenile animals (Rebouche & Seim, 1998; Bamji, 1984). Carnitine homeostasis in animals is maintained by a combination of absorption of carnitine from the diet, a modest rate of biosynthesis, and an efficient reabsorption of carnitine. Thus, fish may become carnitine-deficient if carnitine and/or its precursors are not present in the diet.
In the present study, high-carnitine groups accumulated significantly more free- and acyl-carnitine than low-carnitine groups. This suggests that dietary low-carnitine was absorbed and entered in the intermediary metabolism. Carnitine was stored mainly in the muscle tissue. Muscle
free-carnitine was lower (P,0:01) in fish fed high-lysine
diets. No differences in acyl-carnitine level were observed. Three alternatives are suggested as explanation. First, high-lysine levels may lead to some extent to a decrease in
carnitine biosynthesis. Daviset al.(1993) also showed that
rats fed high-lysine diet had lower plasma carnitine concentration than did controls. Second, this depression may be caused by increased excretion in kidney. Third, being a carnitine storage site implies that muscle carnitine may be transported to other body tissues during high metabolic demands.
In contrast to muscle, liver free-carnitine content was substantially increased and acyl-carnitine decreased when fish were fed high-lysine diets compared with the low-lysine groups. High-fat – high-carnitine groups showed lower free carnitine:acyl-carnitine ratio compared with fat – low-carnitine group. This decline was caused by an increase in the carnitine ester content, thus indicating an increase in carnitine mobilisation towards lipid oxidation.
Fatty acid concentrations
Overall, the decrease of muscle fatty acid concentrations corresponds well with the decrease in muscle total fat content (Fig. 4). It is feasible to speculate that this reduction
was due to a decrease in muscle C14– C22 fatty acid
concentrations. Few changes in muscle fatty acid concen-trations were observed in high-carnitine fish compared with low-carnitine animals.
High-carnitine supplements have severely increased
PUFA concentration, in particular 22:6n-3 and 20:5n-3,
in the livers of fish fed low-lysine diets. Recent evidence
suggests that 22:6n-3 and 20:5n-3 appear to be
synthesised in liver mitochondria by the recently elucidated fatty acid desaturases for which carnitine is an essential co-factor (Infante & Huszagh, 2000; Wynn & Ratledge, 2000). Our current results showed that feeding extra carnitine to low-lysine – low-fat-fed fish may overrule the repression of PUFA biosynthesis and/or fatty acid desaturation and elongation. Muscle fat content was not significantly affected by high-carnitine supplements. High-carnitine lowered whole-body fat content and increased the protein:fat ratio
only in low-lysine – low-fat groups (Fig. 4, P,0:05). The
latter findings and the fact that the great majority of lipids in catfish are deposited in intraperitoneal fat indicates that the increase in liver fatty acid concentrations is derived from intraperitoneal tissue. However, we did not measure intraperitoneal fat in the present study.
Whole-body fatty acid balance
To the best of our knowledge, this is the first study to report the effect of carnitine on fatty acid balance in fish. Without tracers, the quantitative method can be utilised to determine the partitioning of dietary fatty acids between accumulation, and disappearance (or apparent oxidation) in response to altered nutrient and energy demands. The results showed that fatty acid disappearance was stimulated significantly by high-carnitine and high-fat supplements in the diet. Fatty acid oxidation was assumed to be equal to fatty acid disappearance. We assumed however complete digestion of fatty acids. This may have resulted in overestimation of lipid oxidation rate. In addition, the fatty acid method assumes that PUFA disappearance can be calculated from measurements of fatty acid intake and accumulation.
Conversion of fatty acids like 20:5n-3 to 22:6n-3 may
have occurred. Thus, this method only gives some references to fatty acid balance.
In conclusion, although the present study indicated a limited benefit of dietary carnitine supplementation on growth performance, our findings support the hypothesis that dietary carnitine can enhance the mobilisation of long-chain fatty acids towards oxidation.
Implications
Endogenous triacylglycerols represent an important source of fuel during physical activity, whereas triacylglycerol oxidation increases progressively during exercise. The oxidation rate of lipids is determined by energy require-ments of working muscles and by the availability of
R. O. A. Ozo´rioet al.
free-carnitine delivery to muscle mitochondria. Carnitine has been thoroughly investigated for its role in exercise performance in human subjects and terrestrial animals
(Souffleux, 1994; Janssenset al.1998; Kraemer & Volek,
2000; Sachan & Hongu, 2000). The effect of dietary carnitine supplements on the energy metabolism of fish during a physical stress (i.e. exhaustive swimming) is however unknown, and therefore it is a new and interesting subject for future research.
Acknowledgements
We acknowledge Tino Leffering and Dick Bongers for their excellent technical assistance during the fatty acid analysis. We are greatful to Mr Richard Sasse representing Lonza Group Ltd. for financing the carnitine analysis and for
the generous supplying of Carnikingw, Professor Johein
Harmeyer for the carnitine analyses reported here, and Professor Martin Verstegen for editorial assistance. This study was supported by the Brazilian National Research Council (CNPq), Brazil, no. 200298/95.0. The results presented are part of the PhD thesis of R.O.A. Ozo´rio.
References
Bamji MS (1984) Nutritional and health implications of lysine
carnitine relationship.World Review of Nutrition and Dietetics
44, 185 – 211.
Becker K, Schreiber S, Angoni C & Blum R (1999) Growth
performance and feed utilization response of Oreochromis
niloticusOreochromis aureushybrids toL-carnitine measured over a full fattening cycle under commercial conditions. Aquaculture174, 313 – 322.
Bilinski E & Jonas REE (1970) Effects of coenzyme A and carnitine on fatty acid oxidation by rainbow trout mitochondria. Canadian Journal of Fisheries and Aquatic Science 27, 857 – 864.
Brafield AE (1985) Laboratory studies of energy budget. InFish
Energetics: New Perspectives, pp. 257 – 281 [P Taylor and P Calow, editors]. London, UK: Croom Helm.
Brooks DE & McIntosh JE (1975) Turnover of carnitine by rat
tissues.Biochemical Journal148, 439 – 445.
Broquist HP (1997) Memories of microbes and metabolism. Annual Review of Nutrition17, 1 – 18.
Cederblad G & Lindstedt S (1976) Metabolism of labeled carnitine
in the rat.Archives of Biochemistry Biophysics175, 173 – 180.
Chatzifotis S, Takeushi T & Seikai T (1995) The effect of dietary carnitine on growth performance and lipid composition in Red
Sea bream fingerlings.Fisheries Science61, 1004 – 1008.
Chatzifotis S, Takeushi T & Seikai T (1996) The effect of dietary carnitine supplementation on growth of Red Sea bream (Pagrus major) fingerlings at two levels of dietary lysine.Aquaculture
147, 235 – 248.
Christiansen RZ & Bremer J (1988) Acetylation of Tris-(hydroxymethyl) amino-methane (Tris) and Tris derivatives by
carnitine acetyltransferase.FEBS Letters86, 99 – 102.
Conceic¸a˜o LEC, Ozo´rio ROA, Suurd EA & Verreth JAJ (1998a) Amino acid profiles and amino acid utilization in larval African
catfish (Clarias gariepinus): effects of ontogeny and
tempera-ture.Fish Physiology and Biochemistry19, 43 – 57.
Conceic¸a˜o LEC, Verreth JAJ, Verstegen MWA & Huisman EA (1998b) preliminary model for dynamic simulation of growth in fish larvae: application to the African catfish (Clarias
gariepinus) and turbot (Scophthalmus maximus).Aquaculture
163, 215 – 235.
Cunnane SC & Yang J (1995) Zinc deficiency impairs whole-body accumulation of polyunsaturates and increases the utilization of [1-14 C]-linoleate for de novo lipid synthesis in pregnant rats. Canadian Journal Physiology Pharmacology73, 1246 – 1252. Davis AT, Kruggel EM & Randall S (1993) Excess of dietary
lysine increases skeletal muscle and plasma trimethyllysine in
rats.Journal of Nutrition6, 1109 – 1116.
Erfanullah AKJ (1998) Effect of dietary carbohydrate-to-lipid ratio on growth and body composition of walking catfish (Clarias batrachus).Aquaculture161, 159 – 168.
Gaylord TG & Gatlin DM (2000) Dietary lipid level but not
L-carnitine affects growth performance of hybrid striped bass
(Morone chrysopsM. saxatilis).Aquaculture190, 237 – 246.
Gropp JM, Schumacher A & Schweigert FJ (1994) Recent research
in vitamin nutrition with special emphasis to vitamin A, b
-carotene andL-carnitine. InProceedings of the Meeting of the
Arkansas Nutrition Conference, pp. 124 – 134. Fayetteville, AR: Arkansas Poultry Federation.
Harpaz S, Becker K & Blum R (1999) The effect of dietary
L-carnitine supplementation on cold tolerance and growth of the
ornamental cichlid fish (Pelvicachromis pulcher) – preliminary
results.Journal of Thermal Biology24, 57 – 62.
Hecht T, Oellermann L & Verheust L (1996) Perspective on clariid
catfish culture in Africa. InThe Biology and Culture of Catfishes
[M Legendre and JP Proteau, editors].Aquatic Living Resources
9, 197 – 206.
Heo K, Odle J, Han IK, Cho W, Seo S, van Heugten E & Pilkington
DH (2000) DietaryL-carnitine improves nitrogen utilization in
growing pigs fed low energy, fat-containing diets.Journal of
Nutrition130, 1809 – 1814.
Higgs DA, Dosanjh BS, Uin LM, Himick BA & Eales JG (1992) Effects of dietary-lipid and carbohydrate-levels and chronic
3,5,30-triiodo-L-thyronine treatment of growth, appetite, food
and protein-utilization and body composition of immature
rainbow-trout, Oncorhynchus-mykiss, at low-temperature.
Aquaculture105, 175 – 190.
Huisman EA & Richter CJJ (1987) Reproduction, growth, health
control and aquaculture potential of the African catfish,Clarias
gariepinus(Burchell 1822).Aquaculture63, 1 – 14.
Infante JP & Huszagh VA (2000) Secondary carnitine deficiency
and impaired docosahexaenoic (22:6n-3) acid synthesis: a
common denominator in the pathophysiology of diseases of
oxidative phosphorylation and beta-oxidation. FEBS Letters
469, 1 – 5.
International Organization for Standardization ISO 5483 (1979) Animal Feeding Stuffs – Determination of Nitrogen Content and Calculation of Crude Protein Content, Geneva: ISO.
International Organization for Standardization ISO 5984 (1978) Animal Feeding Stuffs – Determination of Crude Ash, Geneva: ISO.
International Organization for Standardization ISO 6496 (1983) Animal Feeding Stuffs – Determination of Moisture Content, Geneva: ISO.
Janssens GPJ, Buyse J, Seynaeve M, Decuypere E & De Wilde R (1998) The reduction of heat production in exercising pigeons
afterL-carnitine supplementation.Poultry Science77, 578 – 584.
Jayaprakas V & Sambhu C (1996) Growth response of white
prawn,Penaeus indicus, to dietaryL-carnitine.Asian Fisheries
Science9, 209 – 219.
Ji H, Bradley TM & Tremblay GC (1996) Atlantic salmon (Salmo salar) fed L-carnitine exhibit altered intermediary metabolism
and reduced tissue lipid, but no change in growth rate.Journal of
Nutrition126, 1937 – 1950.
Kraemer WJ & Volek JS (2000)L-Carnitine supplementation for
the athlete: a new perspective. Annals of Nutrition and Metabolism44, 88 – 89.
Krajcovicova-Kudlackova M, Simoncic R, Bederova A, Babinska K & Beder I (2000) Correlation of carnitine levels to methionine
and lysine intake.Physiological Research49, 399 – 401.
Lepage G & Roy CC (1984) Improved recovery of fatty acid through direct transesterification without prior extraction or
purification.Journal of Lipid Research25, 1391 – 1396.
Li MH & Robinson EH (1998) Effects of supplemental lysine and methionine in low protein diets on weight gain and body
composition of young channel catfish Ictalurus punctatus.
Aquaculture163, 297 – 307.
Munsiri P & Lovell RT (1993) Comparison of satiate and restricted feeding of Channel catfish with diets of varying protein quantity
in production ponds.Journal of the World Aquaculture Society
24, 459 – 465.
Odle J (1997) New insights into the utilization of medium-chain triglycerides by the neonate: observations from a piglet model. Journal of Nutrition127, 1061 – 1067.
Rabie MH & Szilagyi M (1998) Effects of L-carnitine
supplementation of diets differing in energy levels on performance, abdominal fat content, and yield and composition
of edible meat of broilers. British Journal of Nutrition 80,
391 – 400.
Rebouche CJ & Seim H (1998) Carnitine metabolism and its
regulation in microorganisms and mammals.Annual Review of
Nutrition18, 39 – 61.
Robinson EH, Wilson RP & Poe WE (1980) Re-evaluation of the lysine requirement and lysine utilization by fingerling channel
catfish.Journal of Nutrition110, 2313 – 2316.
Rodehutscord M (1995) Effects of supplemental dietaryL-carnitine
on the growth and body composition of rainbow trout
(Oncorhynchus mykiss) fed high-fat diets. Journal of Animal
Physiology and Animal Nutrition73, 276 – 279.
Sachan DL & Mynatt RL (1993) Wheat gluten-based diet retarded ethanol metabolism by altering alcohol-dehydrogenase and not
carnitine status in adult rats.Journal of the American College of
Nutrition12, 170 – 175.
Sachan DS & Hongu N (2000) Increases in VO2 maxand metabolic
markers of fat oxidation by caffeine, carnitine, and choline
supplementation in rats.Journal of Nutritional Biochemistry11,
521 – 526.
Souffleux G (1994) Benefit of using Rossovet carnitine for horses
in preparation for amateur carriage-racing.Pratique Ve´te´rinaire
E´ quine26, 241 – 248.
Torreele E, van der Sluiszen A & Verreth J (1993) The effect of
dietaryL-carnitine on the growth performance in fingerlings of
the African catfish (Clarias gariepinus) in relation to dietary
lipid.British Journal of Nutrition69, 289 – 299.
Uys W (1989) Aspects of the nutritional physiology and dietary
requirements of juvenile and adult sharptooth catfish, Clarias
gariepinus(Pisces: Clariidae). PhD Thesis, Rhodes University. Van Kempen TATG & Odle J (1995) Carnitine affects octanoate oxidation to carbon dioxide and dicarboxylic acids in colostrum-deprived piglets: In vivo analysis of mechanisms involved based
on CoA- and carnitine-ester profiles.Journal of Nutrition125,
238 – 250.
Wynn JP & Ratledge C (2000) Evidence that the rate-limiting step
for the biosynthesis of arachidonic acid inMortierella alpinais
at the level of the 18:3 to 20:3 elongase.Microbiology-UK
146, 2325 – 2331.
R. O. A. Ozo´rioet al.