Full Terms & Conditions of access and use can be found at
http://www.tandfonline.com/action/journalInformation?journalCode=cbie20
Download by: [Universitas Maritim Raja Ali Haji] Date: 17 January 2016, At: 23:48
Bulletin of Indonesian Economic Studies
ISSN: 0007-4918 (Print) 1472-7234 (Online) Journal homepage: http://www.tandfonline.com/loi/cbie20
Survey of recent developments
Jason Allford & Moekti P. Soejachmoen
To cite this article: Jason Allford & Moekti P. Soejachmoen (2013) Survey of recent developments, Bulletin of Indonesian Economic Studies, 49:3, 267-288, DOI: 10.1080/00074918.2013.850627
To link to this article: http://dx.doi.org/10.1080/00074918.2013.850627
Published online: 05 Dec 2013.
Submit your article to this journal
Article views: 296
View related articles
ISSN 0007-4918 print/ISSN 1472-7234 online/13/030267-22 © 2013 Indonesia Project ANU http://dx.doi.org/10.1080/00074918.2013.850627
SURVEY OF RECENT DEVELOPMENTS
Jason Allford* Moekti P. Soejachmoen*
The Treasury, Canberra TNP2K, Jakarta
SUMMARY
In the 15 years since the Asian inancial crisis, the Indonesian economy has beneited from a stable macroeconomic policy framework and prudent macro-economic policy settings. Economic growth has been solid, inlation has been contained and government inances have strengthened. Indonesia weathered the global inancial crisis better than many countries, and it subsequently beneited from the low global interest rates resulting from highly stimulatory monetary conditions in many advanced economies, especially the US.
In the middle of 2013, however, speculation on when the US Federal Reserve would begin to unwind its program of quantitative easing saw global interest rates jump. Short-term capital lowed out of Indonesia, causing the stock market to fall, the currency to depreciate and interest rates to rise. On top of this, GDP growth appeared to be slowing, the trade balance worsening and inlation increas -ing. In late September and October, the failure of the US to raise its legislated debt ceiling led to speculation that it might fail to meet some of its debt obligations, which fuelled inancial-market volatility.
It is yet to be seen whether the Indonesian economy and its inancial markets are suficiently lexible to make a smooth transition to the new external reality. The policy tools available to the government to deal with the short-term economic challenges are limited: it introduced an economic policy package in August, and Bank Indonesia (BI) raised oficial interest rates in August and September, follow -ing two increases earlier in the year.
These pressures from global inancial markets have drawn attention to the need for further structural reforms in Indonesia, including those aimed at deep -ening inancial markets, strength-ening inancial-sector supervision, freeing up trade and encouraging competition, and maintaining the government’s revenue base in the face of falling commodity prices. While some reforms, particularly in inancial-sector supervision, are already in train, it may be dificult for Indonesia to make serious gains on longer-term economic reforms before the 2014 presiden -tial elections.
* The update on mineral taxation and regulation was contributed by Dan Devlin, also from the Treasury, in Canberra. TNP2K = Tim Nasional Percepatan Penanggulangan Kemiski -nan (National Team for the Acceleration of Poverty Reduction), Ofice of the Vice-President. The authors thank Haryo Aswicahyono, Gavin Forte, Edimon Ginting, Anton Gunawan, Anwar Nasution, Suahasil Nazara, Isa Rachmatawarta, Sjamsu Rahardja, Djauhari Sitorus, Ashley Taylor, and numerous faculty members of the ANU College of Asia and the Paciic, who bear no responsibility for any errors.
INTRODUCTION
This Survey covers recent economic developments in Indonesia, primarily from June to September 2013. Economic data released in that period show a continued slowing of GDP growth, a worsening of the balance-of-payments position and high inlation (following the government’s decision to increase subsidised fuel prices in June).
Much of this economic news was overshadowed, however, by increasingly intense speculation on the 2014 presidential elections – until August, when vola-tile conditions in international inancial markets, related to the possible tapering of quantitative easing in the US, brought the economy back into the headlines. By late August the Indonesian government was under considerable pressure from the public and from investors to respond to the disappointing economic data that had come out in recent months. It earned a reprieve when conditions eased in September.
This Survey looks at the response of the government and BI to this period of inancial pressure. The government released an economic policy package in late August, which it claimed would address a number of issues in the economy. The central bank raised interest rates four times between June and September, as well as introducing other measures to calm inancial markets at the height of the tur -bulence in August.
The government’s immediate response to deteriorating economic indica-tors and inancial-market pressure pointed to the need for economic reforms to improve the economy’s lexibility in the face of external developments and to boost its longer-run growth potential. This Survey considers two areas for reform: irst, the progress of changes to the inancial-market supervisory arrangements and, second, the state of policy in the mining and energy sector. Financial-market supervision is important because the fast-growing inancial sector is extending its reach into many parts of the Indonesian economy. Poor or inconsistent regulation could fail to prevent poorly managed inancial institutions from disrupting the macroeconomic environment. The need for policies that increase the eficiency of exploration, investment and production in the mining and energy sector is re-inforced by the budget’s high reliance on revenue from this sector and the vulner-abilities exposed by the fall in global commodity prices in early 2013.
POLITICAL DEVELOPMENTS
McRae (2013, in this issue) discusses the chief political developments in the lead-up to Indonesia’s elections in 2014. In the wider political sphere, however, two events need to be mentioned. In August, Indonesia’s Corruption Eradication Commission (Komisi Pemberantasan Korupsi, KPK) arrested Rudi Rubiandini, the head of the upstream oil and gas regulator SKK Migas, on bribery charges related to an alleged payment from Kernel Oil, an energy company based in Sin-gapore. SKK Migas was created in November 2012, after the Constitutional Court dissolved its predecessor, BPMigas (Cornwell and Anas 2013: 18–19). The con-tinuing importance of the oil and gas industry to Indonesia’s economy relies on further investment in exploring oil reserves, particularly by foreign oil compa-nies. The need to present a clean image to potential investors made Rudi’s arrest disappointing to Indonesia.
A second disappointment was the KPK’s arrest in October of Akil Mochtar, the Chief Justice of the Constitutional Court, also on corruption charges. The case against Akil involves a ruling by the court over an electoral dispute in Kaliman-tan. The KPK’s investigation led to ive further arrests of people with connections to the Golkar party, whose interests in Banten were at stake. This high-proile case caused considerable consternation in Indonesia; the court had won general respect for its impartial rulings since its establishment, in 1999. After Akil’s arrest, President Yudhoyono promised to set up an independent judicial commission to oversee the court. If this initiative is akin to his 2009 creation of a task force to eliminate the ‘judicial maia’ (McLeod 2011: 9; Fealy 2011: 353), it may achieve little.
Although the indictments against Rudi and Akil are still sub judice, they may further erode conidence in public authorities and the judiciary. They may also inluence the 2014 elections, by disadvantaging those candidates for parliament and the presidency whom the electorate associates with parties that have been tarred by the corruption brush, and by advantaging candidates who can articulate an uncompromising stance on corruption.
MACROECONOMIC DEVELOPMENTS Growth
In 2011 and 2012, Indonesia faced a combination of slow growth in advanced economies and low global interest rates – themselves partly the result of accom-modative monetary policy in advanced economies, aimed at boosting growth. Indonesia and other emerging economies beneited from this situation, owing to their attractiveness to investors seeking high growth and high yields. The inlow of foreign capital supported investment and sustained economic growth, notwithstanding the slower growth in some of Indonesia’s advanced-economy trading partners. These effects began to unwind in the middle of 2013, as the pros-pect of stronger growth and higher interest rates in the US and other advanced economies started to slow the low of portfolio investment into Indonesia (Nehru 2013: 147–9). It is possible that this transition will weigh on Indonesian economic growth in the near future, although the net effect and the precise timing of any impact are dificult to forecast, and growth will remain subject to many inluences.
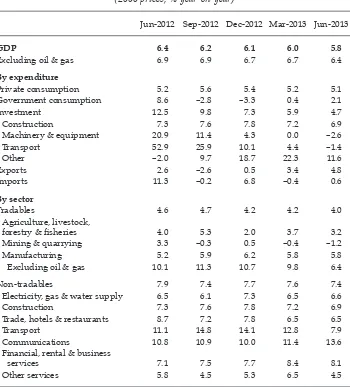
In the year to the second quarter of 2013, Indonesia recorded GDP growth of 5.8% (table 1), down slightly from the 6.0% rate of growth recorded in the irst quarter. This continues a gradual trend of slowing GDP growth since the fourth quarter of 2010, when the rate peaked at 6.8%.1 In August, BI described slowing
growth as ‘part of rebalancing the domestic economy with the global economic downturn and the impact of rising inlation’ (BI 2013a), which suggests that the monetary authorities are comfortable with some slowing of growth to ease pres-sures on the balance of payments and inlation.
On the expenditure side, slowing GDP growth was explained by slower growth in consumption and particularly investment. This was partly offset by slower
1 Historical GDP data may be revised if Statistics Indonesia changes the base year for its national accounts. Possible changes to the national accounts are discussed in box 1.
growth in the imported component of expenditure, while government spending and exports were both higher.
Household consumption is a large proportion of the Indonesian economy; it composed 55% of expenditure on GDP in current prices in the second quarter of 2013. Yet its share has fallen continuously since 2000, largely because of the sus-tained increase of the share of investment, from a modest 20% in 2000, to a peak of 33% in 2012, to a similar share during the irst half of 2013. Despite this historically high proportion (Van der Eng 2009: 351), table 1 shows that the rate of growth of real investment has slowed markedly over the past year. Growth of invest-ment in structures remained steady, which may relect sustained investinvest-ment in residential structures and public infrastructure, rather than investment in non-residential commercial structures. But the slowdown of investment in machinery
TABLE 1 Components of GDP Growth (2000 prices; % year-on-year)
Jun-2012 Sep-2012 Dec-2012 Mar-2013 Jun-2013
GDP 6.4 6.2 6.1 6.0 5.8
Excluding oil & gas 6.9 6.9 6.7 6.7 6.4
By expenditure
Private consumption 5.2 5.6 5.4 5.2 5.1
Government consumption 8.6 –2.8 –3.3 0.4 2.1
Investment 12.5 9.8 7.3 5.9 4.7
Construction 7.3 7.6 7.8 7.2 6.9
Machinery & equipment 20.9 11.4 4.3 0.0 –2.6
Transport 52.9 25.9 10.1 4.4 –1.4
Other –2.0 9.7 18.7 22.3 11.6
Exports 2.6 –2.6 0.5 3.4 4.8
Imports 11.3 –0.2 6.8 –0.4 0.6
By sector
Tradables 4.6 4.7 4.2 4.2 4.0
Agriculture, livestock,
forestry & isheries 4.0 5.3 2.0 3.7 3.2
Mining & quarrying 3.3 –0.3 0.5 –0.4 –1.2
Manufacturing 5.2 5.9 6.2 5.8 5.8
Excluding oil & gas 10.1 11.3 10.7 9.8 6.4
Non-tradables 7.9 7.4 7.7 7.6 7.4
Electricity, gas & water supply 6.5 6.1 7.3 6.5 6.6
Construction 7.3 7.6 7.8 7.2 6.9
Trade, hotels & restaurants 8.7 7.2 7.8 6.5 6.5
Transport 11.1 14.8 14.1 12.8 7.9
Communications 10.8 10.9 10.0 11.4 13.6
Financial, rental & business
services 7.1 7.5 7.7 8.4 8.1
Other services 5.8 4.5 5.3 6.5 4.5
Source: CEIC Asia Database.
and equipment, and particularly in transport vehicles, is remarkable. The lower level of investment in transport vehicles may be related to higher fuel prices, which have dampened the appetite for commercial vehicles. The slowdown in investment in machinery and equipment may be related to the substantial slow-ing of imports over the past year, which is consistent with the depreciation of the rupiah relative to the US dollar from 9,734 in April to 11,404 in September (BI 2013b: table 9.6).
On an industry basis, non-tradables continue to lead output growth. Commu-nications maintained its impressive performance, achieving a record rate of 13.6% annual real growth over the year to June. Among tradables, the most noticeable development was the decrease in mining output by 1.2% in the year to the second quarter, conirming a trend that began in the third quarter of 2012. Disaggregated, the national accounts reveal that most of this decline originated in the oil and gas subsector. It contracted by 4.7% over the year, while other mining (excluding quarrying) grew by just 0.7%.
The contraction in oil and gas output relects the fall that started in the 1990s in the physical production of crude oil. In energy equivalents, gas production exceeded oil production in 2002. Despite the existence of oil reserves in Indonesia,
BOX 1 How Fast Is Indonesia’s Economy Growing?
During 2010–12, Indonesia’s GDP in constant prices grew at an average annual rate of 6.3%. The 2014 budget expects growth of 6.3% in 2013 and 6.4% in 2014. Yet this may not materialise if Statistics Indonesia (Badan Pusat Statistik, BPS) changes some of its national accounting procedures in the course of 2014, as it did in 2004 (Van der Eng 2005). To calculate GDP in constant prices, for example, it may change the benchmark year from 2000 to 2010. A retrospective application of these changes to 2010–13 may yield a downward revision of GDP growth.
The new 2010 benchmark year requires output in all sectors of the Indonesian econ-omy to be valued at 2010 prices (rather than 2000 prices). Current national-accounts data reveal that the implicit price index of total GDP increased from 100 in 2000 to 315 in 2012. But prices changed at different rates across sectors. For example, the implicit price index in construction rose to 500, isheries to 442 and government services to 487, while for the production of services in hotels it rose only to 165, banking to 183 and sea transport to 206.
Using a new benchmark year therefore involves reweighting the output of the dif-ferent sectors of the economy. As output growth varied across sectors, the new weight-ing yields different rates of growth of GDP in constant prices in retrospect. Assumweight-ing that BPS will introduce no other changes in its national accounting practices, and using the implicit sectoral price weights for 2010 in the current national-accounts data as a proxy, the reweighting yields a downward revision of GDP growth to an average of 5.7% for 2010–12.
BPS does not follow the United Nations’ 1993 System of National Accounts, which recommends ‘chain-linking’ to calculate GDP growth in constant prices. It expresses GDP in constant prices in prices of the preceding year. It is not certain whether BPS will do this. Again using the implicit sectoral price weights as a proxy, this procedure may yield a retrospective downward revision of GDP growth to an average of 6.4% for 2010–12. It may also increase year-to-year volatility in the growth rate, including modest growth of 2.5% in 2012.
a lack of exploration and new investments has restricted output growth in the mining sector. Foreign oil producers continue to be concerned about the prospects for fair cost-recovery rules, and about the regulatory environment more generally (Boyd et al. 2010). SKK Migas noted in July 2013 that onerous permit processes by regional administrations, the sealing of wells and oil theft are the biggest hin-drances to Indonesia’s oil production (SKK Migas 2013). The circumstances lead-ing to the formation of SKK Migas, in 2012, and the arrest, in August 2013, of its head may have exacerbated the concerns of oil producers.
Investment and exports
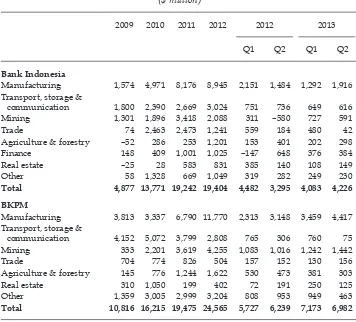
In 2012, gross inlows of foreign direct investment (FDI) reached their highest level ever. BI’s data on FDI for the irst and second quarters of 2013 seemed to suggest that this year’s inlows would be lower than those of 2011 and 2012. Yet table 2 shows that quarterly inlows to June 2013 compare well with those of 2012. At an aggregated level, they increased slightly, by 7%. But there are substantial differences among sectors in FDI inlows. The largest sector is manufacturing, in which FDI decreased by 12% relative to the comparable period in 2012, while mining received $427 million of FDI, compared with a divestment of $269 million in the irst half of 2012.
BI’s data give only a partial impression of foreign investment. Every quar-ter, Indonesia’s Investment Coordinating Board (Badan Koordinasi Penanaman Modal, BKPM) aggregates data from the reports of foreign-owned irms. These data include investments from foreign and domestic sources but exclude invest-ments in the oil and gas and inancial sectors (Lindblad and Thee 2007: 20–1; Nehru 2013: 147). The BKPM data in table 2 conirm that 2012 was a year of record investment activity by foreign irms, and that investment activity by foreign irms in the irst two quarters of 2013 was 18% higher than in the corresponding quar -ters in 2012. Again, the table reveals variations among sectors.
The investment trends in mining seem to contradict accumulating pessimism in the sector. A previous Survey noted that new export-processing requirements would reduce investment (Burke and Resosudarmo 2012: 307–8). In 2013, the government continued to impose further requirements on domestic and foreign-owned mining operations (see ‘Mineral taxation and regulation’, below, and box 2) to exert greater domestic control over the minerals industry. In addition, the price of copper fell by 11% between January and September,2 because of concerns
about slower economic growth in China and the possibility that central banks in the developed world will scale back their stimulus measures. Likewise, tin and nickel prices have lost 8% and 21%, respectively, in the year to date. The invest-ment activities of foreign-owned mining irms may slow in the remainder of 2013; imports of capital goods in the mining sector have been falling since late last year, which may foreshadow a fall in FDI (BKPM’s investment realisation data typi-cally lag three to nine months behind such imports). (BKPM 2013a)
The investment data from BKPM are slightly higher than those from BI, even though the former do not include FDI in oil and gas production or the inancial sector. BKPM’s realisation data are based on permanent business permits (Izin
2 IMF commodity prices, available at <http://www.imf.org/external/np/res/commod/ index.aspx>.
Usaha Tetap), issued to approved foreign and domestic investment projects that have commenced commercial production. It deines FDI as any investment with foreign-equity participation, no matter how small. In addition, its measures of FDI relate to the total value of the investment in question, which includes not only the equity contribution of, and the loans from, the foreign partner but also the equity contribution of Indonesian partners, as well as loans from all other sources needed to inance the investment. In other words, BKPM’s approved FDI data are gross measures that may greatly exaggerate the inancial contribution of foreign owners – and, indeed, of all foreign sources of inance. BI’s investment data are based on guidelines from the IMF and the United Nations Conference on Trade and Development, which include three internationally accepted components of FDI: equity capital, loan capital provided by foreign principals, and the share of re-invested earnings of foreign irms attributable to foreign principals (Lindblad and Thee 2007).
TABLE 2 Foreign Direct Investment by Sector, 2009–13 ($ million)
2009 2010 2011 2012 2012 2013
Q1 Q2 Q1 Q2
Bank Indonesia
Manufacturing 1,574 4,971 8,176 8,945 2,151 1,484 1,292 1,916 Transport, storage &
communication 1,800 2,390 2,669 3,024 751 736 649 616
Mining 1,301 1,896 3,418 2,088 311 –580 727 591
Trade 74 2,463 2,473 1,241 559 184 480 42
Agriculture & forestry –52 286 253 1,201 153 401 202 298
Finance 148 409 1,001 1,025 –147 648 376 384
Real estate –25 28 583 831 385 140 108 149
Other 58 1,328 669 1,049 319 282 249 230
Total 4,877 13,771 19,242 19,404 4,482 3,295 4,083 4,226
BKPM
Manufacturing 3,813 3,337 6,790 11,770 2,313 3,148 3,459 4,417 Transport, storage &
communication 4,152 5,072 3,799 2,808 765 306 760 75
Mining 333 2,201 3,619 4,255 1,083 1,016 1,242 1,442
Trade 704 774 826 504 157 152 130 156
Agriculture & forestry 145 776 1,244 1,622 530 473 381 303
Real estate 310 1,050 199 402 72 191 250 125
Other 1,359 3,005 2,999 3,204 808 953 949 463
Total 10,816 16,215 19,475 24,565 5,727 6,239 7,173 6,982
Sources: BI (2013b): table V.37; BKPM (2013b).
Note: Bank Indonesia data are balance-of-payment data and refer to inlows of FDI, excluding the oil
and gas sectors. They are provisional for Q1 2013 and very provisional for Q2 2013; BKPM data refer to realised investment reported by foreign-owned irms to BKPM; they exclude FDI in oil and gas production and the inancial sector, which is subject to the approval of and investment reporting to the Ministry of Finance.
During the irst seven months of 2013, the nominal value of Indonesia’s goods exports was $106 billion – well below that of the corresponding periods in 2011 ($116 billion) and 2012 ($113 billion), owing to both external and internal pressures. Externally, economic growth in Indonesia’s most important export des-tinations (Japan, China, Hong Kong, Singapore, South Korea, the US, and India) slowed considerably or failed to pick up. Economic growth in Japan and Korea in the irst half of 2013 remained anaemic, at 0.7% and 1.8%, respectively, year-on-year. Indonesia’s second-biggest export destination, China, saw growth slip from double-digit levels in 2010 to 7.5% year-on-year in June 2013. India also saw eco-nomic growth slow markedly, from around 10% in the irst half of 2010 to around 5% year-on-year in early 2013. Indonesia is not the only economy experiencing a slowdown in exports, which restricts growth – so, too, are the export-oriented economies in East Asia and the large and more protectionist economies in Latin America. Brazil, for example, expects to grow at just 2% this year. In October, the IMF reduced its global growth prediction for 2013 by 0.3 percentage points, to 2.9%, and lowered its 2014 global growth expectation to just 3.6% (IMF 2013). Hence, while global demand may now be gradually rising, its rate of growth is unlikely to boost the Indonesian economy.
Furthermore, Indonesia’s export sector faces several domestic dificulties. The depreciation of the rupiah has beneited those sectors producing primary com -modities for export, since they depend less on imported inputs. Yet the tin-mining sector, for example, has suffered from the consequences of changed regulatory arrangements that attempt to increase domestic value-adding and trading, which impeded tin exports in August and September (see box 2). For exporting manu-facturers, such as those producing textiles and garments, or electronic and elec-trical goods, the beneits of currency depreciation have been partly offset by the increased cost of imported inputs.
In addition, low productivity, as well as pressures caused by rising minimum wages (Cornwell and Anas 2013: 20–7) have hurt some exporters. A survey in Sep-tember by the Centre for Strategic and International Studies, in Jakarta, revealed that rising wages could price Indonesia out of global export markets if minimum-wage increases were to continue. From 2010 to 2011, minimum-wages in Indonesia rose by 5.0% while labour productivity rose by just 3.4%, compared with China’s respective rates of 7.2% and 10.0% (Jakarta Post, 6/9/2013).3 A proposed
presi-dential instruction in September was intended to cap next year’s minimum-wage increases to 5.0% above inlation for labour-intensive industries, and to 10.0% above inlation for other industries (Jakarta Post, 15/9/2013). This announcement was clearly intended to inluence discussions about next year’s minimum-wage increases. Five days later, however, the government stated that the details of the proposal were still being negotiated, and that minimum-wage increases in 2014 would not be capped, although Hidayat, the industry minister, mentioned in par-liament that the increase will be below 20% (Jakarta Post, 20/9/2013).
The government still faces some barriers to improving the business environ-ment for foreign investenviron-ment and exports, especially in customs and logistics.
3 The survey also reveals that Indonesia’s minimum wages grew by 30% between 2010 and 2013 – faster than those of any other country in Asia, and well ahead of those of China (8%) and Vietnam (7%).
Waiting times at Tanjung Priok, Indonesia’s biggest port, increased from 4.8 days to 6.4 days, or by 33%, between October 2010 and November 2012. Longer waiting times have reduced Indonesia’s competitiveness and made it more dificult for the country to join global, just-in-time supply chains (Cubillos and Sandee 2013). The government could reduce delays at Tanjung Priok by, for example, increas-ing the number of importers with access to the prominent-partners (mitra utama, MITA) priority lane,4 allowing more parallel processes to take place during
cus-toms clearance, providing incentives for early submission of import declarations, and continuing to strengthen Indonesia’s National Single Window.5
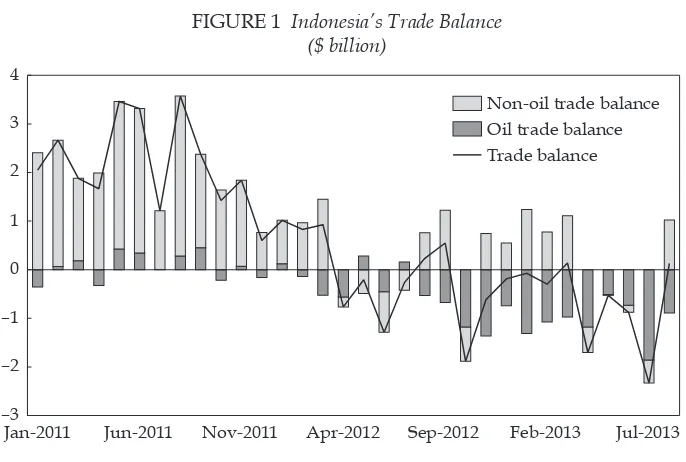
Flagging exports caused Indonesia’s trade deicit to increase to $5.6 billion in the irst seven months of 2013, before a surplus in the non–oil and gas sector in August reduced it to $5.5 billion. Figure 1 shows that the overall trade deicit up to July was dragged down by that of the oil and gas sector ($7.6 billion), which has been in deicit since August 2012. In the quarter, these trade deicits contributed to a current-account deicit of $9.8 billion, or close to 4.4% of quarterly GDP (table 3). Exports of fuel, vegetable oil and fats, machinery and mechanical equipment, and rubber have declined in 2013 compared with 2012, while exports of minerals and fertiliser have increased. Non–oil and gas imports were lower in 2013 than in
4 The MITA priority lane at Indonesia’s ports grants a select number of traders paperless clearance through customs. Only around 100 traders have MITA access; most are large companies with advanced IT systems and post-clearance auditing facilities. (Lesher 2012: 54).
5 Implemented in 2010, Indonesia’s National Single Window aims to transfer goods more quickly across the country’s borders, by providing a single contact point for customs and cargo procedures at each of Indonesia’s ive main ports (OECD 2012: 148).
FIGURE 1 Indonesia’s Trade Balance ($ billion)
Jan-2011 Jun-2011 Nov-2011 Apr-2012 Sep-2012 Feb-2013 Jul-2013 –3
–2 –1 0 1 2 3 4
Non-oil trade balance Oil trade balance Trade balance
Source: CEIC Asia Database.
2012. Imports of machinery, mechanical equipment and vehicles were also lower in 2013, while imports of electrical equipment, iron and steel, plastics, organic chemi-cals, cereal, and cottons were higher. With the depreciation of the rupiah and the increase in fuel prices weighing down imports, BI expects the current-account dei -cit to ease to 3.4% of GDP in the third quarter of 2013 (Jakarta Globe, 8/10/2013).
Inlation, exchange rates and monetary policy
After running at around 4.5% during 2012, inlation increased to well above 5.0% in early 2013. This increase was mainly the result of increasing food prices, which have been growing at double-digit rates since early 2013 (Cornwell and Anas 2013: 12; Nehru 2013: 153–4). The government’s reduction of fuel subsidies on 22 June 2013 also put further upward pressure on the CPI. The increase in fuel prices was relected in the transport component of the CPI, which increased at a monthly rate of 5.6% in June and 13.9% in July, before dropping back to 1.3% in August, leaving transport prices up by 21.2% in the year to August 2013. The transport component of the CPI has typically grown very little, owing to the set price of subsidised fuel. The CPI had increased by 5.9% in the year to June 2013, but it increased by 8.6% in July, following the reduction in fuel subsidies, and continued
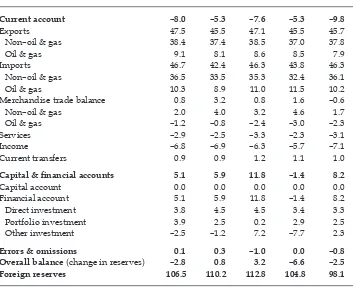
TABLE 3 Balance of Payments ($ billion)
Jun-2012 Sep-2012 Dec-2012 Mar-2013 Jun-2013
Current account –8.0 –5.3 –7.6 –5.3 –9.8
Exports 47.5 45.5 47.1 45.5 45.7
Non–oil & gas 38.4 37.4 38.5 37.0 37.8
Oil & gas 9.1 8.1 8.6 8.5 7.9
Imports 46.7 42.4 46.3 43.8 46.3
Non–oil & gas 36.5 33.5 35.3 32.4 36.1
Oil & gas 10.3 8.9 11.0 11.5 10.2
Merchandise trade balance 0.8 3.2 0.8 1.6 –0.6
Non–oil & gas 2.0 4.0 3.2 4.6 1.7
Oil & gas –1.2 –0.8 –2.4 –3.0 –2.3
Services –2.9 –2.5 –3.3 –2.3 –3.1
Income –6.8 –6.9 –6.3 –5.7 –7.1
Current transfers 0.9 0.9 1.2 1.1 1.0
Capital & inancial accounts 5.1 5.9 11.8 –1.4 8.2
Capital account 0.0 0.0 0.0 0.0 0.0
Financial account 5.1 5.9 11.8 –1.4 8.2
Direct investment 3.8 4.5 4.5 3.4 3.3
Portfolio investment 3.9 2.5 0.2 2.9 2.5
Other investment –2.5 –1.2 7.2 –7.7 2.3
Errors & omissions 0.1 0.3 –1.0 0.0 –0.8 Overall balance (change in reserves) –2.8 0.8 3.2 –6.6 –2.5 Foreign reserves 106.5 110.2 112.8 104.8 98.1
Source: CEIC Asia Database
at a similar annual level in August and September. Monthly inlation dropped to 1.1% in August and to –0.3% in September.
Neither the increase in food prices nor the increase in transport prices is the result of strong demand growth, so there is scope for the central bank to ignore their direct impact on inlation, although their impact on inlation expectations will still be a consideration for monetary policy. Having left the policy rate at 5.75% since January 2012, the bank’s board elected to increase the policy rate at meetings in June, July, August and September, by a total of 150 basis points. The policy rate increased to 7.25%, where the board left it in October. After each of these meetings, the board nominated controlling inlation or inlation expecta -tions among its reasons for raising the rate. The likely inlationary effects of the continued depreciation of the rupiah against the currencies of many of Indone-sia’s major trading partners – except for Japan – also contributed to the bank’s decisions to tighten monetary policy.
BI uses the policy rate to inluence inlation expectations, but the rate is not linked to any instrument in the inancial market and is therefore an imperfect measure of the bank’s stance on monetary policy (McLeod 2011: 14). In contrast, the Bank Indonesia Certiicate (Sertiikat Bank Indonesia, SBI) rate is determined in inancial markets. The nine-month SBI rate inched up in the course of 2013, from 4.84% in January to 6.96% in September. The growth of money supply (proxied by currency in circulation) slowed to just 9.9% over the year to August and to an aver-age of 13.8% during June–August. This was below the averaver-age of 14.8% over the previous 17 months, when the real nine-month SBI was marginally positive overall (BI 2013b: tables 1.25 and 8.1). Although the real nine-month SBI rate turned irmly negative during July–August, owing to accelerating inlation, it seems likely that monetary policy has a moderating effect on inlation.
Fiscal policy
President Yudhoyono presented the 2014 budget plan to parliament on 16 August. This was largely a business-as-usual budget, containing no major spending sur-prises. The government forecast a 10.7% increase in revenue in 2014 and a 5.2% increase in spending, which it estimated would lead to a fall in the budget deicit from 2.4% of GDP in 2013 to 1.5% in 2014. If realised, this would be a considerable tightening of iscal policy.
Indonesia offers a challenging environment for such policy. Higher inlation and a depreciating currency suggest that tighter iscal policy may help to reduce inlationary pressure and maintain investor conidence in Indonesia. This would support BI’s stance on monetary policy. But tighter iscal policy would also put downward pressure on GDP growth, which has already been slowing.
On 23 August, the government announced an economic policy package, one of the stated aims of which was to maintain economic growth.6 On one hand, the government’s plan to reduce the budget deicit to close to 1% of GDP is dificult to
6 The press referred to it as a stimulus package. See, in particular, ‘New stimulus pack-age aims to spur growth’ (Jakarta Post, 24/8/13) and ‘Indonesia plans policy stimulus to woo investors and help rupiah’ (Jakarta Globe, 23/8/13). See also ‘August’s economic policy package’ (below, this article).
reconcile with such a package. On the other, the package is unlikely to stimulate growth in the near term – its measures may at best promote modest growth in the longer term.
The combination of a tighter budget that strengthens the government’s iscal position and measures that boost the economy’s potential for longer-term growth is a sensible policy set. But the government’s framing of its intentions for iscal policy – sometimes arguing that the economy needs support, sometimes arguing that it needs to lean against inlationary and current-account pressures – is con -fusing and may indicate confused decision-making. It would be better for the government to be clear that its budget strategy is focused on medium-term iscal sustainability, that other economic measures are intended to increase the econo-my’s potential for supply-side growth and that monetary policy is the primary tool of short-term demand management (if all of this is indeed the case).
Adding to the confusion were several reasons to doubt that the government will reduce its budget deicit to the proposed level. First, some of the basic assump -tions underlying the budget look too optimistic. Economic growth is assumed to be 6.3% in 2013 and 6.4% in 2014, which seems too high. Indeed, Chatib Basri, the Minister for Finance, lowered the government’s growth expectations for 2013 to 5.8%–5.9%, just days after the budget had been delivered (Jakarta Post, 24/8/2013), and the central bank revised down its 2013 growth projections to 5.5%–5.9% (BI 2013c). In addition, the budget assumes the exchange rate to be 9,600 rupiah per dollar in 2013 and 9,750 in 2014, which is well below the current rate. Second, the forecast increase in total expenditure of only 5.2% in 2014 would be a substantial slowing from the 15.9% expected for 2013, and would be dificult to achieve.
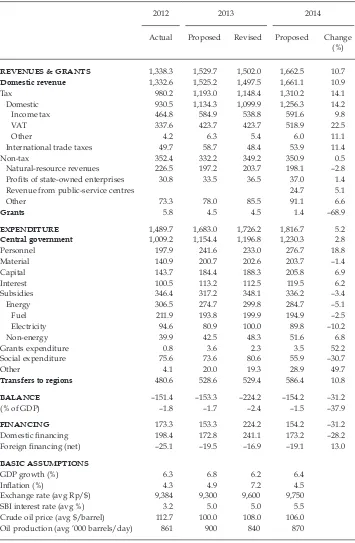
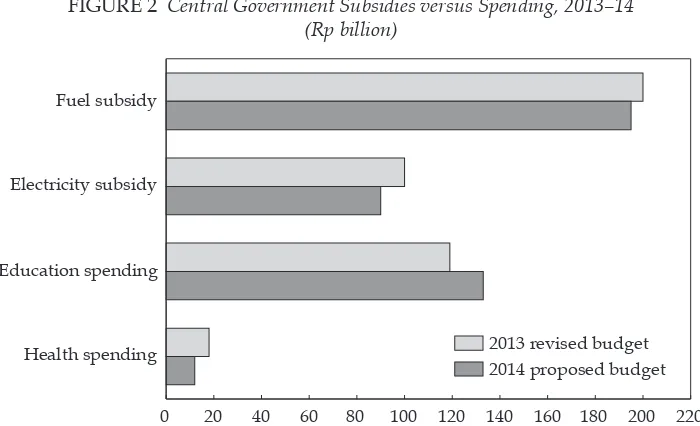
Third, spending on fuel subsidies depends on the demand for fuel and the price of crude oil, factors that the government does not control. The assumed prices for crude oil – $108 a barrel in 2013 and $106 in 2014 – are not unreason-able, but unexpected variations in these numbers may result in large swings in the cost of fuel subsidies. This is what happened in mid-2013, when spending on fuel subsidies tracked well above budget and threatened to push the deicit beyond the legislated cap of 3% of GDP. In response, the government increased the price of subsidised fuels. Yet even with these substantial increases in fuel prices, and with the corresponding reductions in subsidies, the government’s revised budget for 2013 still allocated more money to fuel subsidies than did the initial budget. The proposed budget for 2014 sees only a small decrease in expected spending on subsidies (see igure 2).
Spending on the fuel subsidy not only presents problems for budget man-agement; it is also poor-quality spending. The revised 2013 and proposed 2014 budgets (table 4) show that spending on energy subsidies (around two-thirds of which is on fuel and one-third on electricity) remains high as a share of govern-ment expenditure, composing approximately a quarter of central-governgovern-ment expenditure (total expenditure less transfers to regions) in 2013 and 2014. By way of comparison, this amount is around one and a half times that spent directly by the central government on education and around 15 times that spent directly on health. With most of the beneit of the fuel subsidy going to middle- and upper-income groups, this spending is clearly regressive.7
7 See also Olivia and Gibson (2008).
(Rp trillion)
2012 2013 2014
Actual Proposed Revised Proposed Change (%)
REVENUES & GRANTS 1,338.3 1,529.7 1,502.0 1,662.5 10.7 Domestic revenue 1,332.6 1,525.2 1,497.5 1,661.1 10.9
Tax 980.2 1,193.0 1,148.4 1,310.2 14.1
Domestic 930.5 1,134.3 1,099.9 1,256.3 14.2
Income tax 464.8 584.9 538.8 591.6 9.8
VAT 337.6 423.7 423.7 518.9 22.5
Other 4.2 6.3 5.4 6.0 11.1
International trade taxes 49.7 58.7 48.4 53.9 11.4
Non-tax 352.4 332.2 349.2 350.9 0.5
Natural-resource revenues 226.5 197.2 203.7 198.1 –2.8 Proits of state-owned enterprises 30.8 33.5 36.5 37.0 1.4
Revenue from public-service centres 24.7 5.1
Other 73.3 78.0 85.5 91.1 6.6
Grants 5.8 4.5 4.5 1.4 –68.9
EXPENDITURE 1,489.7 1,683.0 1,726.2 1,816.7 5.2
Central government 1,009.2 1,154.4 1,196.8 1,230.3 2.8
Personnel 197.9 241.6 233.0 276.7 18.8
Material 140.9 200.7 202.6 203.7 –1.4
Capital 143.7 184.4 188.3 205.8 6.9
Interest 100.5 113.2 112.5 119.5 6.2
Subsidies 346.4 317.2 348.1 336.2 –3.4
Energy 306.5 274.7 299.8 284.7 –5.1
Fuel 211.9 193.8 199.9 194.9 –2.5
Electricity 94.6 80.9 100.0 89.8 –10.2
Non-energy 39.9 42.5 48.3 51.6 6.8
Grants expenditure 0.8 3.6 2.3 3.5 52.2
Social expenditure 75.6 73.6 80.6 55.9 –30.7
Other 4.1 20.0 19.3 28.9 49.7
Transfers to regions 480.6 528.6 529.4 586.4 10.8
BALANCE –151.4 –153.3 –224.2 –154.2 –31.2
(% of GDP) –1.8 –1.7 –2.4 –1.5 –37.9
FINANCING 173.3 153.3 224.2 154.2 –31.2
Domestic inancing 198.4 172.8 241.1 173.2 –28.2
Foreign inancing (net) –25.1 –19.5 –16.9 –19.1 13.0
BASIC ASSUMPTIONS
GDP growth (%) 6.3 6.8 6.2 6.4
Inlation (%) 4.3 4.9 7.2 4.5
Exchange rate (avg Rp/$) 9,384 9,300 9,600 9,750
SBI interest rate (avg %) 3.2 5.0 5.0 5.5
Crude oil price (avg $/barrel) 112.7 100.0 108.0 106.0 Oil production (avg ’000 barrels/day) 861 900 840 870
Source: Ministry of Finance.
Note: The change column is the difference between the 2013 revised budget and the 2014 proposed budget. VAT = value-added tax. SBI = Sertiikat Bank Indonesia (Bank Indonesia Certiicate).
The budget also provides initial funding to support Law 40/2004 on the National Social Security System (Sistem Jaringan Sosial Nasional, SJSN), which aims to deliver social security to all eligible citizens. In 2011, the government enacted Law 24/2011 on the Social Security Agency (Badan Penyelenggara Jami -nan Sosial, BPJS), a statutory body charged with implementing the SJSN. The BPJS will establish a health-insurance program from 1 January 2014 (Simmonds and Hort 2013) and a labour-insurance program from no later than 1 July 2015. The latter will cover work-related accident insurance, old-age insurance, pen-sions and life insurance. There are no long-run igures available on the expected cost of these programs, but if successful they all represent a potentially large expense.
AUGUST’S ECONOMIC POLICY PACKAGE
In recent months, as speculation has intensiied on when the US Federal Reserve would begin to taper its program of quantitative easing, Indonesia and other emerging economies have absorbed pressure from inancial markets. In late August, this pressure seemed particularly worrying. On 23 August, the Indone-sian government responded with an economic policy package aimed, in part, at quelling some of the concerns of inancial markets about Indonesia (Jakarta Post, 24/8/2013). We now know that the pressure was short-lived, but at the time there was a sense that the situation could worsen, and the government’s response was delivered in that context. It also suggests how the government may respond to inancial-market pressures in future.
Indonesia had entered 2013 with an apparently healthy combination of strong economic growth, low inlation and low interest rates. Indonesia’s growth out -look, like that of many other emerging economies, was strong relative to advanced
FIGURE 2 Central Government Subsidies versus Spending, 2013–14 (Rp billion)
Health spending Education spending Electricity subsidy Fuel subsidy
0 20 40 60 80 100 120 140 160 180 200 220
2013 revised budget 2014 proposed budget
Source: Ministry of Finance.
economies. This outlook, combined with highly accommodative monetary policy in the US and Japan, for example, saw strong capital inlows, a corresponding rise in the stock market and a fall in bond yields. By April 2013, the Jakarta Composite Index had surged to record levels and 10-year government bond yields had fallen to around 5.5% (Nehru 2013: 154–5).
Indonesia’s economic policymakers had been concerned for some time by the risks to the economy from a probable reversal of portfolio investments once the US and other countries began to return their monetary policy to a more normal footing. But the dificulties in forecasting the likely timing and magnitude of those changes in capital lows meant that there was no obvious set of policies that would help guard against the risks.
Portfolio investment started to leave Indonesia in late May (Nehru 2013: 154-5), which set in train consequences for inancial markets and the wider economy. The uncertainty surrounding quantitative easing triggered a series of adjust-ments for Indonesia and brought inancial markets back onto the front page of newspapers. The rupiah, as well as local stocks and bonds, came under heavy selling pressure. By the end of August, the Jakarta Composite Index was almost 20% below its high for the year, in late April; the exchange rate passed 11,000 rupiah per dollar for the irst time in more than four years; and 10-year govern -ment bond yields hit 8.5%.
In this environment, the government moved to introduce an economic policy package with four objectives: (a) to reduce the current-account deicit and support the rupiah; (b) to sustain economic growth; (c) to maintain purchasing power and combat inlation; and (d) to increase investment.8 The package included
meas-ures to encourage exports by providing tax breaks for export-oriented industries; to reduce oil imports by increasing the proportion of biodiesel in diesel fuel; to apply higher luxury taxes on some cars and branded goods; and to increase min-eral exports by relaxing some regulatory hurdles, including delaying by a year the implementation of quotas on exports of some unprocessed minerals. The package also provided tax incentives for labour-intensive industries, to support economic growth; relaxed import quotas on some food products, to reduce pres-sure on inlation; and promised to simplify licensing procedures, to encourage investment.
At the same time, BI announced that it would give banks more lexibility in managing their foreign exchange. The Ministry of Finance issued ministerial decrees to relax bonded-zone regulations; eliminate the value-added tax (VAT) on luxury goods on certain products (including on non-iction books); and delay the payment of income tax for certain industries, on the condition that they do not reduce their employment levels.
It was immediately clear that the policy package would do little to alleviate inancial-market pressures or boost growth in the short term. The package did contain a number of smaller, useful measures, however, such as the one-year delay on quotas for raw-mineral exports and the relaxation of import quotas for some food products – albeit measures that provide temporary relief from policies whose aim is to restrict trade. Of the other measures, some will take time to have
8 The full text of the package can be found at the Ministry of Finance website: <http:// www.sjdih.kemenkeu.go.id/Ind/?strArghome=nothome&strArg=ind01>.
an effect, such as the tax breaks for labour-intensive industries; some will be dif-icult to implement, such as the increased biodiesel requirement; and some may not have much of an effect on the economy at all, such as the removal of VAT on non-iction books.
Financial markets were unimpressed by the government’s response to the eco-nomic situation, so eyes turned to BI. At a special board meeting on 29 August, the bank’s governors agreed to raise the policy rate by 50 basis points. They raised it by a further 25 basis points the following month. While the effect of movements in the policy rate can be disputed, these rate increases suggest that the central bank needs to be seen to be responding to inancial-market developments. At the August meeting, the bank increased the lending-facility rate by 25 basis points, to 7.00%, and the deposit-facility rate by 50 basis points, to 5.25%. It also cut the holding period for SBIs from six months to one month, agreed to include Bank Indonesia deposit certiicates as a component of secondary statutory reserves and extended its bilateral swap arrangement with the Bank of Japan.
It is dificult to discern precisely what role the government’s policy package and the actions of BI played in calming inancial markets. Financial market vola -tility eased in September, although this was due largely to reduced speculation in the US about when the Federal Reserve would begin to taper its program of quantitative easing, and the effect was felt by most emerging economies, not just Indonesia. With the likelihood of volatility continuing to worry global inancial markets in 2014, owing in part to the uncertainty about quantitative easing and to tensions between the White House and Congress over US iscal policy, the experi -ence of August highlights the limited tools available to the Indonesian govern-ment to combat inancial-market disturbance, and the need for a irmer resolve if the external situation were to become seriously negative. Arguably, one of the best things that Indonesia can do is not to stand in the way of inancial-market adjust -ments when the economy is under pressure. A falling exchange rate, falling stock prices and rising bond yields are necessary adjustments that encourage investors back into the country.
The implementation of the policy package also highlighted areas of poor coop-eration between government ministries in implementing policies, such as those on soybean. In May, Presidential Regulation 32/2013 gave the national food logistics agency (Badan Urusan Logistik, Bulog) responsibility for stabilising prices and distributing soybean imports. In the August economic policy package, the Min-istry of Finance announced that the quota system would be changed into a price-control system. But a regulation issued by the Minister for Trade on 29 August referred to the quota system and to import licensing for 21 companies, includ-ing Bulog and cooperatives. As a result, these regulations did not help to reduce the price of soybean or increase the availability of imported soybean to produc-ers of tempeh and tofu. On 20 September, the Minister for Trade issued Minis-terial Regulation 45/M-DAG/PER/8/2013, which eliminated import licensing; the Minister of Finance then issued Ministerial Regulation 133/PMK.011/2013, which eliminated the 5% import tax on soybean.
The importation of soybean, while a very important policy issue for many Indonesians, would not immediately attract the attention of most investors in Indonesia. It may therefore be regarded as a relatively minor contributor to inancial-market pressures. Yet it shows that Indonesia has only a limited ability
to carry out even quite minor microeconomic reforms, even though its macro-economic performance remains impressive. This and other examples of poor co-operation are symptomatic of a lack of agreement between ministers and between ministries on central policy initiatives, rather than simply part of the dificulties of managing a large bureaucracy.
FINANCIAL-SECTOR SUPERVISION
Ineffective inancial supervision and regulation are sensitive topics in Indonesia (Grenville 2004). Combined with capital-account liberalisation, which granted inancial institutions new freedoms and changed Indonesia’s business environ -ment, they added to the fragility of Indonesia’s inancial system before and dur -ing the 1997–98 Asian inancial crisis and contributed to the collapse of insolvent institutions. More recently, during the global inancial crisis of 2008, they played their part in the collapse and subsequent bailout of Bank Century, a mid-sized inancial institution. Although this bailout had no signiicant macroeconomic consequences, it led to a drawn-out series of audits, corruption investigations, legal actions and public controversies over its eficacy and the conduct of those associated with it. These investigations have involved, among others, former inance minister Sri Mulyani and former central-bank governor (and now Indone -sia’s vice-president) Boediono, both generally respected as competent economic policymakers.
Regardless of the merits of the Bank Century bailout, the scandal that followed the bank’s collapse seems likely to inluence the actions of Indonesia’s inancial supervisors during any future crisis, by making them less willing to take quick and clear decisions for which they could be held accountable. As Indonesia’s national income grows, so do the responsibilities of the inancial sector in intermediating credit to businesses and individuals and in providing the tools for them to man-age inancial risks. Investors and customers therefore need to have high levels of conidence in Indonesia’s inancial sector, including its regulatory frameworks and crisis-management protocols.
By mid-2013, Indonesia was part-way through its shift to a new institutional system of inancial-sector supervision. To date, the authorities have handled the transition well, but they will need to monitor potential vulnerabilities both during the rest of the move and once the new system has been established. Under the old system, for example, inancial supervision was split between BI and the Capital Markets and Financial Institutions Supervisory Agency (Badan Pengawas Pasar Modal dan Lembaga Keuangan, Bapepam-LK), at the Ministry of Finance. The central bank was responsible for traditional central-banking functions (monetary policy, the payments system and foreign exchange) as well as for supervising and regulating banks. Bapepam-LK oversaw the regulation of capital markets and non-bank inancial institutions. BI was responsible to parliament; Bapepam LK to the Minister for Finance.
The new system will see a new institution, the Financial Services Authority (Otoritas Jasa Keuangan, OJK) oversee capital markets, banks and non-bank inancial institutions alike (McLeod 2011: 27–9). BI will retain responsibility for monetary policy, the payments system and foreign exchange, and will also direct macroprudential regulation. Both the OJK and the central bank will be
ble to parliament. Under the new structure, banks and non-bank inancial insti -tutions will be regulated by the OJK, making the regulatory frameworks more transparent and consistent across Indonesia’s inancial sector.
By the end of 2012, the OJK had taken over the responsibilities of Bapepam-LK – the supervision and regulation of capital markets and non-bank inancial insti -tutions. Banking regulation and supervisory functions will reside with BI until the end of 2013. Although the new framework will help to coordinate the supervisory responsibilities previously held by different institutions, institutions in charge of inancial-system policy, supervision or policy implementation will still need to cooperate. The major institutions falling into this category are the OJK, BI, the Deposit Insurance Corporation (Lembaga Penjamin Simpanan, LPS) and the Min -istry of Finance.
To meet this need for coordination across regulatory institutions, the Financial System Stability Coordination Forum (Forum Koordinasi Stabilitas Sistem Keuan-gan, FKSSK) was established. The FKSSK is chaired by the Minister for Finance and has the governor of the central bank and the chairs of the OJK and the LPS as its members. A meeting of the FKSSK was convened in August 2013, at the height of inancial-market pressure on Indonesia, and, while the minutes of the meeting have not been made public, it is encouraging to see the regulatory authorities using this body to discuss or coordinate their policy responses.
Despite these commendable changes, the new system contains at least ive vul -nerabilities. First, Indonesia’s inancial sector will continue to operate under a fragmented and inconsistent supervisory regime until the OJK has taken respon-sibility for banking supervision. Second, the decisions of the FKSSK and of the executive management of the OJK are made by consensus – there is no formal way of breaking a deadlock. A lack of individual accountability in decision-making may lead to organisational paralysis.
Third, the macroprudential functions that will remain with BI when the new system is in place are, as yet, poorly deined, and may obscure the accountabilities of the OJK and the central bank. It is dificult to tell the difference between macro -prudential and micro-prudential tools – in many cases they will be the same, with the scope of application deining the boundaries. This uncertainty could cause conlict between the OJK and the central bank over their separate policy responsi -bilities. Fourth, and on a related point, the establishment of prudential regulation functions outside the central bank may lead to systemic risks being overlooked or underestimated. This may have contributed to the poor supervisory performance of the UK’s Financial Services Authority during the global inancial crisis (FSA 2009: 84).
Fifth, there is a risk that the prudential regulation function can appear less pressing in good economic times (FSA 2009: 92). Assigning one regulator to supervise both capital markets and inancial institutions will require discipline, to ensure that adequate, specialised resources are allocated to the prudential regula-tion funcregula-tion throughout the economic cycle, rather than having them drawn to other parts of the organisation in the good times.
The full transition to the new system is set to be completed by the end of this year, with responsibility for bank supervision shifting from BI to the OJK. Indo-nesian authorities seem alert to the vulnerabilities of both the new system and the transition phase, but they will need to remain vigilant to possible points of tension.
MINERAL TAXATION AND REGULATION
The Indonesian economy’s reliance on the mining and energy sector (at present over 10% of GDP comes from mining, and there is additional manufacturing activity from reining) means that the budget is sensitive to developments in the sector. This has been a point of pressure for the budget, given the fall in the prices of many commodities over the past year – particularly of thermal coal, of which Indonesia is a major producer and exporter. It is therefore important that regula-tory and taxation settings for the mining and energy sector support an optimal level of mineral exploration, investment and production.
Indonesia’s regulatory and revenue settings for its mining sector have changed considerably since Law 4/2009 on Mineral and Coal Mining came into effect (Gandataruna and Haymon 2011). Combined, they have undermined new invest-ment in the sector and reduced the prospect of economic growth. This transition from pre-2009 to post-2009 systems has resulted in parallel revenue regimes, as the government has gradually renegotiated existing contracts of work with pri-vate companies to align them with the new iscal regime. The export-duty exemp -tion for coal exports has, fortunately, reduced the overall shock to the economy.
Indonesia’s approach to raising revenue from the extraction of minerals has a structure broadly similar to that of other countries, but its export duty is an unu-sual additional charge on production. In common with many countries, Indonesia has a revenue regime in place to capture resource rents (Fane 2012), but its array of instruments is insuficent.
Indonesia has placed stronger restrictions on the export of raw materials. It has imposed export duties to ensure that it collects some revenue from mineral extraction, and it has stipulated that raw materials must be processed domesti-cally from 2014 (Burke and Resosudarmo 2012: 307–8). These moves are already affecting Indonesia’s major commodities, particularly nickel laterite and bauxite, the processing and smelting of which are capital-intensive and need reliable and affordable access to electricity and water.
Investors in Indonesia (both domestic and foreign) have often chosen to export raw commodities, because other countries already have well-developed process-ing capabilities. In the longer term, the ‘irst best’ policy would be to sell exports to those best able to process them, and to those willing to pay the highest price, with arrangements in place to distribute revenue appropriately. Indonesia’s export restrictions aim to help its economy rely less on raw commodity exports. But such interventions come with substantial risks: the industry may respond to the incentives differently from the policy intention – for example, by using cheaper technologies that are less energy eficient and more polluting to meet pro -cessing requirements. In sheltering the domestic industry from the pressures of international competition, these restrictions may work against Indonesia’s wider trade objectives. They may also distort the economy; the coal sector is exempt from the export duty, so it will beneit over time relative to other sectors. Last, the government has imposed these restrictions without regard to previous royalties and other taxes, in effect penalising many companies.
The government has also indicated a willingness to re-regulate parts the indus-try, such as tin mining (box 2). It has sought reduce the share of foreign owner-ship in Indonesian mining assets, forcing foreign investors with mining business licences (Izin Usaha Pertambangan) and special mining business licences (Izin Usaha Pertambangan Khusus) to divest their stakes in Indonesian mines. Yet, at
Indonesia is the world’s largest tin exporter and second-largest tin producer, sup-plying more than one-third of the world’s tin. Most exported tin has long been pro-cessed outside Indonesia, and Indonesian tin miners have depended on tin prices that are set in international markets, particularly the London Metal Exchange (LME). In recent years, the Indonesian government has sought ways to increase domestic value-adding and reduce its dependence on the LME, by re-regulating the industry. Illegal tin mining was the main reason for its stipulation of 2002 that tin has to be exported by licensed traders, although tin-ore exports remained unrestricted (Jakarta Post, 2/2/2002). In 2007, the government also speciied that exported tin bars and tin sand must contain a minimum of 99.85% tin, owing, it said, to the need to curb the environmental damage caused by unauthorised tin mining (Jakarta Post, 30/6/2007).
In the face of substantial tin-price luctuations on the LME since 2004 – such as the spot price rising from $6,173 per tonne in November 2005 to $23,853 per tonne in May 2008 – 24 Indonesian tin producers organised a local exchange, the Indonesia Tin Market (INATIN), with the aim of mitigating speculation by traders and brokers outside Indonesia. When the price per tonne subsequently fell, owing to the GFC, to a low in March 2009, Indonesian producers decided to stop exporting until the price was back to $23,000 per tonne. With global prices peaking once more in April 2011, at $32,347 per tonne, before luctuating again, the Indonesia Commodity and Deriva -tives Exchange (ICDX) began to trade tin futures in December 2011, in an effort to set a global reference price and stabilise prices. In the face of sustained volatility, Gita Wirjawan, the Minister of Trade, decreed a year later that from 1 July 2013 reined tin exports must have a minimum purity of 99.9% and that tin exports had to be brought within the ministry’s export-licensing system. Exporters are now required to pay a 3% royalty, and the purity of their exports must be independently veriied prior to shipment. This regulation disadvantaged the small smelters on Bangka and Belitung islands, because only smelters owned by the companies PT Timah and PT Koba Tin were able to meet the requirements (Australian, 24/1/2013).
In June 2013, the Minister of Trade revised his decree to stipulate that all tin pro-duced in Indonesia had to be traded at the ICDX, in Jakarta (Jakarta Post, 13/7/2013). The ICDX was to replace INATIN, which had failed to attract buyers in 2012. The aim of the decree was to reduce dependence on price-setting for Indonesian tin on the LME. The requirement for all exporters and buyers of Indonesian tin to be reg -istered with the ICDX caused commotion in international tin markets, because only two Indonesian tin producers were registered as ICDX members: PT Timah and PT Reined Bangka Tin. Other sellers who were not members could sign sales agree -ments with members, but this new regulation disrupted Indonesian tin producers at a time when they were struggling to comply with the purity requirement. PT Timah, which depends on supplies from smaller miners, was forced to halt all tin shipments in September 2013 and had to declare force majeure to 19 buyers holding long-term contracts, because most of them were not yet registered on the ICDX. (International Tin Research Institute, 5/9/2013) In addition, 30 smaller smelters stopped shipments because of a delay in regulatory approval to start trading on the ICDX (Jakarta Post, 7/9/2013). Under these circumstances, Indonesia’s tin exports fell. Although the vol-ume of tin traded in the ICDX has since recovered, major international traders are reluctant to use the ICDX.
The changes in tin-trading regulations were meant to stabilise and then increase tin prices for Indonesia. Instead, they created instability in both domestic and inter-national tin markets and constrained Indonesia’s export revenues. They have yet to achieve higher prices.
the same time as it is promoting domestic ownership in the mining sector, the government has also introduced measures to attract foreign investment, such as affording tax holidays to investors in certain sectors.
Most foreign investors do not support the new divestment rules. Investment in the mineral sector is often a long-term proposition, so companies may not want to be involved in a project over which they will have little control in the future. Older projects are likely to be less affected, since many have already made their large investment decisions and recovered their development and construction costs.
All countries implement some form of control over the foreign ownership of domestic assets. Often this is to reassure a citizenry that sees foreign interest as exploiting its endowed resources. Yet many economies (including Indonesia) need to attract foreign capital and expertise, otherwise investments will have to be funded at a higher cost, or not at all. Restrictions on foreign control and trade need to be implemented carefully, in a way that balances domestic concerns with the beneits of foreign investment.
Indonesia’s recent steps to gain greater control over its mineral assets (and other sectors of the economy) are likely to be counter-productive. They are unrea-sonably weighted towards protecting domestic interests; they also encourage unwanted investment transactions, which can only make Indonesia’s capital mar-kets less eficient. In addition, they send a very negative message on risk-taking: foreign investors will be able explore and develop mines (and, by extension, incur losses should any deposits not be worth extracting), but they will not be able to capture the rewards should the mines succeed.
REFERENCES
BI (Bank Indonesia) (2013a) Press Release No. 15/21/DKom, 15 August.
BI (Bank Indonesia) (2013b) Indonesian Financial Statistics, BI, Jakarta, available at <http:// www.bi.go.id/web/en/Statistik>.
BI (Bank Indonesia) (2013c) Press Release No. 15/30/DKom, 12 September.
BKPM (Badan Koordinasi Penanaman Modal, Investment Coordinating Board) (2013a) ‘Realisasi penanaman modal PMDN: PMA triwulan III dan Januari–September tahun 2013’ [Domestic and foreign direct investment realisation in quarter III and January–September 2013], available at <http://www.bkpm.go.id/contents/news_ detail/153601/bkpm-investment-realization-in-iii-quarter-of-2013>.
BKPM (Badan Koordinasi Penanaman Modal, Investment Coordinating Board) (2013b) ‘Perkembangan Realisasi Investasi PMA Berdasarkan Sektor 2013-2’ [Realisation of foreign direct investment by sector 2013-2], available at <http://www5.bkpm.go.id/ contents/p16/statistics/17>.
Boyd, M., Devero, A., Frias, J., Meyer, J. and Ross, G. (2010) ‘A note on policies for the oil and gas sector’, Bulletin of Indonesian Economic Studies 46 (2): 237–48.
Burke, P.J and Resosudarmo, B.P. (2012) ‘Survey of recent developments’, Bulletin of Indone-sian Economic Studies 48 (3): 299–324.
Cornwell, K. and Anas, T. (2013) ‘Survey of recent developments’, Bulletin of Indonesian Economic Studies 49 (1): 7–33.
Cubillos, N. and Sandee, H. (2013) ‘Trade development: tackling import container dwell time in Tanjung Priok’, in Technical Notes, World Bank, Jakarta, June.
Fane, G. (2012) ‘Allocating and taxing rights to state-owned minerals’, Bulletin of Indonesian Economic Studies (48) 2: 173–89.
Fealy, G. (2011) ‘Indonesian politics in 2011: democratic regression and Yudhoyono’s regal incumbency’, Bulletin of Indonesian Economic Studies 47 (3): 333–53.
FSA (Financial Services Authority) (2009) The Turner Review: A Regulatory Response to the Global Banking Crisis, FSA, London, March.
Gandataruna, K. and Haymon, K. (2011) ‘A dream denied? Mining legislation and the con-stitution in Indonesia’, Bulletin of Indonesian Economic Studies 47 (2): 221–31.
Grenville, S. (2004) ‘What sort of inancial sector should Indonesia have?’, Bulletin of Indo-nesian Economic Studies 40 (3): 307–27.
IMF (International Monetary Fund) (2013) World Economic Outlook, IMF, Washington DC, 8 October.
Lesher, M. (2012), ‘The OECD regulatory reform review of Indonesia: market openness’, OECD Trade Policy Papers No. 138, OECD Publishing, available at <http://dx.doi. org/10.1787/5k97785rddxv-en>.
Lindblad, J.T. and Thee, K.W. (2007) ‘Survey of recent developments’, Bulletin of Indonesian Economic Studies 43 (1): 7–33.
McLeod, R.H. (2011) ‘Survey of recent developments’, Bulletin of Indonesian Economic Stud-ies 47 (1): 7–34.
McRae, D. (2013) ‘Indonesian politics in 2013: the emergence of new leadership?’ Bulletin of Indonesian Economic Studies 49 (3): 289–304.
Nehru, V. (2013) ‘Survey of recent developments’, Bulletin of Indonesian Economic Studies 49 (2): 139–66.
OECD (Organisation for Economic Co-operation and Development) (2012) OECD Reviews of Regulatory Reform: Indonesia 2012: Strengthening Co-ordination and Connecting Markets, OECD Publishing.
Olivia, S. and Gibson, J. (2008) ‘Household energy demand and the equity and eficiency: aspects of subsidy reform in Indonesia’, Energy Journal 29 (1): 21–39.
Simmonds, A. and Hort, K. (2013) ‘Institutional analysis of Indonesia’s proposed road map to universal health coverage’, The Nossal Institute for Global Health Working Paper No. 33, University of Melbourne, Melbourne.
SKK Migas (2013) ‘Oil and gas revenue exceeds the 2013 revised state budget target, oil production manages to achieve 99%’, Press release, 31 July.
Van der Eng, P. (2005) ‘Indonesia’s new national accounts’, Bulletin of Indonesian Economic Studies 41 (2): 253–62.
Van der Eng, P. (2009) ‘Capital formation and capital stock in Indonesia, 1950–2008’, Bul-letin of Indonesian Economic Studies 45 (3): 345–71.