Early tectonic dewatering and brecciation on the overturned
sequence at Marble Bar, Pilbara Craton, Western Australia:
dome-related or not?
N.H.S. Oliver
a,*, P.A. Cawood
baEconomic Geology Research Unit,School of Earth Sciences,James Cook Uni
6ersity,Towns6ille,Qld4811,Australia bTectonics Special Research Centre,School of Applied Geology,Curtin Uni
6ersity,GPO Box U1987,Perth,WA 6001,Australia Received 8 June 1999; accepted 22 June 2000
Abstract
Cataclastic breccias and hydrothermal fault arrays of likely c. 3400 Ma timing are well developed and exceptionally well exposed in the Marble Bar Chert Member of the Pilbara Craton. Brecciation involved centimetre- to metre-scale clast transport distances, in breccia zones up to 5 m wide, cutting the c. 60 m thick chert in a series of right-lateral fault zones. Our observations of downward facing pillow basalts, the geometry of the breccias, and oxygen isotope data for rocks and the breccia matrix suggest the rocks were at least steeply overturned on this flank of the Mt Edgar Dome prior to brecciation. The breccias are inferred to represent steep conjugate fault zones developed by local transtension. The history of overturning and brecciation predates the formation of dome-related regional foliation and metamorphism, and therefore occurred between 3460 and 3320 Ma, the established ages for deposition of the underlying Duffer Formation and intrusion of the Mt Edgar Batholith respectively. Local overturning of the Marble Bar sequence prior to both brecciation. and the main phase of dome formation suggests a protracted deformation history for this segment of the Pilbara Craton. The transtensional movement along the breccias may be representative of strain accommodation accompanying an early doming phase, or could be a deformation event that developed independently of doming. Fluids involved in brecciation were most likely formation waters expelled from the cherts and basalts in response to overpressuring induced by the overturning and progressive burial. © 2001 Elsevier Science B.V. All rights reserved.
Keywords:Archean; dome; Polydeformation; Fuid; Chert; Basalt
www.elsevier.com/locate/precamres
1. Introduction
Spectacular exposures of cataclastic breccia are preserved in the chert at the famous ‘‘Marble Bar’’ in the Pilbara Craton. The Marble Bar is a
* Corresponding author.
N.H.S.Oli6er,P.A.Cawood/Precambrian Research105 (2001) 1 – 15 2
misnomer from early pioneering days, actually being a 50 – 70 m thick outcrop of banded chert, around which the Coongan River has created a series of permanent waterholes, and after which the nearby town of Marble Bar was named. This paper documents the breccias exposed at the Mar-ble Bar, which record a complicated history of overturning, cataclasis and faulting, prior to the development of regional tectonic fabrics associ-ated with doming and greenstone metamorphism. Not only is the Marble Bar one of the world’s oldest breccia systems, brecciation occurs in finely bedded cherts, allowing approximation of clast movement and fragmentation paths, and an esti-mate of the overall flow direction (of matrix and clasts) within the breccias. One of the aims of this paper is to document the spectacular brecciation and speculate on brecciation processes. Secondly, the relationship of the bedded chert, the siliceous breccia, and adjacent, overturned pillow basalts, allows the reconstruction of the history of defor-mation and tectonic dewatering of the cherts, which represent part of the earliest history of
deformation exposed in the Pilbara Block.
Polyphase doming in the Pilbara has been recog-nised by previous authors (e.g. Hickman, 1983 Collins, 1989); others have identified areas with early normal faulting then thrust stacking (van Haaften and White, 1998), and possible nappe-style tectonics (Bickle et al., 1985). This paper also aims to contribute to understanding some of the details of deformation features that predate the main phase of doming around the Mt Edgar Batholith, to attempt to clarify some of the issues remaining with the protracted, early Archean de-formation history.
2. Pilbara geology
The Pilbara Craton consists of a series of early to mid-Archean granite domes enveloped by inter-vening greenstone belts, all unconformably over-lain by late Archean to Paleoproterozoic strata of the Hamersley Basin (Hickman, 1983). The Mar-ble Bar Chert Member lies with the dominantly volcanic Warrawoona Group greenstone sequence on the western flank of the domal Mt Edgar Batholith (Fig. 1, Hickman and Lipple, 1978). The group is divisible into the lower Talga Talga and upper Salgash subgroups separated by the Duffer Formation. In the Marble Bar region the group youngs to the west, lying on the east limb of the Warrawoona Syncline. The Marble Bar Chert Member occurs within the Towers Forma-tion at the base of the Salgash subgroup. It accumulated at around 3460 Ma, based on U/Pb zircon dates of between 347195 and 346392 Ma for the Duffer Formation and 345891.9 Ma for the Panorama Formation of the Salgash sub-group (McNaughton et al., 1993; Thorpe et al., 1992). Regional deformation and metamorphism are constrained to between 3320 and 3310 Ma, based on the age of pre-, syn-, and post-kinematic phases of the batholith (Williams and Collins, 1990; Collins and Van Kranendonk, 1999).
Direct dating of the Marble Bar Cherts was attempted by Minami et al. (1995) who recorded Sm/Nd ages of 32009300 Ma for red (or black) and white banded cherts and 25009200 Ma for yellow-grey cherts associated with quartz veins.
Fig. 2. Simplified map of the ‘‘Marble Bar’’, approximately to scale, showing local stratigraphy, locations of key maps and sections, sample locations, and distribution of major breccia zones.
tional fluids from hydrothermal solutions, possi-bly with a depleted or chondritic mantle source (Sugitani, 1992 Minami et al., 1995).
3. Geology of the Marble Bar
The sequence of the Duffer Formation and the lower Salgash subgroup rocks exposed over 100 m scales around the Marble Bar includes tuffs and agglomerates, massive to pillow basalts, and well bedded red, grey and white cherts. The Marble Bar is a 50- to 80-m thick sequence of beautifully bedded cherts, surrounded on both sides by ap-proximately conformable basalts (Fig. 2), meta-morphosed to lower greenschist facies (Hickman and Lipple, 1978 Collins and Van Kranendonk, 1999). Broader stratigraphic relations suggest a mainly upward-facing, simple stratigraphy in the eastern Pilbara (e.g. Hickman, 1983; Collins and Van Kranendonk, 1999); however, Bickle et al. (1985) have controversially proposed pre-dome overturning by nappes and thrusts in parts of the district, and van Haaften and White (1998) docu-ment pre-dome normal faults and thrust stacking in an area approximately 15 km northeast of this study. At the Marble Bar, pillow basalts with incontrovertible younging indicators show that this sequence is moderately to steeply overturned, for at least 500 m across strike in the Marble Bar area; however, the younging directions are consis-tently to the southwest for the several kilometres of exposure outwards from the Mt Edgar Batholith (Hickman and Lipple, 1978; Hickman, 1983; Collins and Van Kranendonk, 1999), in-cluding this small study area.
3.1. Basalts
The lowest exposed rocks are basalts and their derivatives of the upper Duffer Formation, found at Chinaman’s Pool, approximately 500 m north of the Marble Bar (3). They consist of andesitic to dacitic conglomerate and/or agglomerate, very immature volcanic-derived greywacke with inter-calated cherty layers, and basalts. Chert layers here are devoid of breccias at high angles to bedding, unlike the Marble Bar, but are distended These ages contain a large error and at least the
younger age probably relates to post-doming hy-drothermal disturbance of the sequence. The older age is within error of the 3460 Ma depositional ages of enclosing sequences (Thorpe et al., 1992; McNaughton et al., 1993), but is also within error of the 3320 Ma age of doming associated with the Mt Edgar Batholith (Williams and Collins, 1990). The geochemical data for the cherts along
with initial o-Nd values of +1.0 suggest
derivation of depositional and/or
N.H.S.Oli6er,P.A.Cawood/Precambrian Research105 (2001) 1 – 15 4
and cut by asymmetric boudinage structures and shear zones with green fuchsite alteration of the enclosing metabasalts (Fig. 3). These shear zones and foliation subparallel to bedding are inferred to represent the main ductile deformation phase recorded in the Marble Bar Belt and adjacent Warrawoona Syncline. Notwithstanding ongoing controversy on the role of the batholiths in the deformation history of the province, this fabric most likely developed during the main phase of doming associated with the Mt Edgar Batholith to the east.
Higher in the sequence in the Towers Formation, on the immediate northeastern side of the Marble Bar Chert Member, basalts are locally altered and foliated (4a), showing moderately well developed near-vertical foliation that strikes subparallel to the bedding (but dips differently, see below) in the
adjacent cherts. The contact is parallel with the bedding in the chert, and is inferred to be con-formable. Alteration is most intense in the basalt adjacent to the Marble Bar Chert Member, and involves the production of epidote – white mica – sil-ica alteration replacing pyroxene and feldspar (green alteration and clasts), in a black, siliceous matrix. These breccias extend out from the adjacent chert (Fig. 2). The foliation in the basalt anasta-moses around the altered basalt clasts, suggesting that foliation development postdated both the alteration and the brecciation that affected these basalts. We correlate the foliation with the region-ally developed S1of Collins and Van Kranendonk
(1999) on the basis of orientation and lack of complex foliation overprinting in the lower grade parts of the greenstone belts.
In contrast, pillow basalts from the Apex Basalt
(Salgash subgroup) on the southwestern side of the Marble Bar Chert Member show little evi-dence of deformation (4 b,c). Pillow shapes and facing structures are well displayed, there is good preservation of vesicles, amygdules and interpil-low material with distributions consistent with quenching and pillow formation in seawater, sub-variolitic sprays of plagioclase (now partly altered to sericite) suggest rapid quenching, and epidote – sericite alteration occurs in concentric patterns suggestive of seafloor alteration as the pillows cooled. It is difficult to assess the degree of subse-quent low-grade metamorphism because of the high degree of textural preservation (inhibiting correlation with structural fabrics) and develop-ment of hydrothermal alteration assemblages prior to the regional metamorphism. The contact with the underlying, overturned chert is parallel or subparallel to bedding in the chert, and there may have been some slip along the contact dur-ing deformation (see below).
Pillow cusps in the basalt indicate younging to the southwest, so the bedding in the cherts is overturned (Fig. 2). The greenstone sequence thus youngs westwards, away from the granite core to the northeast (Fig. 1), as has been observed by other workers (e.g. Hickman, 1983). However, the overturning is inconsistent with the regional proposal of Collins and Van Kranendonk (1999) that the greenstone sequences around the domes
arein6ariablyright way up (see below).
3.2. Marble Bar Chert Member
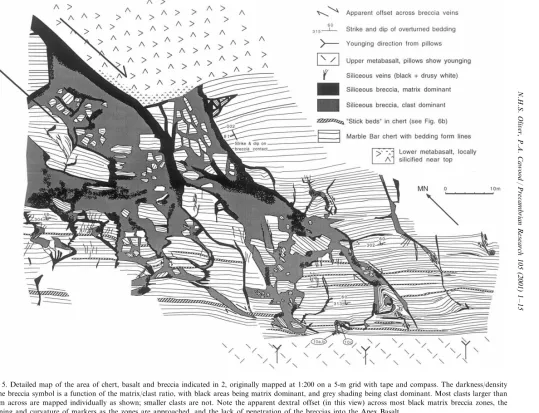
On both banks of the bar, exposure is approxi-mately 90% in the chert, with several three-di-mensional in situ blocks of rock elevated above the main water-worn platform, and irregular sub-vertical walls stepping up to 3 m high adjacent to the main river bed. The chert is dominated by centimetre-scale beds of interlayered red, grey, white and rare black finely crystalline silica, with overturned bedding dipping 45 – 70° to the north-east (Fig. 5). Colouration is due to differing amounts of very fine-grained iron oxide impuri-ties, with some subtle grainsize variations visible microscopically. Individual beds are continuous for up to 10 m or more along the strike (Fig. 5),
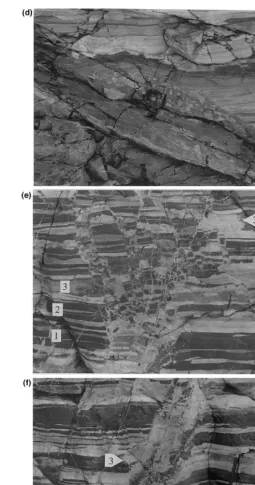
and at scales broader than this they are invari-ably cut by high-angle faults or breccia zones. In addition, some layers are affected by crosscutting patchy alteration, which normally takes the form of discolouration to grey or white fine-grained silica, from the original darker greys or reds (6a). Marker beds (at 1:200 scale) within the chert are dominated by ‘‘stick beds’’ (slump breccias of Hickman and Lipple, 1978; Hickman, 1983). These beds have conformable, parallel boundaries with adjacent beds, but internally are marked by the random distribution of red and grey bedding fragments in a paler matrix (6b), or by rare intra-layer angular folds and fold breccia. Because these textures are completely layer confined, they are inferred to be diagenetic structures formed by the compaction of partly consolidated silica gel under modest burial loads. Three or four of these beds can be traced across parts of the outcrops and provide the best evidence for the apparent movement sense on the faults and breccias. von Rad and Ro¨sch (1974) have shown that the con-version of siliceous ooze to quartz chert in
Meso-zoic and Cenozoic seafloor sediments is a
multistage process, requiring maturation over tens of millions of years (see Section 5.1). We suggest that the ‘‘stick beds’’ represent one of the intermediate lithification stages, whereby lithified chert was compacted until the recently lithified material collapsed and was then re-cemented by more siliceous ooze (see also Hickman, 1983). All subsequent discussion of breccias herein refers to the later, predominantly bedding-transgressive structures, except where specified in the final dis-cussion.
4. Marble Bar breccias
The cherts are cut by two main types of fault and breccia material, predominantly at high an-gles to the bedding (Fig. 5):
N
.
H
.
S
.
Oli
6
er
,
P
.
A
.
Cawood
/
Precambrian
Research
105
(2001)
1
–
15
6
N.H.S.Oli6er,P.A.Cawood/Precambrian Research105 (2001) 1 – 15 8
Fig. 6. (Continued)
spaced fracture cleavage, and breccia sheets with parallel to subparallel walls, with a white,
4.1. Black matrix breccias
Breccias with very angular banded chert clasts in a dark matrix dominate the map expression of deformation in the chert (Fig. 5). Detailed map-ping shows that they are commonly, but not always, associated with apparent right-lateral off-sets that have distended the overall outcrop (Fig. 5).
The matrix of the breccia varies from black to very dark grey in the central and northern part of the outcrops, to greener in the south, within a few metres of the (overturned) pillow basalt outcrop. These breccias also extend northwards into the overlying, overturned basalts, with green, sericite – epidote altered basalt clasts in the black matrix. In several locations, the breccia extends continuously across the chert/basalt boundary, with little visible change in matrix composition, but with a change in clasts from chert to basalt. On the southern contact, altered fragments of basalt in breccia extend a maximum of 1.5 m from the basalt contact into the chert, but the matrix changes colour from green (just on the basalt side of the contact) to green-grey to dark grey over approxi-mately 2 m (location 10, Fig. 2). The brecciation thus did not involve large distances of clast trans-port, although the internal and external geometry of clasts indicates that there was some movement, and rotation, of clasts as they left their walls behind (6c). Movement of the clasts is inconsis-tent, some moving ‘‘up’’ (north), some ‘‘down’’, and some laterally (with rotation), relative to the well defined bedding in the wallrocks. However, individual breccia sheets branch out towards the north, generally thicken in the same direction, and extend into the northern basalts, and not into the overturned ones in the south (Figs. 2 and 5). This suggests gross mass transport towards the north, at least of the matrix material.
Internally, the matrix consists of very fine-grained quartz with a weak alignment of opaque minerals, the alignment being subparallel to the breccia walls. The fine-grained, milled appearance of the matrix, together with the presence of ghost-altered clasts within, and on the margins of, the zones suggests the breccia matrix is a fault catacl-asite which is dominated by altered rock fragments
and milled chert rock. This interpretation is sup-ported by the presence of zircon in the matrix which was detected by a preliminary ion probe accelerator – mass spectrometer examination using the CSIRO AUSTRALIS instrument (B. Hobbs, personal communication, 1998), as zircon is un-likely to have precipitated from a hydrothermal fluid at the low-temperature greenschist facies con-ditions which these rocks experienced. Sugitani (1992) has also documented that grey (black) cherts containing banded red and white chert blocks at the Marble Bar are depleted in FeO and generally contain more Al203, Ti02and Zr than the
blocks, indicative of a dominant altered rock com-ponent within the matrix. Enrichment in these ‘‘immobile’’ elements is also indicative of volume loss in the matrix material associated with the removal of more mobile components (e.g. Fe, Si) in solution. This data also supports the inference that the black matrix material is milled, altered rock, rather than being dominated by silica precip-itated from solution as fracture infilling. However, evidence of at least some additional quartz precip-itation from solution is indicated from thin, dif-fuse-bounded veinlets of quartz within the black matrix, but this is inferred to be subordinate in volume to a cataclastically milled chert matrix.
Most apparent offsets across the black matrix breccias are apparently right lateral, but the spe-cific movement vector is only poorly constrained by one observation of gently southerly plunging slickenfibres. A full fault solution was not possible due to the presence of only one planar marker orientation (bedding) in the chert. However, the thinning and slight curvature of the chert observed in plan view near the largest breccia sheets (Figs. 2 and 5) imply that the predominant slip vector was subhorizontal relative to the present
geome-try, with the slip vector approximately
N.H.S.Oli6er,P.A.Cawood/Precambrian Research105 (2001) 1 – 15 10
systematic increase in displacement as the veins widen (Fig. 5). The presence of folds in the south-ern part of the outcrop (Fig. 5) is inconsistent with the overall inferred shear sense for the brec-cias. These may be early, compaction related folds off which breccia veins have nucleated, or they may also be representative of a complex rota-tional strain history during brecciation.
4.2. White quartz 6ein arrays and related breccias
Quartz veins with both dextral and sinistral offsets developed synchronously and later than the black matrix breccias, as indicated by local overprinting relationships. Locally, the white veins form marginal zones adjacent to the black matrix breccia (6b). The veins characteristically form in swarms, with either a few or many mil-limetre- to centimetre-scale veins forming distinc-tive and spectacular fault zones (6e,f). The strike of the vein arrays is typically more orthogonal to bedding than for the black matrix breccias. Vein arrays may form horst-and-graben structures, or have sinsitral or dextral offset, but, on average, they are dominated by sinistral offsets. The inter-nal texture of the drusy to blocky quartz infill, with highly abundant growth zones and primary fluid inclusion arrays, contrasts with the fine-grained, cataclastic nature of the black matrix breccias. The preferential sinistral offsets and an-gles with the black matrix breccias could represent a conjugate relationship. More likely, they may have developed slightly later than the black ma-trix breccias under different fluid pressure and stress conditions (see below). They appear to ac-commodate bulk extensional strain parallel to the bedding, and are formed by infilling of fractures with a substantial tensional component.
5. Oxygen isotope data for rocks and breccias
Small samples were collected from the Marble Bar reserve for a limited oxygen isotope survey of rocks, veins and breccias. Oxygen isotope ratios were measured at Monash University, following Clayton and Mayeda (1963), using ClF3 as the
oxidising reagant. Extracted gases were analysed
as CO2on a Finnigan Mat 252 mass spectrometer
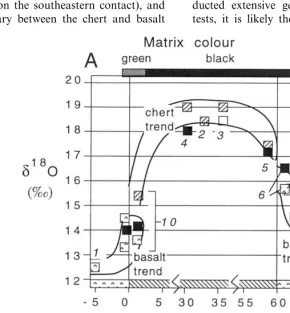
and are expressed relative to V-SMOW, with a laboratory precision of 90.2‰, determined by reference to in-house and international standards. The results are shown in Fig. 7. The most pristine basalt sample is a dark green pillow meta-basalt, sampled from the interior of one of the pillows. The d18O
(SMOW)of 12.5‰ is too high for
unaltered metabasalt (typically 6‰), and most likely reflects a component of low-temperature seafloor alteration (e.g. Gregory and Taylor, 1981), as suggested by the abundant presence of chlorite, epidote and white mica replacing pri-mary pyroxene and plagioclase. Least affected chert returns values of 19‰, not atypical of Pre-cambrian cherts (Knauth and Epstein, 1976). Basalt d180 values greater than 12.5‰ are found
in:
1. a very restricted zone B20 cm from the south-eastern basalt contact,
2. altered basalt clasts transported a maximum of 1.5 m into the chert at the same contact, and 3. a broader zone of up to 5 m of silicification in basalts on the northeastern contact with the chert.
These zones of elevated basalt isotope ratios correlate well with a distinctive yellowish pale-green colour, developed in basalt clasts adjacent to both contacts but most prominent in the north-eastern basalt where the surrounding black brec-cia matrix extends up to 5 m into the basalt.
Chert values less than 19‰ are found in clasts immediately surrounded by black matrix breccia, but away from the breccias they retain these elevated values. The value of the chert clasts and the matrix is also a function of the distance from the two basalt contacts (Fig. 7). There is a corre-lation between matrix colour and oxygen isotope ratio, with a distinctive greenish colour present in the matrix on the southern boundary, and dark grey to black in both matrixes in the main Marble Bar Chert, as well as in the breccia that extends into the basalts on the northeastern contact.
enrich-ment is most extensive on the northeastern side, where silicification and brecciation is most in-tense. The most depleted chert value of 15.4‰ comes from 1.5 m above the southwestern basalt from a breccia clast surrounded by a yellow-green matrix.
5.1. Discussion
On a gross scale, the correlation between the breccia matrix and the clast oxygen isotope ratios suggests that brecciation was largely in situ. This is supported by the observation that the maxi-mum distance of basalt clast transport into the chert is 1.5 m (on the southeastern contact), and that the boundary between the chert and basalt
along the northeastern contact is fairly sharp, irrespective of the presence of brecciation (Figs. 4a and 5). In detail, however, the geometric asym-metry of the black matrix breccias and the stable isotope data are inferred to represent a net flux of material (silica, water, oxygen) towards the north, relative to the present disposition of the outcrops. Given the younging direction, the northerly diver-gent nature of the breccias, and the extension into the northeastern basalts, it is likely that the se-quence was already overturned during breccia formation (Fig. 8). Fluid overpressuring may have developed because of this overturning and then formed the breccias. Although we have not con-ducted extensive geochemical or fluid inclusion tests, it is likely they were deep basinal or even
Fig. 7. Oxygen isotope ratios for basalt, chert, and matrix from the sample locations indicated in Fig. 2, projected along the line A – B, also in 2. The samples shown in Fig. 2 and labelled here in italics are against the points. Note the enrichment in18O of the
N.H.S.Oli6er,P.A.Cawood/Precambrian Research105 (2001) 1 – 15 12
Fig. 8. Sketch of the overall structural and stratigraphic rela-tions indicating rocks were overturned prior to the develop-ment of a foliation in the metabasalts. An antiformal anticline would have older rocks in the core (in this case to the SW). Because these rocks young to the southeast, the present struc-ture indicates an antiformal syncline to the southwest, which requires that at least one deformation event (that overturned the sequence) predates the formation of the upright foliation.
may have developed at higher fluid pressures and lower differential stresses (9b), consistent with progression from shear failure mode towards more tensile failure mode, and with an increase in fluid flux with time.
6. Timing and origin of brecciation
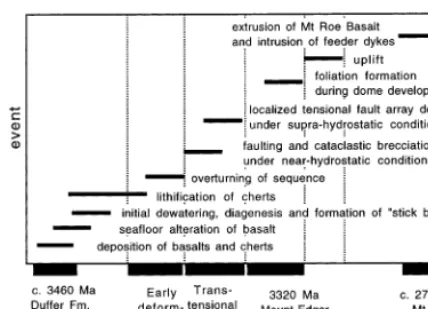
A relative history of basin evolution and defor-mation based on observations and data from the Marble Bar region integrated with regional geochronology is outlined in Fig. 10. Initial
depo-Fig. 9. (a) Mohr circle representation of the inferred stress history during the development of black matrix breccias and white veins and breccia veins. Black matrix breccias are in-ferred to have developed by shear failure at moderately high values of differential stress and moderate fluid pressure, whereas the later white quartz veins formed in extensional shear mode at inferred lower differential stresses and higher fluid pressure, thus explaining the higher crystallinity of the quartz and the local vughs associated with these veins. (b) Schematic plan showing the generalized orientation of the two breccia/vein types during transtensional shearing. Using the Mohr circle analysis, the sequence and orientations of veining are consistent with no change in the orientation of the shallow, NE – SW-directed s
1 that produced the two vein types, but
with a change in inferred differential stress magnitudes and fluid pressures. This change may have developed by increased burial and/or fluid overpressuring during the overall transten-sional shear event that produced the breccias and veins, or by coupling of the predominant shear along the black matrix breccias with the tension along the white breccia/veins (see main text for discussion).
Fig. 10. Schematic time – event plot showing how the events determined at the Marble Bar are inferred to relate to regional events during the evolution of the eastern Pilbara. Several deformation phases or events are required prior to the main dome formation to explain the sequence.
mately 3460 Ma is a maximum (and probable overestimate) for the timing of lithification, and hence, of overturning and then brecciation. If processes of lithification in the present seafloor are a guide to rates of lithification in the Ar-chaean, then the results of von Rad and Ro¨sch (1974) would suggest complete lithification may not have finished until at least 3400 Ma. This would place both overturning and brecciation into a time window of 3400 – 3320 Ma, the latter being the age of intrusion and doming of the Mt Edgar Batholith.
A single predominantly ductile dome-forming event could not have produced the sequence of overturning, transtensional faulting, and regional deformation and metamorphism. Our data re-quire at least a protracted history of deformation and doming. The steep foliation in basalts adja-cent to the Marble Bar Chert overprints silicifica-tion, strikes at a high angle to all of the fracture-related fabrics in the chert, and transects the overturned basalt/chert boundary at the wrong angle, and with the wrong vergence sense (Fig. 8). This indicates that the Marble Bar se-quence records a deformation history prior to the D1dome forming event of Collins (1989), and this
deformation involved overturning of the sequence followed by transtensional faulting. The breccia-tion is unrelated to widespread post-doming con-jugate shears seen on regional maps.
Folding and faulting either predating doming or occurring during the initial stages of doming have been described by a number of workers. Zegers et al. (1996) record syn-sedimentary listric faulting and block rotation during accumulation of the Duffer Formation on the east flank of the Shaw Batholith which they related to extension off the flanks of the rising granitic dome. Bickle et al. (1980) and Bickle et al. (1985) describe recum-bant folding and associated ENE thrusting west of the Shaw Batholith. Thrusting postdates the South Daltons Pluton dated by U/Pb zircon at 343194 Ma (McNaughton et al., 1993). Nijman et al. (1998) document a variety of extensional and contractional syn-sedimentation features in the Coppin Gap greenstone along the north flank of the Mt Edgar Batholith. At least some of the structures, including thrust reactivation of exten-sition, alteration and dewatering of the
Warra-woona Group (perhaps culminating with the for-mation of the ‘‘stick breccias’’) was followed by overturning and transtensional faulting prior to, or in the earliest stages of, regional deformation. The main breccias postdate layer-confined ‘‘stick breccias’’, have clasts with extremely angular edges, postdate overturning of the sequence, have a matrix of inferred cataclastic origin, and involve small clast transport distances. This observed se-quence of events places constraints on the relative timing of the main brecciation and indicates that the cherts must have been lithified prior to this brecciation. In addition, the main brecciation postdates overturning of the sequence and we consider the overall coherency of the Marble Bar Chert and its relationships with enclosing basaltic layers to indicate that the chert must have been lithified prior to overturning.
approxi-N.H.S.Oli6er,P.A.Cawood/Precambrian Research105 (2001) 1 – 15 14
sional faults, appear unrelated to and predate dome formation associated with batholith em-placement. In the Marble Bar greenstone just to the northeast of the Marble Bar, van Haaften and White (1998) proposed early E – W extension dur-ing the formation of the Warrawoona Group followed by E-directed thrusting to form a large-scale (\10 km) antiformal culmination which is
truncated and intruded by the Mt Edgar
Batholith. They noted a similarity in the sequence of deformational events in the Shaw and Marble Bar regions, with early WNW – ESE extension followed by east-directed thrusting and suggested that these may be regional events in the East Pilbara. The proposal of widespread inversion by Bickle et al. (1985) is disputed by Hickman (1983) and Collins and Van Kranendonk (1999), on the basis of consistent younging indicators outwards from the domes, but our study confirms the com-plexity of pre-dome deformation noted by several other workers.
Kyanite occurs in higher grade, structurally lower greenstone sequences closer to the major granitic domes. Bickle et al. (1980) and Bickle et al. (1985) infer this to be a function of early thrusting and thickening prior to extensional col-lapse and doming. Collins and Van Kranendonk (1999), however, prefer a model of partial convec-tive overturning to explain the distribution of kyanite and its relationships to the dome forma-tion. These latter workers maintain that the thrusting referred to by Bickle et al. (1985) adja-cent to the Shaw Batholith was localized and not representative of the deformation history of the Pilbara as a whole. Although we are uncertain of the regional significance of the overturning of the Marble Bar Chert, it is evident that deformation prior to the main phase of doming was not re-stricted to the western margin of the Shaw Batholith. The remarkable preservation of bed-ding in the Marble Bar Chert prior to transten-sional faulting is perhaps inconsistent with the
structures expected to develop during a
wholescale inversion event. However, later defor-mation events cannot account for the structures observed because of the overprinting relationships (8), and also because the ‘‘S1’’ tectonic fabric
developed in Marble Bar metabasalts is in a
simi-lar orientation to elsewhere in the Marble Bar belt. Our data could be intrepreted as supporting the existence of a shallow-level inversion event that postdates sedimentation and lithification but predates dome formation, in the range 3400 – 3320 Ma. In this scenario, the apparently complicated deformation history must have involved a compo-nent of horizontal tectonics, not just the vertical tectonics proposed by Collins and Van Kranen-donk (1999). Even if displacements are small, our work suggests the maximum principal compres-sive stress (s1) during brecciation was
subhorizon-tal. The thrust stacking documented by van Haaften and White (1998) 15 km to the northeast may correlate with the overturning at the Marble Bar, but further mapping is required to clarify possible correlations, as the geometries are differ-ent. Major pre-dome recumbent fold closures such as those proposed by Bickle et al. (1985) are not evident in the sequence around Marble Bar.
A more conservative interpretation of our data suggests doming in this area could have involved more than one phase, producing locally over-turned sequences prior to the main phase of duc-tile deformation associated with emplacement of the Mt Edgar Batholith. Collins (1989) proposed polydiapirism in the Pilbara Craton and it is possible that the main stage of intrusion of the Mt Edgar Batholith postdates an earlier history of diapirism (and overturning), as well as a number of structural processes accompanying diagenesis. Alternatively, a protracted history of doming around the Mt Edgar Batholith may have com-menced with some structural disruption, overturn-ing and then transtensional faultoverturn-ing, followed by further burial on the flanks accompanied by folia-tion development and peak metamorphism. The faulting represented by the Marble Bar breccias may have been an important strain accommoda-tion structure during early doming processes.
Acknowledgements
on the outcrops. Bruce Hobbs is thanked for the Australis analysis of the black matrix material, and Ian Cartwright at the Monash Stable Isotope Facility is thanked for the oxygen isotope analy-ses. Comments by W. Collins on an earlier ver-sion of the manuscript are appreciated, as are the review comments of A. Hickman and S. White. The research was supported by an ARC large grant to NHSO. This is Tectonics Special Re-search Publication No. 72
References
Bickle, M.J., Bettenay, L.F., Boulter, C.A., Groves, D.I., Morant, P., 1980. Horizontal tectonic interaction of an Archean gneiss belt and greenstones, Pilbara Block, West-ern Australia. Geology 8, 525 – 529.
Bickle, M.J., Morant, P., Bettenay, L.F., Boulter, C.A., Blake, T.S., Groves, D.I., 19785. Archaean tectonics of the Shaw Batholith, Pilbara Block, Western Australia: structural and metamorphic tests of the batholith concept. In: Ayers, L.D., Thurston, P.C., Card, K.D., Weber, W. (Eds.), Evo-lution of Archaean Supracrustal Assemblages. Geological Association of Canada, pp. 325 – 341 Special Paper 28. Clayton, R.N., Mayeda, T.K., 1963. The use of bromine
pentafluoride in the extraction of oxygen from oxides and silicates for isotopic analysis. Geochim. Cosmochim. Acta 27, 43 – 52.
Collins, W.J., 1989. Polydiapirism of the Archaean Mount Edgar Batholith, Pilbara Block, Western Australia. Pre-cambrian Res. 43, 41 – 62.
Collins, W.J., Van Kranendonk, M.J., 1999. Model for the development of kyanite during partial convective overturn of Archean granite-greenstone terranes: the Pilbara Cra-ton, Australia. J. Metamorph. Geol. 17, 145 – 156. Gregory, R.T., Taylor, H.P, Jr, 1981. An oxygen isotope
profile in a section of Cretaceous ocean crust, Samail Ophiolite, Oman: evidence ford180 buffering of the oceans
by deep (\5 km) seawater – hydrothermal circulation at mid-ocean ridges. J. Geophys. Res. 86, 2737 – 2755. Hickman, A.H., Lipple, S.L., 1978. Explanatory notes on the
Marble Bar 1:250 000 Geological Sheet, Western Australia. In: Geological Survey of Western Australia, Perth, p. 24.
Hickman, A.H., 1983. Geology of the Pilbara. Block and its environs. Geological Survey of Western Australia Bulletin 127, 268.
Knauth, L.P., Epstein, S., 1976. Hydrogen and oxygen isotope ratios in nodular and bedded cherts. Geochim. Cos-mochim. Acta 40, 1095 – 1108.
McNaughton, N.J., Compston, W., Barley, M.E., 1993. Con-straints on the age of the Warrawoona Group, eastern Pilbara Block, Western Australia. Precambrian Res. 60, 69 – 98.
Minami, M., Shimizu, H., Masuda, A., Adachi, M., 1995. Two Archean Sm – Nd ages of 3.2 and 2.5 Ga for the Marble Bar Chert, Warrawoona Group, Pilbara Block, Western Australia. Geochem. J. 29, 347 – 362.
Nijman, W., Willigers, B.J.A., Krikke, A., 1998. Tensile and compressive growth structures: relationships between sedi-mentation, deformation and granite intrusion in the Ar-chaean Coppin Gap greenstone Belt, eastern Pilbara, Western Australia. Precambrian Res. 88, 83 – 108. Oliver, N.H.S., 1996. Review and classification of structural
controls on fluid flow during regional metamorphism. J. Metamorph. Geol. 14, 477 – 492.
Sugitani, K., 1992. Geochemical characteristics of Archean cherts and other sedimentary rocks in the Pilbara Block, Western Australia: evidence for Archean seawater enriched in hydrothermally-derived iron and silica. Precambrian Res. 57, 21 – 47.
Thorpe, R.I., Hickman, A.H., Davis, D.W., Mortensen, J.K., Trendall, A.F., 1992. U-Pb zircon geochronology of Ar-chaean felsic units in the Marble bar region, Pilbara cra-ton, Western Australia. Precambrian Research, 56, 169 – 189.
van Haaften, W.M., White, S.H., 1998. Evidence for multi-phase deformation in the Archean basal Warrawoona Group in the Marble Bar area, East Pilbara, Western Australia. Precambrian Res. 88, 53 – 66.
von Rad, U., Ro¨sch, H., 1974. Petrography and diagenesis of deep-sea cherts from the central Atlantic. In: Hsij, K.J., Jenkins, H.C. (Eds.), Pelagic sediments: on land and under the sea. Blackwell Scientific Publications, Oxford, pp. 327 – 347.
Williams, I.S., Collins, W.J., 1990. Granite-greenstone terraces in the Pilbara Block, Australia, as coeval volcano-plutonic complexes; evidence from U-Pb dating of the Mount Edgar Batholith. Earth and Planetary Science Letters, 97, 41 – 53. Zegers, T.E., White, S.H., de Kejzer, M., Dirks, P.G.H.M., 1996. Extensional structures during deposition of the 3460 Ma Warrawoona Group in the eastern Pilbara Craton, Western Australia. Precambrian Res. 80, 89 – 105.