This
Financial Stability Review (FSR)
is one the report Bank Indonesia provides
to public in order to achieve its mission ≈to achieve and maintain stability of the Indonesian
Rupiah through maintaining monetary stability and promotes on financial system stability for
safeguarding long-term and sustainable national development.∆
Financial System Stability Bureau
Directorate of Banking Research and Regulation Bank Indonesia
Jl. MT Thamrin No.2, Jakarta 10010 Indonesia
Information and Order:
This document was used data as of 30 June 2004, unless otherwise state. This completed document is available at http//www.bi.go.id.
Any requests, comments and advises should be directed to :
Bank Indonesia
Directorate of Banking Research and Regulation Financial System Stability Bureau
Jl. MT Thamrin No.2, Jakarta, Indonesia Tel: (+62-21) 381 7990, 7353
Fax: (+62-21) 2311 672 Email: [email protected]
FSR issued biannually and has the following objectives:
-
To foster public vision on financial system stability issues, both domestically and internationally;
-
To analyze potential risks to financial system stability; and
fsr
Financial Stability Review
Foreword v
Executive Summary ix
Chapter 1 Overview 3
Chapter 2 Development of International & Domestic Economies 7
1. Development of International Economy 7 2. Development of Domestic Economy 9 3. Development of the Real Sector 12
Box 2.1: Potential Pressures on Several Industries due to Oil Price Hikes 16
Chapter 3 Indonesia»s Banking Industry 21 1. Structure of Banking Industry 21
2. General Picture of Banking Industry 21 3. Credit Risk 22
4. Liquidity Risk 29 5. Market Risk 34 6. Operational Risk 37 7. Profitability 39 8. Capital 41
9. Directon of Banking Policies 43
9.1. Indonesian Banking Architecture 43 9.2. Rural Bank (BPR) 44
9.3. Sharia Banking 45 Box 3.1: Financial Safety Net 46
Chapter 4 Non-Bank Financial Institutions 49 1. Condition of Insurance Industry 49
2. Development of Pension Fund Industry 50
Box 4.1: Cases of Bankruptcy Pronouncements of Insurance Companies : PT. Prudential Indonesia dan PT. Manulife Indonesia 51
Chapter 5 Capital and Money Markets 55 1. Stock Market 55
2. Development of Bond Market 57 2.1. Corporate Bonds 57
2.2. Surat Utang Negara 58 3. Development of Mutual Funds 59 4. Money Market 60
Box 5.1: Oversubscribed Foreign Currency Bonds: Momentum of Rising Foreign Confidence 62
Chapter 6 Payment System 65
APPENDIX
1. Table 1. Balance of Payment 71 2. Table 2. Macroeconomic Indicators 71 3. Table 3. State Budget 72
ARTICLES
1. Analysis of Foreign Bank»s Role in Enhancing Indonesia»s Real Sector Recover 75
2. The Model To Predict Bankruptcy for Commercial Banks in Indonesia 95
List of Table and Chart
Table
2.1. GDP of Major Trading Partners 2.2. GDP of Some Asian Countries
2.3. Export Performance of Some Major Industrial Countries 2.4. Euro and Yen Exchange Rates Against USD S1-2004 2.5. Exchange Rates of Asian Currencies Against USD Chart Box 2.1 Loan Classification of Airline Industry - July
2004
3.1. Earning Assets 3.2. Loans by Group 3.3. Loan to Deposit Ratio 3.4. NPL of Consumer Loan
3.5. New Disbursed Loan 2002, 2003, 2004 3.6. Undisbursed Loan by Sector
3.7. Undisbursed Loan by Usage 3.8. NPL Gross and Net
3.9. NPL to Capital
3.10. NPL of ASEAN Countries 3.11. Stress Test of NPL - June 2004 3.12. Loan by Sector
3.13. NPL by Sector - June 2004
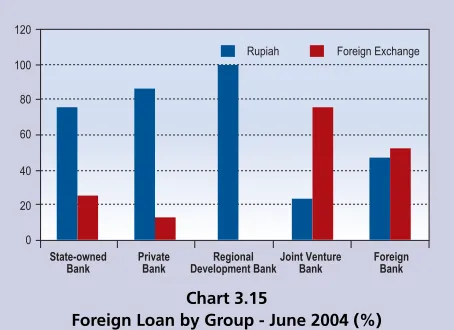
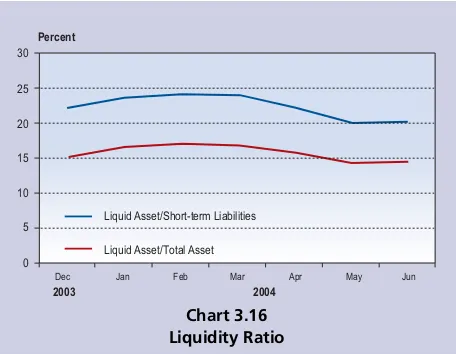
3.14. NPL by Agriculture, Mining and Manufacture 3.15. Foreign Loan by Group - June 2004 (%) 3.16. Liquidity Ratio
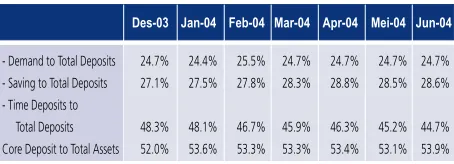
3.17. Deposits Ownership
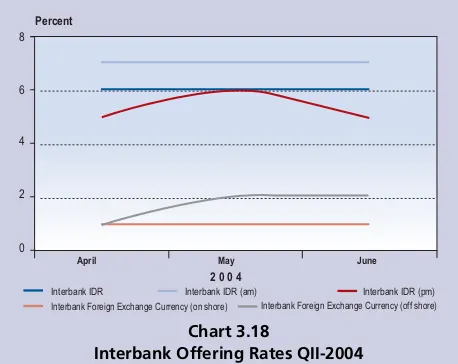
3.18. Interbank Offering Rates QII-2004
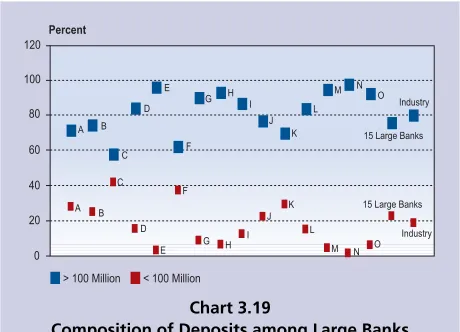
3.19. Composition of Deposits among Large Banks 3.20. Stress Testing of Exchange Rate
3.21. Interest Rate Stress Testing
3.22. Net Open Position to capital of Large Banks 3.23. Composition of Interest Income of Large Banks 3.24. Composition of Interest Income of All Banks
(2003-2004)
3.25. Net Interest Income Trends (Excl. Interest Income from Securities)
3.26. Trend of ROA (Peer Group Comparison) - June 2004 3.27. Distribution of ROA - June 2004
3.28. Efficiency and Overhead Cost Ratios - June 2004 3.29. Fee Based to Total Operating Income Ratios 3.30. CAR - June 2004
3.31. Distribution of CAR
3.32. Tier 1 to Total Asset Ratio - June 2004
4.1. Government Bond Ownership
5.1. Equity Index and Market Capitalization 5.2. Volatility of Equity Index
5.3. Equity Index and Transaction of Foreign Investors 5.4. PER of World Stock Exchanges
5.5. Equity Index of Financial Corporations 5.6. NAV per Type of Mutual Funds
5.7. Composition of NAV per Type of Mutual Funds 5.8. Trend of Domestic Interest Rates
5.9. Spread of Interest Rates
6.1. Volume and Value of Real Time Gross Settlement 6.2. Volume and Value of Clearing Settlements 6.3. Real Time Gross Settlement System Transactions 2.1. Repayment Plan of Indonesian Offshore June
-December 2004
2.2. Simulation of Debt Equity Ratio of 3 Major Group of Companies
2.3. Outstanding and Growth of Loans to Small Scale Business
3.1. NPL by Nominal 3.2. NPL By Bank Group 3.3. 25»s Top Debtors (25 TD) 3.4. Loan Restructuring
3.5. Bank Funding & Placement Structure
3.6. Development of Deposits and Net Asset Value (NAV) 3.7. Deposits and Core Deposit Ratios
3.8. Interbank Money Market 3.9. Interbank Rates
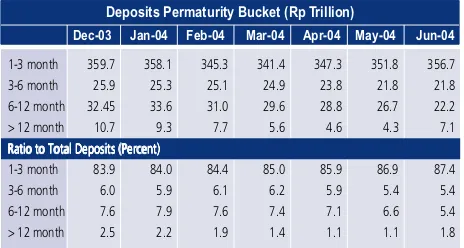
3.10. Deposits Permaturity Bucket 3.11. Exchange Offer
3.12. Fraud Cases in Banks
Table Box 4.1 Fiancial Highlights of Prudential Life Assurance (Indonesia)
5.1. Corporate Bonds
5.2. Auctions of Government Bonds
Table Box 5.1 Long-term Foreign Currency Bonds of the Republic of Indonesia
One of the roles of Bank Indonesia is the maintainance and stability of the national currency. To meet the objective, Bank Indonesia undertakes routine enhancement actions and continually monitors factors that influence domestic financial stability. Results of our monitoring and assessment are presented in the bi-annual Financial Stability Review.
During the first half of 2004, Indonesian financial system was stable and we expect continued stability throughout 2004. Notwithstanding, potential internal and external challenges that could pose greater risks to Indonesian financial system remain threatening. Several positive signs occurred during the first half of 2004, rising international confidence as evidenced by oversubscriptions in Indonesian international bonds sales, Indonesia’s improved ratings, and high foreign investors’ interest in buying Indonesian financial products. Within the country, the legislative and presidential elections went smoothly helping maintain public confidence in the recovery of the Indonesian economy.
There are still several national challenges, however, such as the real sector that has not fully revived, weak enforcement of sound administrative practices and laws. Immediate measures have to be made to pull out Indonesia from prolonged crisis and and therefore become a respected, prosperous country. Considering the broad scope of efforts required to achieve financial system stability, the development and maintenance of financial stability requires joint responsibility of the related authorities and stakeholders. This review is expected to provide useful information to our various stakeholders in conducting their respective roles for more stable economy. We want to express our highest appreciation to those whose contributions in completion of this review improved the quality of the review along with sharper analyses.
In closing, we welcome any suggestions, comments or critiques from all stakeholders to enhance the quality of this review in the coming periods.
Jakarta, June 2004
vii
ix
During the first half of 2004, the Indonesian financial system was reasonably stable. However, at the end of the semester, there was potential for rising risk exposures largely prompted by a slight depreciation of the rupiah and a modest inflation increase. The success of general election on 5 April 2004 helped contribute to the improvements in public confidence and business activities in Indonesia.
The economies of Indonesian trading partners, such as the US, Japan, and ASEAN countries, were stable during semester I/2004. This is expected to continue into the next period. However, there is an uptrend of the Federal Funds rates, which could change global market conditions. Also, competition with exports from China needs to be closely watched in the coming periods.
The changes of economic indicators did not create serious consequences on the financial sector, particularly the banking sector. Financial and operational performances of banks as the most dominant player of Indonesian financial was reasonably stable and adequate, despite a slight drop in CAR, stemming from increases in number of loans granted.
Programs for implementation of the Indonesian Banking Architecture, preparation for implementation of international standards (best practices), including Basel 2, as well as Bank Indonesia»s strong commitments to implement sound risk management principles within the banking industry have contributed to maintaining public confidence on the Indonesian banking industry.
Loans grew quite rapidly by Rp51.5 trillion (10.8%), or 93.8% of banks» business plan for semester I/2004 accompanied by a modest rising of NPLs. NPLs actually
trended downward, however, this was more due to quite large rise in loans. In the short-to-medium term, it is predicted that credit risk would have a slight upward trend, largely prompted by rising interest rates and the remaining sluggish real economy.
In addition, market risk remained stable despite the rupiah depreciation since April 2004. The measures of Bank Indonesia to minimize the excess liquidity has boosted the strength of the rupiah. In addition, results of stress tests show that capital of the major banks stays robust should the rupiah depreciates up to Rp2,500/USD. As banks converted bonds and SBI, profitability of banking industry started to rise in line with growth of loans. Consequently, ROA and NII also improved from 2.5% and Rp3.2 trillion in December 2003 to 2.7% and Rp5.4 trillion as of June 2004. However, potentials for increases in interest rates and credit risk must be carefully watched by bank management in order to maintain and increase their abilities to earn revenues and maintain adequate capitals. Cases of fraud in the banking sector also need special attention, considering that its frequency has relatively increased, particularly in the period 2003/2004. As such, there is a need for early detection approach and effective law enforcement to prevent the recurrence of similar incidents in the future.
Capital markets became relatively more sensitive as reflected by the downward trend of the composite index since April 2004 while it previously experienced a rise since end-2003. This has boosted an upward shift in investment to lower-risk portfolios such as mutual funds with underlying government bonds and bank deposits that are fully guaranteed by the government. This condition is
reflected by rising net asset value (NAV) of Rp16 trillion (23.2%) to Rp85 trillion.
In addition, the payment system, operating both through the BI-RTGS system as well as the clearing system, stayed robust. During the first semester, daily average transaction value of BI-RTGS system has dropped by Rp49.7 trillion (- 35.9%), while that of the clearing system has increased by Rp4.6 trillion (92.3%). Nevertheless, the role of the clearing system is relatively smaller than that of the BI-RTGS, at only 0.02% of BI-RTGS daily average value.
Supervision of the BI-RTGS system continuously strengthen, particularly for ensuring the operational safety of the system, both on the operators as well as the participant side. Supervision of the BI-RTGS system safety on the participant side is also aimed at minimizing the risk of fraud.
Chapter 1
Risks to Indonesia»s financial system stability, and that of several of its major trade partner countries and other ASEAN countries, are moderating in the short-term. However,a rising interest rate environment at a time of relatively high levels of bank credit and domestic government debt would have the potential to increase market and liquidity risks.
In general, Indonesia»s financial institutions and markets, particularly banks, remain sound and growing. Problems, risks, and mitigation of risks will be discussed in more detail in this financial stability review.
International economies have improved in the first half of 2004 as evidenced by rising GDPs of the US, countries in the Euro region, and Japan. However, this opportunity has not been optimally seized by Indonesia as reflected by the low rise in Indonesia»s non-oil/gas international trade volume.
In addition, the domestic condition is susceptibile to an increasing state budget deficit and pressures on several of Indonesia»s largest foreign currency contributing commodities, such as textiles and textile products, footwear products, wood-based products, paper products, etc. However, economic growth is predicted to continue with the support from the consumption sector and productions from micro, small, and medium businesses.
Major risks to Indonesia»s banking industry, such as credit, liquidity, and market risks were relatively under control. However, in the coming few periods, it is predicted that credit and market risks would rise again due to high uncertainty stemming from less supportive domestic economic condition and pressures coming from international factors, namely rising global interest rates and oil price hikes.
Meanwhile, banking operational risk is still quite high. This is evidenced by the few incidents of fraud that have occurred at several banks. This high level of risk results from weak internal controls and loosely applied good corporate governance. Bank Indonesia has taken follow-up actions on violations in the banking sector through cooperation with related authorities and the issuance of enforcement orders dealing with bank risk management practices, including operational risk management.
Improvements in the Banking sector is evidenced by rising profitability resulting from credit expansion that began in the beginning of 2004. ROA rose from 2.5% to 2.7%, while NII rose from Rp3.2 trillion to Rp5.4 trillion. However, there were still many national banks with ROA far below 1.2% (28 banks) due to relatively low efficiency levels, particularly in state banks.
Meanwhile, the downward trend of interest rates during semester I has lowered the profits of non-bank financial institutions, particularly insurance companies and pension funds. However, the potential rise in interest rate in the post-semester I period and expanded business opportunities resulting from new financial product offerings provides for potential improvement in profitability.
The capital market as an alternative source of financing has shown quite encouraging performance. However, it is predicted that a weak performance of world bourse, the potential for rising interest rates and payment failures (defaults) on the part of several large companies in the Asia Pulp and Paper group (PT Tjiwi Kimia, PT Indah Kiat, PT Lontar Papyrus and PT Pindo Deli) and Mulia group (PT Muliakeramik Indahraya and PT Muliaglass) could deteriorate investors» confidence. Meanwhile, the surat
utang negara/SUN (government bond) market condition is still growing positively and liquid, despite having experienced sales cancellations for two consecutive months and the existence of high potential for refinancing risk in a state budget condition that is more burdened.
Efforts to support financial system stability, particularly regarding the realization of a safe and reliable payment system , are continuously undertaken. Control over risks within the payment system, both settlement and operational risk, is implemented in line with international standards (best practices). In addition, institutions that issue credit cards, debit cards, and ATM cards will be supervised to ensure that the payment system remains safe and efficient and the customer is protected
A bankruptcy prediction model for individual commercial banks and banking groups operating in Indonesia, based on their financial reports has been developed. Results of statistical analyses show that this
model is effective in predicting bankruptcy three months ahead of the occurrence.
In addition, research has been conducted on the role of foreign banks in the recovery of intermediation, particularly in credit channeling. Results of this research confirm that currently foreign banks» activities are more focused on activities that earn fee based income, credit channeling to the consumption sector, and placement of funds in marketable securities. Data also show that foreign banks give priority to non-credit incomes (42.1%) and that their ROA (0.29%) has a negative correlation with credit growth.
Chapter 2
Opportunities that came with improving international economy in the first half of 2004 have not been optimally seized by Indonesia. This is evidenced by relatively low increase in Indonesia»s international (non oil/gas) trade volume, which stemmed from supply problem such as structural problem and weak competitiveness of Indonesia»s industry sectors that produced prime export products.
1. DEVELOPMENT OF INTERNATIONAL ECONOMY
During semester I/2004, world economy still experienced quite high growth (Chart 2.1) although it was overshadowed for a while by a worry over rising uncertainty that has risen from several geopolitical problems such as heightening political condition in the Middle East. Economies of advanced countries such as the US and Britain still showed quite high growth, largely supported by rising domestic demand. Meanwhile, in the Euro region, domestic economic performance was still moving slowly and as such economic growth in that region was more supported by external sector performance. In the particular case of Japan, significant improvement in economic
performance occurred both on the external side as well as on the domestic side.
Economic growth of advanced and Asian countries has given positive influence on Indonesia»s exports as evidenced by Indonesia»s export performance that was still rising, particularly oil and gas exports. However, it has to be realized also that Indonesia»s rising oil and gas export performance was also much influenced by rising international oil prices. Considering the volatile trend of oil prices, Indonesia»s oil and gas industry sector should increase efforts to raise production volume, which would make institutions that finance this sector feel more secured because their debtors» revenue source would be more certain.
Chapter 2
Development of International & Domestic Economies
Chart 2.1
GDP of Major Trading Partners
% y-o-y
Source : Bloomberg
USA EU Japan
-5.0 -4.0 -3.0 -2.0 -1.0 0.0 1.0 2.0 3.0 4.0 5.0 6.0
2000 2001 2002
I II III IV I II III IV I II III IV I II III IV I II 2004 2003
Chart 2.2
GDP of Some Asian Countries
% y-o-y
-10.0 -5.0 0.0 5.0 10.0 15.0
Source : Bloomberg
2000 2001 2002 2003 2004
I II III IV I II III IV I II III IV I II III IV I II
Malaysia
Korea Singapore China Thailand
value of USD1,382.6 million (5.76%). On the other hand, Indonesia»s largest non oil/gas imports came from Japan with total value of USD2,504 million (16.22% of total non oil/gas imports), followed by the US with total value of USD1,510.9 million (9.78%), China with total value of USD1,421.4 million (9.21%), and Singapore with total value of USD1,094.1 million (7.09%).
In several Asian countries, the growth rates of their trades with other countries were still rising, as reflected by indicators of export-import activities in several countries (Chart 2.3). Meanwhile, China»s policy package to solve the overheating of its economy has started to show influence, particularly in the decline of its international (export-import) trade activities. For Indonesia, China»s economic slowing policy has not shown influence in semester I/2004. This is evidenced by non oil/gas exports that still rose by 8.4% relative to the same period in 2003, while non oil/gas imports rose by 30.9%. However, adoption of above policy by China would make it difficult for non oil/gas exports to that country to expand, which currently have only reached 5.76% of Indonesia»s total non-oil/gas exports (compared to Japan, the US, and Singapore each with a share of 15.82%, 15.01% and 10.28%). For certain industry sectors that are looking for alternative export markets
other than the US, this situation poses a heavy challenge. Financing institutions/banks also need to pay close attention to this phenomenon.
Expanding global economic activities and rising oil and gas and non-oil/gas commodity prices have prompted expanding demand, which has accelerated the rise of inflation in several countries. Inflation rate in advance country group went up from 1.5% (yoy) in semester II/ 2003 to 1.9% (yoy) in semester I/2004.
These expanding economic activities have been followed by an uptrend of interest rates in the international money market, which has been prompted by similar trend in advanced countries (except Japan). Meanwhile, offered interest rates in Asian countries were relatively stable. In the international stock market, shares recovered after experiencing a drop for a while as uncertainty regarding US economy lessened and optimism regarding improved profits for corporations in the US rose. In addition, in the foreign currency market, the strengthening trend of the US dollar exchange rate, which was related to expectation over acceleration of US economic growth followed by expectation over the rise of Fed Fund interest rate, was only temporary. The US dollar weakened again because market players considered that the US economy was still in a big problem in the short-term, largely due to existing twin deficits (US deficit in trade transactions and fiscal deficit). In addition, crude oil price hikes also put pressure on the US dollar exchange rate. Fundamentally, oil price hikes occurred because the need for crude oil was larger than its supply, which was quite disrupted by the crisis in Iraq and problem in the world second largest oil company, Yukos.
From the sentiment side, these oil price hikes were related to speculative activities on oil amidst uncertainties over the plan to reduce OPEC oil production quotas, oil company labor strikes in Venezuela, political fighting in Nigeria and Middle East, as well as information on low Chart 2.3
Export Performance of Some Major Industrial Countries
Source: Interntational Financial Statistics, (processed) Jan
2 0 0 2 % y-o-y
USA Japan
U K Germany -20.00
-10.00 0.00 10.00 20.00 30.00 40.00
fuel reserves in several advanced countries, particularly the US and Europe.
This condition has had negative influence for Indonesia, which currently is a net oil importer. It would raise fuel subsidy cost and as a result would increase state spending in the state budget. In the end, it would have the potential to expand Indonesia»s state budget deficit. Meanwhile, financial institutions need to give close attention to potential interest rate increases due to quite large pressure on the rupiah as a result of this condition. In addition, they also have to be cautious in financing projects that are much influenced by oil prices. Oil price hikes have the potential to raise production cost, which in turn will have the potential to threaten the sustainability of these projects. Financing of export-oriented businesses with exports to countries that are very much dependent on oil imports also need to be closely watched. Oil price hikes could have an impact in slowing down these countries» economic growth and reducing their imports.
International capital flows to developing countries, including Indonesia, experienced outflows for a while due to the issue on Fed Fund interest rate rise. During the first few weeks in semester I/2004, outflows that occurred in developing countries reached USD124 million. However, those capitals are predicted to have returned in line with
lessening expectation over US economic recovery in the short-term.
2. DEVELOPMENT OF DOMESTIC ECONOMY
On the side of balance of payments, current transactions in semester I/2004 recorded a surplus of USD659 million, lower than USD3.6 billion in the same semester in 2003 (Table Indonesia»s Balance of Payments, Appendix 2.1). This drop in surplus was prompted by import rise (14.2%) being larger than export rise (1.1%), particularly oil and gas import rise.
During semester I/2004, the rupiah exchange rate experienced depreciation compared to the previous period, along with rising volatility. Up to end of June 2004, the average rupiah exchange rate has reached Rp8,733/USD, or slightly above the beginning estimated range of Rp8,200/USD √ Rp8,700/USD.
Meanwhile, in June the rupiah exchange rate reached
its lowest of Rp9,486/USD for a while. This depreciation
in general was spurred by external and domestic factors.
The external factors were the spill over impact of US dollar
strengthening, which was related to expectation over Fed
Fund interest rate rise and acceleration of US economic
recovery, as well as regional sentiment over China»s
economic slowing, all of which were overreacted by
domestic market players. This attitude has dampened the
Chart 2. 4
Euro and Yen Exchange Rates Against USD S1-2004
JPY/USD
JPY/USD (right axis) USD/EUR (left axis)
Source: Bloomberg USD/EUR 1,1200 1,1400 1,1600 1,1800 1,2000 1,2200 1,2400 1,2600 1,2800 1,3000
1-Jan 21-Jan 10-Feb 1-Mar 19-Mar 8-Apr 28-Apr 18-May 7-Jun 25-Jun
98 100 102 104 106 108 110 112 114 116
2 0 0 4
Chart 2. 5
Exchange Rates of Asian Currencies Against USD
IDR,KRW/USD THB,PHP/USD Source: Bloomberg 1,000 2,000 3,000 4,000 5,000 6,000 7,000 8,000 9,000 10,000 33 38 43 48 53 58
1-Jan 21-Jan 10-Feb 1-Mar 19-Mar 8-Apr 28-Apr 18-May 7-Jun 25-Jun
THB/USD IDR/USD PHP/USD
prompted the formation of public expectation over rising
inflation. If this inflationary pressure persists, it will have
an impact in raising interest rate. As a consequence,
interest rates of credits and domestic bank deposits would
rise. This would make credit channeling more difficult
and the real sector movement would become slower.
Weakening trend of rupiah exchange rate and rising
inflation expectation have prompted a slowing in the
acceleration of SBI interest rate decline, which made SBI
interest rates relatively stable in the last two months.
During semester I/2004, average interest rates of 1-month
and 3-month SBIs came to 7.57% and 7.49%, lower than
11.51% and 11.66% in semester I/2003. Fed Funds
interest rate increase of 25 bps in June 2004 does not
seem to have influenced domestic interest rate
development yet. However, it is predicted that in the
coming period it would influence domestic money market
condition, which would be reflected in the rise of interbank
money market interest rate. The prediction is even stronger
as US interest rate increase is predicted to continue in
several stages.
On the side of state budget realization in semester I/
2004, domestic currency decline against US dollar and
rising trend of crude oil prices in the international market
have influenced realization of state budget aggregates and
made several basic assumptions, used as references in the
calculation of state budget realization, become no longer
valid. This situation has the potential to raise state budget
deficit and as such revision on state budget cannot be
avoided.
State receipt in semester I/2004 came to Rp144,783.3
billion or 41.4% of state budget target. Meanwhile, tax
receipt for the same period reached Rp118,909.2 billion
or 43.7% of state budget target, with the main sources
being non oil/gas income tax and value-added tax.
On the side of state spending, in semester I/2004,
there has been a rise in government spending in relation positive sentiment arising from improvement on Indonesia»s
foreign debt rating.
In May 2004, Standard and Poors has raised
Indonesia»s sovereign rating outlook from stable to positive
while Japan Credit Rating Agency (JCRA) has also raised
Indonesia»s ratings on long-term currency senior debt as
well as long-term local currency senior debt from B to B+.
Meanwhile, in June 2004, Japan»s rating institution Rating
& Investment raised Indonesia»s long-tem debt rating from
B- to B with stable outlook.
Domestic factor also contributed in putting pressure
on rupiah exchange rate through negative market
sentiment at the approach of the general election. In
addition, negative market sentiment was also influenced
by the bandwagon effect from the rupiah exchange rate
weakening, which was evidenced by rising foreign currency
demand by corporations for import financing, foreign
obligations, in addition to speculative motives.
In the framework of reducing pressures on the
rupiah, Bank Indonesia has issued an economic
stabilization policy package, which covers three aspects.
The first aspect covers controlling policy on the side of
rupiah liquidity by way of absorption of the banking
sector»s excess liquidity that has not been utilized by the
real sector. This is achieved through activation of 7-day
Bank Indonesia Deposit Facility and increase in minimum
reserve requirement for banks. The second aspect covers
enhancement of bank prudential requirement on foreign
currency net position. The third covers increased
monitoring on foreign currency demand.
During semester I-2004, CPI inflation reached 6.83%
(yoy), up from 6.62% (yoy) in the same period last year.
In general, the rise in inflation was prompted by the rise in
telephone tariffs, declining supplies of a number of
commodities that are classified as volatile food due to
seasonal factor, as well as influence of exchange rate
to government policy to give 13th month salaries to civil
servants, members of the Arm Forces/Police, retired civil
servants, and government officials, which were paid in
June 2004, foreign debt interest payments, and other
routine spending related to the cost of holding the general
election. In addition, realization of fuel subsidy reached
Rp8,773.2 billion or 60.4 % of its ceiling in the 2004 state
budget, which was primarily influenced by high realization
of crude oil prices. This realization of fuel subsidy in
semester I/2004 was much higher compared to semester
I/2003 when it reached Rp3,852.9 billion. Development
spending also experienced a slight rise, particularly due to
rupiah financing. Realization of total state spending in
this semester reached Rp163,337.3 billion or 43.6% of
2004 state budget target.
With above developments, semester I/2004 brought
a deficit of Rp18,553.9 billion (3.3% of GDP or 76.0% of
state budget target), which was primarily financed from
the balance of the government account at Bank Indonesia,
particularly investment fund account, yields from
government shares privatization, sales of assets under the
bank restructuring program, and net yields of issuance of
surat utang negara/SUN.
Meanwhile, decline in oil production and increase in
domestic fuel consumption along with rising international
oil prices have the potential to raise deficit. Of course,
rising state budget deficit would have negative influence
for Indonesia because it would lower investors» confidence
in Indonesian government capability to finance that deficit
rise. Further impact would be negative sentiment, which
would bring pressure on the rupiah exchange rate and in
the long-run could also lower Indonesia»s foreign debt
rating.
Indonesia»s foreign debt payments up to May 2004
have reached USD2,142 million, comprising payments on
principals and interests amounting to USD1,900 million
and USD241 million, respectively. Of the total, USD569
million was for government foreign debt payments and
USD1,572 million was for private foreign debt payments.
Of total private foreign debt payments, USD1,195 million
was for financial institutions» foreign debt payments (for
banks amounting to USD1,184 and for non-banks
amounting to USD11 million). The remaining balance of
USD377 million was for non-financial institution foreign
debt payments. These foreign debt payments influenced
the weakening of rupiah exchange rate for a while due to
quite large demand for dollars for the need of these
payments. However, weakening of rupiah exchange rate
was not such that it has endangered Indonesia»s banking
financial condition.
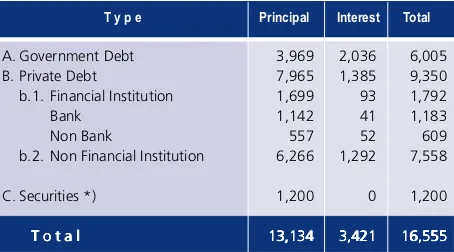
Planned 2004 payments on Indonesia»s foreign debts
(June up to December 2004) are projected to reach
USD16,523 million, comprising payments on principals and
interests in the amounts of USD13,102 million and
USD3,421 million, respectively. Of the total, payments on
government foreign debts are projected to reach USD6,005
million, comprising payments on principals and interests
in the amounts of USD3,969 million and USD2,036 million,
respectively. This payment plan needs to be scheduled
cautiously in order to avoid excessive demand for the dollar
at the same time, which would bring pressure on the rupiah
exchange rate.
Table 2.1
Repayment Plan of Indonesian Offshore June - December 2004
T y p e
*) Marketable securities own by non resident Source: Bank Indonesia
(USD million)
Principal Interest Total
A. Government Debt 3,969 2,036 6,005
B. Private Debt 7,965 1,385 9,350
b.1. Financial Institution 1,699 93 1,792
Bank 1,142 41 1,183
Non Bank 557 52 609
b.2. Non Financial Institution 6,266 1,292 7,558
C. Securities *) 1,200 0 1,200
T o t a l T o t a l T o t a l
this oil price increase has the potential to raise state budget
deficit and companies» production cost, such as airline
companies (see box), with a possibility of threatening the
sustainability of these companies» businesses.
Meanwhile, import value in semester I/2004 rose by
27.2% compared to the same period in 2003. This rise
was brought about by the increases in oil and gas imports
by 36.47% and non-oil/gas imports by 24.5%. Import
growth, which was quite high and exceeded that of
exports, prompted the trade account to drop by 23.8% in
the months of January √ May 2004.
In addition, foreign currency reserve during the period
May √ June 2004 dropped by US$1.9 billion due to among
others payments on foreign debts and Bank Indonesia»s
foreign currency interventions. However, in the month of
June 2004, foreign currency reserve position was still quite
high, reaching US$34.9 billion or equivalent to around 6
months of imports and foreign debt payments. Such level
of foreign reserve was still considered to be safe by investors
as evidenced by the ability of Indonesia to obtain foreign
debts and the existence of foreign investment inflows to
Indonesia.
3.1 Impact of Changes in Exchange Rates On
Corporate Payment Capability
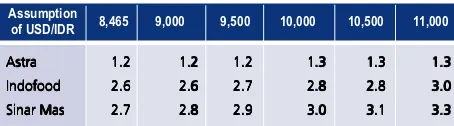
Results of a simulation of exchange rate changes on
debt to equity ratios (DERs) of three large groups show
that DERs of these groups have the potential to worsen
prompted by assumed exchange rate changes. The main
factor for this potential is the fact that each business group
debt structure is still dominated by foreign currency debts,
which are accompanied by relatively low export share in
total sales. Part of their foreign currency debts has been
obtained from national banks. The potential worsening
of these three group»s DERs indicates a potential danger
to the national banking industry and financial system
3. DEVELOPMENT OF THE REAL SECTOR
Indonesia»s economy in semester I/2004 grew 4.66%
(yoy). This growth was still dominated by consumption
activities, while investment and export activities had yet
to gain larger roles. This situation was brought about by
rising public purchasing power as well as availability of
various easy financing facilities. Meanwhile, rupiah
exchange rate weakening has not lowered consumer
expectation of the economy.
Easing in financing by financial institutions was
evidenced by quite active offers for consumer credit
products, which in the end bolstered rapid consumption
credit growth during the reporting period. During semester
I/2004, investment activities (formation of gross domestic
fixed capital), which had occurred since quarter III/2003,
have not shown optimal performance. In the last few
periods, the real sector seemed to start reviving as an
impact of improving economic stability and rising market
confidence over Indonesia»s better economic prospects in
the coming periods. This is reflected by rising approvals
for domestic capital investments by 34.1% from January
√ July 2004 compared to the same period the year before
while foreign capital investment dropped by 33.6%.
However, several investment activity indicators have not
shown satisfactory performances, as reflected in the decline
in capitalization value of the corporate bond market during
semester I/2004 by 38.8% compared to the same period
the year before.
Export performance in semester I/2004 recorded a
growth of 3.14% relative to the same period in 20031.
This growth originated in the increases of oil and gas
exports by 6.29% and non-oil/gas exports by 2.21%. Oil
and gas export rise was prompted by the increases in crude
oil and natural gas exports, while, in contrast, oil product
exports dropped. In addition, although daily level of oil
production dropped, the rise in oil and gas exports was
stability that might come from these groups» lessening
repayment capability.
Under the assumption that the rupiah exchange
rate against USD would become Rp11,000, results of
the simulation show that the Sinar Mas group would
face the largest potential DER decline, from 2.7x to 3.3x
or a drop of 21.2%. This is largely due to the fact that
59% of the groups» debt composition as of December
2003 is dominated by foreign currency debts. Basically,
this group has the potential to adapt to exchange rate
fluctuations, considering that their export sales give
58.94% contribution to total sales. However, the
existing foreign currency debt structure would bring
heavy pressure on this group in its efforts to immediately
raise its income in the short-term to be used for settling
its obligations.
Table 2.2 Simulation of Debt Equity Ratio of 3 Major Group of Companies
Astra AstraAstra
AstraAstra 1.21.21.21.21.2 1.21.21.21.21.2 1.21.21.21.21.2 1.31.31.31.31.3 1.31.31.31.31.3 1.31.31.31.31.3 Indofood
IndofoodIndofood
IndofoodIndofood 2.62.62.62.62.6 2.62.62.62.62.6 2.72.72.72.72.7 2.82.82.82.82.8 2.82.82.82.82.8 3.03.03.03.03.0 Sinar Mas
Sinar MasSinar Mas
Sinar MasSinar Mas 2.72.72.72.72.7 2.82.82.82.82.8 2.92.92.92.92.9 3.03.03.03.03.0 3.13.13.13.13.1 3.33.33.33.33.3 8,465 9,000 9,500 10,000 10,500 11,000 Assumption
of USD/IDR
Source : The related company»s publicized financial report (processed)
in their automotive products, which are the main engine
of the Astra group»s businesses.
The banking industry needs to well anticipate the
potential worsening of DERs as shown by results of this
simulation, which uses an assumption of weakening rupiah
exchange rate. Otherwise, this condition has the potential
to spur these groups» worsening repayment capability,
which in turn would raise banking industry»s
non-performing loans.
3.2 Textiles and Textile Products Industry
One of the industry subsectors that has experienced
quite serious problems is the textiles and textile products
(TTP) industry. Since 2003, credits extended to this industry
have been declining. There are banks that even have
classified the TTP industry into the negative list because
this industry is considered to be an industry that is going
down (sunset industry), with high risk (its debts are
susceptible to becoming non-performing) and not so good
prospects. There are several factors that have influenced
banks» evaluation. First, the TTP industry, which exports
have once been one of the largest foreign currency
contributors for Indonesia, is facing heavy threat because
it has to compete with cheaper TTP products from China
and it has to survive despite the revocation of export quotas
by the European Union, US, and Canada starting 1 January
2005 as part of WTO agreements. Second, the slow down
of the TTP industry also stems from unclear regulations
and labor problems. Third, banks consider the TTP industry
complicated and that it requires special skills to enter this
business due to its specific characteristics. In addition, its
competitiveness is diminishing against China or Vietnam,
who are more aggressive and able to produce cheaper
products.
The main factor that has made Indonesia»s TTP
industry loose in competition against neighboring
countries» products is the fact that the industry»s The second potential DER decline would occur in the
Indofood group, from 2.6x to 3.0x or a decline of 15.4%.
However, this group would face heavier challenge because
its exports share of total sales is only reaching 17.46%. In
order to reach the ASEAN and International markets, this
group plans to build factories overseas (particularly ASEAN),
which will at the same time be the basis for competing in
overseas markets.
Meanwhile, results of simulation on the Astra group
show that the DER of this group would worsen, from 1.2x
to 1.3x or a drop of 12.4%. This would largely occur
because its foreign currency debt share to total debts
reaches 35%. Other heavy challenges that would face
machineries are already out-of-date and almost reach
maximum utilization. Therefore, the most important step
that can be taken at this time is to revive the TTP industry
through revitalization. According to the Indonesian Textile
Association, there are 2 options in revitalization. Option
one involves replacement of machinery spare parts and
machineries. If replacement is done using own capital,
only machinery spare parts can be replaced. If bank credits
can be obtained, all machineries can be replaced. However,
in order to increase Indonesia»s TPT competitiveness against
other countries as well as raise production capacity, option
two has to be adopted. As is the case with other industry
sectors, development of several TPT industry sub sectors
still need to be supported. In addition to bringing in foreign
currency, the industry also absorbs high level of labors (it
provides jobs), which is currently a national problem. From
financial system stability side, there is a worry that a
collapsed TTP industry would raise banks» NPLs, both from
the industry sector itself as well as its laid-off workers.
3.3 Micro, Small, and Medium Scale Business
One of the business units that has quite large role in
moving the real sector is the micro, small, and medium
scale business (MSMB). Research has shown that MSMB
has proved to be able to withstand crises compared to
large businesses . In addition, MSMB has also proved to
be a source for economic growth and absorbs extremely
large number of workers. Therefore, various problems that
are facing the MSMB need to be immediately solved so
that MSMB can be developed into a strong part of the
Indonesian economic system and later on can also play a
role in maintaining financial system stability.
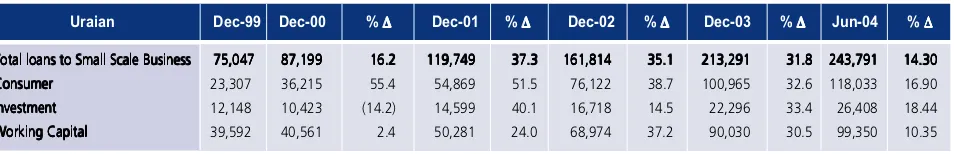
In semester I/2004, bank credits extended to MSMB
experienced a growth of Rp30.5 trillion or 14.3%
compared to its end-2003 position. This figure represents
84.7% of 13 large banks» plan for total credit channeling
to MSMB in 2004, which amounts to Rp36.02 trillion. This
growth reflected the banking industry»s commitment to
continue assistance in developing MSMB although it is
probably still far from optimal.
Several problems that face the banking industry in
channeling credits to MSMB are among others (i) limitation
on number of bank marketing staffs as well as bank outlets/
networks, which makes it difficult to reach remote areas
or centers of small business people, (ii) lack of information
on potential and bankable MSMB debtors, (iii) lack of
proper collaterals, while guarantees through PT Askrindo
and Perum Sarana Pengembangan Usaha will add costs
to potential MSMB debtors, (iv) higher overhead cost for
credit channeling to MSMB.
In order to solve all these various problems and to
raise credits channeled to MSMB in 2004, several efforts
have been made by banks, which cover among others : (i)
actively increase marketing efforts to MSMB centers, (ii)
increase human resource quality through various trainings,
(iii) increase linkage programs through partnership with
BPRs ad Small Business Credit Financing Institutions such
as state pawn company, (iv) develop credit scheme of
core-plasma partnership, and (v) undertake business mapping
of potential Rural Banks (BPRs).
Source: Bank Indonesia
Table 2. 3
Outstanding and Growth of Loans to Small Scale Business
Total loans to Small Scale Business Total loans to Small Scale BusinessTotal loans to Small Scale Business
Total loans to Small Scale BusinessTotal loans to Small Scale Business 75,047 75,047 75,047 75,047 75,047 87,199 87,199 87,199 87,199 87,199 16.2 16.2 16.2 16.2 16.2 119,749 119,749 119,749 119,749 119,749 37.3 37.3 37.3 37.3 37.3 161,814 161,814 161,814 161,814 161,814 35.1 35.1 35.1 35.1 35.1 213,291 213,291 213,291 213,291 213,291 31.831.8 243,79131.831.831.8 243,791 243,791 243,791 243,791 14.30 14.30 14.30 14.30 14.30 Consumer
ConsumerConsumer
ConsumerConsumer 23,307 36,215 55.4 54,869 51.5 76,122 38.7 100,965 32.6 118,033 16.90 Investment
InvestmentInvestment
InvestmentInvestment 12,148 10,423 (14.2) 14,599 40.1 16,718 14.5 22,296 33.4 26,408 18.44 Working Capital
Working CapitalWorking Capital
Working CapitalWorking Capital 39,592 40,561 2.4 50,281 24.0 68,974 37.2 90,030 30.5 99,350 10.35 (Billion rupiah)
Meanwhile, on the side of business people,
constraints coming from banks that face them in
developing their businesses are among others : (i) Banks
are considered to still be hesitant in extending credits to
MSMB. This is evidenced by difficult and lengthy credit
extension procedures, requirement for additional collaterals
along with legal proofs (certificates and licenses to build/
IMB), as well as high interest rates, (ii) The banking industry
does not yet have clear knowledge on MSMB condition,
(iii) Difficulty in communicating with banks» officers
because they are too rigid, (iv) Lack of information on
availability of cheap funds provided by state-owned
enterprises, that are managed by banks, and (v) There is
no sustainable supervision over MSMB debtors.
In the framework of increasing intermediary function
and in order to solve one of the constraints coming from
banks that are facing MSMB, the banking industry needs
to continue holding periodic meetings with business people
and the government. In addition, it is hoped that the
government and the banking sector can provide
information on funds coming from parts of state-owned
enterprises» profits that have been given to and are
managed by several banks for channeling to MSMB.
Micro credits have become segmentation target of
several commercial banks such as Bank Danamon, BNI,
and Bank Mega through the establishment of micro
business units so that this business segment can develop
rapidly in line with these banks» work plans. There is a
need for further monitoring and review, particularly as
regard the possibility of competition over the same target
market between commercial banks and BPRs.
This possible competition would create problems for
BPRs, although these will still be within the context of free
competition, considering that protection for common
people has become a sensitive issue, which if not handled
Box 2.1
Potential Pressures on Several Industries due to Oil Price Hikes
World oil price development that has been
trending upward and reached US$47.86 per barrel
on 23 August 2004 warrants cautious attention. In
addition to its potential to bring pressures on the state
budget, world oil price hikes also have the potential
to put pressures on the real sector performance,
particularly the airline industry. Although credits
extended to this industry has only reached 0.09% of
total credits extended by the banking industry as of
end of June 2004, the industry»s NPLs have reached
6.8%. If this situation is not well anticipated, this
trend would bring pressures on financial system
stability.
World crude oil price hike that reaches US$50/
barrel would trigger transportation cost hike, which
in turn has the potential to put pressures on
performance of businesses, which raw materials are
based on imports. The textile and plastic industries
have the potential to come under pressure due to
soaring world oil prices because almost 90% of their
raw materials still depend on imports. Although direct
impacts of oil price hikes have not materialized yet,
several companies in the plastic industry have already
slowed down their factory performance and
undertaken efficiency efforts in several areas. In
addition, companies in the plastic industry plan to raise
their selling prices by 25%.
The airline industry will be the first to feel the
impact of world oil price hikes because these hikes
would trigger avtur price hikes, where avtur price
constitutes one of the components that determine
tariffs (35% up to 40% of the cost of an airline
company comes from avtur cost). This condition has
the potential to prompt operational cost to rise, while
on the other hand airline companies are facing price
war, which in the end would influence revenue.
There is a worry that this upward trend in world
crude oil prices that is predicted to continue until
end-2004, prompted by among others rising world demand
as several developing countries such as China and India
are advancing, upcoming summer season on the other
hemisphere, as well as sensitivity towards news of
violence in Iraq, would disrupt world oil supply.
Data as of end of July 2004 show that
non-performing loans of credits that have been extended
to the airline industry have reached Rp29,985 million
or 6,8% of total credits that have been extended to
this industry. Of these NPLs, 83% is owned by Bank
Danamon and 11% is owned by Bank Mandiri.
Although credits channeled to the airline industry have
only reached 0.09% of total credits channeled by the
banking industry as of end of June 2004, this industry»s
relatively high NPLs need to be closely watched,
Chart Box 2.1 Loan Classification of Airline Industry - July 2004
Source : Bank Indonesia,BPS
Current Special Mention Doubtful Loss
7 % 0 % 23 %
price hikes such as the airline companies or related
companies. In addition, Bank Indonesia and the
government (fiscal authority) need to intensify
coordination, among others in maintaining
assumptions on inflation rate and SBI interest rates in
line with market needs. considering that the uptrend of oil prices would
probably continue until end of 2004 and heavy tariff
war is still on going among airline companies.
In view of above development, banks are
expected to continuously increase their monitoring of
Chapter 3
1. STRUCTURE OF BANKING INDUSTRY
Indonesia»s financial system was yet dominated by
the banking industry (representing 90% of the financial
system»s total assets). The condition of the banking industry
itself was very much marked by the conditions of 15 large
banks (major banks), considering these banks dominated
the banking industry»s total assets (72.5%). Ten of these
large banks were recap banks.
Up to June 2004, number of banks was lower than
in previous report»s period. Due to the closure of two
small banks, it came to 137 banks with total assets
amounting to Rp1,185.7 trillion.
Indonesia»s banking industry still relied on credit
channeling and accumulation of public deposits and as
such the largest potential for instability would come from
these two sources. However, in terms of earning assets,
the share of credit itself was only 47.5% and the rest
comprised marketable securities (recap bonds and SBIs),
which had zero risk. Meanwhile, deposits were yet
dominated by short-term and corporate deposits, which
were extremely sensitive to interest rates.
Ten banks among the above-mentioned 15 large
banks were recap banks that were yet undergoing
consolidation. Therefore, the operational risks faced by
those banks were yet quite significant, considering that
there have been additions of new owners and
management, which could result in rising operational risks.
2. GENERAL PICTURE OF BANKING INDUSTRY
Stability of the financial system during semester I/
2004 was quite maintained with the support of the banks
as major players in controlling risks being faced, coming
both from internal as well as from external factors.
Chapter 3
Indonesia’s Banking Industry
During the said period, the banking industry faced
heavier pressures relative to the previous year due to yet
inconducive economic condition, exchange rate
weakening, world oil price hikes, and the general election.
In addition, during the same period, two small banks have
been closed and incidents of fraud have occurred in several
banks.
These pressures did not disturb financial system
stability because the related institutions were able to handle
the situation well. Bank Indonesia consistently continued
its efforts in maintaining the banking industry»s stability
by issuance of new regulations to strengthen the banking
system, which included among others reformulation of
the minimum reserve requirement (MRR) and net foreign
currency position, as well as planned implementation of
the Indonesian Banking Architecture.
Credit risk was quite under control and there were
no risk fluctuations that could significantly affect the
financial system»s stability. This is reflected by improving
credit quality marked by decreasing NPL ratio. In addition,
at the end of semester one recorded a quite large jump in
new credits and a decline in the rise of undisbursed loan
relative to the previous month.
Banking sector»s excess liquidity that was quite large
was gradually reduced by a new formulation in the MRR,
which could reduce potential for speculations. In addition,
the plan for phasing out the blanket guarantee needs to
be approached carefully because of its potential in reducing
public confidence in the banking industry.
On the other hand, market risk was quite moderate
despite exchange rate weakening and interest rate rise
by The Fed. Banking industry»s profile, particularly that of
report. It was yet at short position for the short-term
and as such was extremely susceptible to market risk as
well as liquidity risk. Meanwhile, opeational risk was yet
relatively high due to yet ineffective risk management
and good governance implementations, which have
allowed a few cases of fraud to occur. However, banking
industry profitability rose in line with rising credits. On
the other hand, capital declined due to a rise in
risk-weighted assets (RWA) resulting from rising credits.
However, this capital decline did not stir problems in the
banking sector because aggregate CAR was yet relatively
high, namely above 20%.
However, there were a few factors that needed close
attention, particularly credit risk and operational risk, which
had the potential for disturbing banking industry stability.
In the light of developments during the previous year
and economic prospects of semester II/2004, the banking
industry is projected to face heavier pressures. Stage 3 of
the general election is not expected to be a factor of
concern for businesses or the banking industry, considering
that stages 1 and 2 of the general election that has been
held during semester I/2004 has not caused fluctuations
in the banking sector. However, economic and banking
industry»s growths would be much influenced by
developments of world oil prices, rupiah stability, and
interest rates.
The rise in oil prices would raise production costs,
including transportation cost for businesses, which in the
end would raise prices. Should such a situation occurs in
a condition where there is no rise in public income,
business people would experience difficulty in paying off
their debts to banks, which in the end would rise banking
industry NPL.
3. CREDIT RISK
In the period of end December 2003 up to semester
I/2004, Indonesia»s bank credit risk was relatively under
control. This was marked by improving bank credit quality
as reflected by declining trend of NPL ratio. However,
starting semester II/2004 onwards, credit risk would again
rise due to high level of uncertainty coming from external
factor, namely yet inconducive domestic economic
condition, and pressures from international factor, namely
oil price hikes. In addition, the business and banking
sectors would be waiting for policy directions of the newly
elected government, which are expected to be announced
at the start of 2005.
In general, several main challenges, which would face
the banking industry in improving its credit quality in the
future, cover :
i. National economic condition that is not yet conducive
and rising world oil prices. In the long-run, these
would have an impact in raising production cost.
Currently, sea transportation tariffs for goods have
experienced a rise of 20%, both domestic as well as
international.
ii. Existence of a potential rising in credit interest rates
due to interest rate hikes by The Fed and several other
world central banks, which would indirectly influence
global economy, including Indonesia.
iii. Weakening of rupiah value, which would disturb the
performances of exports as well as domestic
businesses that use imported raw materials.
iv. Absorption capability of the real sector, particularly
the corporation sector, is still relatively low because
in general their restructuring process has not been
fully completed. Therefore, it is difficult to
significantly raise new credits. As an impact, new
credit channeling is dominated by small credits and
consumption credits, which cannot accelerate
growths of bank credit portfolio as well as the
economy.
v. There is a potential for a rise in NPLs in the future,
0 10 20 30 40 50 60 70 80 90 0 5 10 15 20 25
Des Dec Dec Dec Dec Dec Dec Jun Dec Jun
1996 1997 1998 1999 2000 2001 2002 2003 2003 2004
Loan (left) Interbank (right) Securities (left) SBI (left)
Percentage Percentage
In the short-term, the impact of oil price hikes would
not yet be realized by the business sector. However, the
size and duration of oil price hikes cannot be predicted
yet, including by APEC, because they are very much related
to issues of wars/terrorism and political instability in several
countries that are world largest oil suppliers.
On one hand, new credit1 rise and undisbursed loan2
decline, which have occurred in the last months of semester
I/2004, are sufficient to prompt bank credit as well as
economic growths. On the other hand, these will also
raise credit risk, which could reduce capitals, if a prudential
approach is not adopted. It is hoped that this credit rise
will not be temporary but will continue.
However, improving economies of Indonesia»s major
trading partners, such as the US, on the one hand and
China»s overheating economy on the other hand give an
opportunity for Indonesia to expand its exports, which in
turn would raise demand for investment and working
capital credits.
3.1. Development of Credits
Bank credit growth was yet influenced by sectors
and types that did not prompt economic growth, which
in nominal terms did not dominate. New credit
withdrawals were smaller than in the pevious year although
the last two months showed quite encouraging
development, which has prompted the share of credit to
surpass that of marketable securities and caused bank LDR
to rise.
Indonesia»s bank post-crisis earning asset composition
is marked by quite large share of recap bonds that has
zero risk as a result of the recapitalization program in 1998.
As of June 2004, bank earning assets rose by Rp29.7 trillion
(2.7%) from December 2003 position, particularly credits
and SBIs, which rose by 11.6% and 9.1%, respectively.
As of above position, credit rise reached Rp50.9
trillion, which particularly came from public funds mobilized
by the banking sector amounting to Rp24.2 trillion, a
decline in recap bonds (Rp19.6 trillion) and interbank
placements (Rp12.0 trillion). This growth prompted a rise
in the share of credit in produtive assets from 42.5% to
46.1%. This share of credit is the largest compared to the
shares of other types of earning assets in the post-crisis
period, which two months previously was yet dominated
by marketable securities (government bonds and SBIs).
The rise in credits resulted from the banking sector»s
efforts to continuously promote its intermediary function,
which prompted banking LDR to also rose to 46.4%.
This is reflected by the credit growth (y-to-y) of foreign
bank group, which was recorded as being negative in the
Chart 3.1 Earning Assets
1 New credits are credits withdrawn by debtors in the same months as the dates of the credit agreements.
2 Credit facilities made available by banks but not yet utilized by debtors.
Chart 3.2 Loans by Group Trillion Rp
State-owned Bank Private Bank
Foreign and Joint Venture Bank Regional Development Bank
1996 1997 1998 1999 2000 2001 2002 2003 2004
Chart 3.5
New Disbursed Loan 2002, 2003, 2004 0.0 0.2 0.4 0.6 0.8 1.0 1.2 1.4 1.6 1.8 2.0
Jan May Sep Jan May Sep Jan May Sep Jan May Sep Jan May
2000 2001 2002 2003 2004
Substandard Doubtful Loss
Trillion Rp.
previous report but started to show positive growth in
this reporting period. However, bank credit growth during
this period was yet supported by the domestic bank group.
Therefore, it can still be stated that marketable
securities still provide a safe and quite large source of
income for the banking sector because their risk do not
weigh as much as that of credits.
3.1.1 Consumption Credits
Despite its small share (9.7%), the quality of
consumption credits need to get special attention,
considering the growth of this type of credit has been
recorded to be the highest with a trend of rising NPLs.
Since the start of 2002 up to May 2004, consumption
credit NPLs have been recorded as being on the rise
although it has started to experience a decline, where as
of June 2004 it came to 2.4% with similar nominal value
as its December 2003 position of Rp2.9 trillion.
This high consumption credit growth relative to public
income growth requires a close attention in a situation of
yet inconducive economic condition. Economic condition
very much influences the performance of this type of credit,
particularly in a situation where there are occurrences of
company closures and employee discharges, considering
that the payoff for this type of credit relies on individual
income.
3.1.2 New Credits and Undisbursed Loans
Withdrawals of new credits were lower relative to
the previous year, however, the last two months showed
quite a significant rise. In addition, undisbursed loans (Uls)
was quite large relative to the previous year. However,
the large number of new credit withdrawals have caused
a decline in the rise of Uls. It is hoped that this positive
development would continue in order to support economic
growth.
The rise in credit portfolio was prompted by a rise in
withdrawals of new credits that have been approved and
withdrawn during 2004, which up to June have reached
Rp31.9 trillion, smaller compared to the same position in
2003 of Rp41.8 trillion.
Chart 3.4 NPL of Consumer Loan
Chart 3.3 Loan to Deposit Ratio
Trillion Rp Percent
Loan (left axis) Deposits (left axis) LDR (right axis)
0 10 20 30 40 50 60 70 80 90 100
1996 1997 1998 1999 2000 2001 2002 2003 2004
0 100,000 200,000 300,000 400,000 500,000 600,000 700,000 800,000 900,000 1,000,000 0 5,000 10,000 15,000 20,000 25,000
Jan Feb Mar Apr May Jun
2002
2003
Based on type of use, the largest extension of new
credits occurred in working capital credit (amounting
to 52.3%), while based on sector, it occurred in the
business services, trade, and industry sector. Meanwhile,
46.5% of new credits extended during 2004 was
channeled to small-to-medium size businesses.
However, the number of Uls for this type of credit and
this sector was also the highest. The percentage shares
of Uls by type of use and by sector are presented in the
following two Charts.
Most (91.6%) of bank Uls belonged to 25 banks
(13 large banks, including 3 state banks, 7 foreign banks,
4 foreign joint venture banks, and 1 other private bank).
3.3.1 Non Performing Loans
Improvement of non-performing loans (NPLs) has
reached a saturation point where bank NPLs declined with
a much lower magniture although credits continuously
rose. In addition, there is a concern that NPLs that has
reached a saturation point might reverse.
Credit quality is a reflection of bank credit risk. This
is indicated by developments of NPL ratios, both gross and
net. Position of bank NPLs at the reporting period was
quite high. This was due to economic condition that has
not fully recovered, which was tackled by the banking
sector through quite cautious implementation of its
intermediary function as well as through formation of quite
large reserve in anticipation of possible risk.
During the period of December 2003 up to June
2004, Indonesia»s bank credit quality improved as reflected
by a decline in gross and net NPL ratios. Gross NPL ratio
dropped from 8.21% to 7.54%, the smallest ratio since
the 1997/1998 banking crisis. Net NPL ratio also dropped
from 3.04% to 2.09% (Chart 3.8).
Chart III.7
Undisbursed Loan by Usage Chart 3.6
Undisbursed Loan by Sector
Chart 3.8 NPL Gross & Net
However, in nominal terms, NPLs also rose as the
result of yet inconducive economy. However, this rise was
relatively small compared to the rise in total credits. Bank
credits rose by 10.8%, while the rise of NPLs was only
1.8% (Table 3.1). Agriculture Electricity Transportation Others
Mining Construction Business Services Manufacture Trading Social Services
5% 2%
1% 4% 24%
33%
3%
15% 1%
12%
73.3% 14.7%
12.0%
Working Capital Loan Investment Loan Consumer Loan
Dec Jun Dec Jun Dec Jun Dec Jun Dec Jun Dec Jun Dec Jun
1997 1998 1999 2000 2001 2002 2003 2004
0 10 20 30 40 50 60
NPLs Gross NPLs Net
In the short-term, it is estimated that bank CAR
would not be influenced by the rise in credit risk,
considering that in general banks have formed reserves
that exceed requirements. A more conservative ratios are
NPLs to Equity and NPLs to Core Equity. As of June 2004,
these ratios came to 24.1% and 30.5%, which dropped
from their positions at December 2003 of 26.6% and
35.8%, respectively.
The largest NPLs yet belonged to the state bank
group, foreign bank group, foreign joint venture bank
group with ratios above that of the industry, a condition
that did not much change from the previous condition.
NPLs of the foreign bank group and foreign joint
venture bank group experienced a slight improvement