Evaluation of kMeans and fuzzy Cmeans segmentation on MR
images of brain
S. Madhukumara, , , N. Santhiyakumarib
Open Access funded by The Egyptian Society of Radiology and Nuclear Medicine Under a Creative Commons license
Show more
doi:10.1016/j.ejrnm.2015.02.008
Abstract
This paper does the qualitative comparison of Fuzzy Cmeans (FCM) and kMeans segmentation, with histogram guided initialization, on tumor edema complex MR images. The accuracy of any segmentation scheme depends on its ability to distinguish different tissue classes, separately. Hence, there is a serious prerequisite to evaluate this ability before employing the segmentation scheme on medical images. This paper evaluates the ability of FCM and kMeans to segment Gray Matter (GM), White Matter (WM), CerebroSpinal Fluid (CSF), Necrotic Focus of
Glioblastoma Multiforme (GBM) and the perifocal vasogenic edema from preprocessed T1 contrast axial plane MR images of tumor edema complex. The experiment reveals that FCM identifies the vasogenic edema and the white matter as a single tissue class and similarly gray matter and necrotic focus, also. kMeans is able to characterize these regions comparatively better than FCM. FCM identifies only three tissue classes whereas; kMeans identifies all the six classes. The experimental evaluation of kMeans and FCM, with histogram guided initialization is performed in Matlab®.
KEYWORDS
Glioblastoma multiforme; Necrotic focus; Vasogenic edema; Bilateral filter; Contrast limited adaptive histogram equilization
1. Introduction
Image segmentation is one of the most interesting and challenging problems in computer vision generally and medical imaging applications specifically. Segmentation partitions an image area or volume into nonoverlapping, connected regions, being homogeneous with respect to some signal characteristics (1). Segmentation approaches are subject to multiple challenges stemming from image noise, image inhomogeneities, image artifacts such as partial volume effect, and
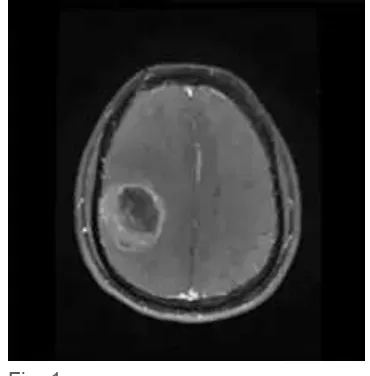
discontinuities of boundaries due to similar visual appearance of adjacent brain structures. A variety of segmentation techniques have been developed to address these challenges. Brain MR segmentation methods can be classified into three main categories: probabilistic and statistical based, atlasbased, and deformable modelbased techniques (2). Hence, there is a mandatory prerequisite to investigate the ability of the segmentation scheme to characterize the complete tissue classes, present in the image, separately, before employing any statistical segmentation frame work. MR images of tumor edema complexes exhibit homogenous intensity features between WM and edema and similarly between necrotic focus and GM, as evident in Fig. 1. This is an investigation of the ability of FCM and kMeans to characterize the GM, WM, CSF, necrotic focus, vasogenic edema and background present in preprocessed axial plane T1 contrast MR images of GBMedema complex.
Fig. 1.
Axial plane T1 contrast MRI of GBMedema complex. (Image Courtesy: Hind Labs, Kottayam Medical College Kerala).
Wen and Celebi (3) compared hard Cmeans and FCM clustering for color quantization. The results demonstrate that FCM is significantly slower than hard Cmeans, and that with respect to output quality, the former algorithm is neither objectively nor subjectively, superior to the latter. Panda et al. (4) tested the performances FCM and kMeans. Two distance measures such as Manhattan (MH) and Euclidean (ED) are used to note how these distance measures influence the overall clustering performance. The performance has been compared based on seven
parameters, sensitivity, specificity, precision, accuracy, run time, average intra cluster distance and inter cluster distance. Based on the experimental results, the paper concluded that both k Means and FCM performed well.
However, kMeans outperformed FCM in terms of computational efficiency. FCMMH
combination produced most compact clusters, while kMeansED yielded most distinct clusters. In Etehadtavakol et al. (5), two color segmentation techniques, kMeans and FCM for color segmentation of infrared (IR) breast images are modeled and compared. kMeans algorithm generated empty clusters. The fuzzy nature of IR breast images helps the FCM segmentation to provide more accurate results with no empty cluster.
Yin et al. (6) is a comparison of kMeans and FCM performance for automated determination of the Arterial Input Function (AIF). The results demonstrate that kMeans analysis can yield more accurate and robust AIF results, although it takes longer to execute than the FCM. Authors consider that this longer execution time is trivial relative to the total time required for image manipulation in a PACS setting, and is acceptable if an ideal AIF is obtained. Therefore, the literature suggested, the kMeans method is preferable to FCM in AIF detection.
Sueli et al. (7) presented a comparison among nonhierarchical and hierarchical clustering algorithms including SOM (SelfOrganization Map) neural network and FCM. Data were
simulated, considering correlated and uncorrelated variables, nonoverlapping and overlapping clusters with and without outliers. A total of 2530 data sets were simulated. The results showed that FCM had a very good performance in all cases being very stable even in the presence of outliers and overlapping. All other clustering algorithms were very affected by the amount of overlapping and outliers. SOM neural network did not perform well in almost all cases being much affected by the number of variables and clusters. The traditional hierarchical clustering and k Means methods presented similar performance.
In Ghosh and Dubey (8), centroid based kMeans and representative object based FCM
clustering algorithms are compared. These algorithms are applied and performance is evaluated on the basis of the efficiency of clustering output. The numbers of data points as well as the
number of clusters are the factors upon which the behavior patterns of both the algorithms are analyzed. Literature observed FCM produces close results to kMeans clustering but it still requires more computational time than kMeans.
Wang and Garibaldi (9) applied kMeans and FCM to cluster a lymph node tissue section which had been diagnosed with metastatic infiltration. Each cluster algorithm was run 10 times as different initialization states may lead to different clustering results. The performance of the two algorithms was compared by subjectively altering the number of clusters from 2 to 9 and analyzed the results using falsecolor images which are produced as a function of the spatial coordinates on the tissue section. In the initial stages of this experiment, it was observed that the ranges of the first three principal components were too small and may lead to small objective function values in FCM. Therefore, the minimal amount of improvement must be set to a small enough value to allow the cluster center positions to improve; otherwise the iteration will stop prematurely. After
adjusting this setting, the performance of FCM was significantly better. The results show that FCM can separate the major different tissue types using just a small number of clusters, whereas k Means is only able to separate them if a larger cluster number is used.
It seems the segmentation accuracy of FCM and kMeans is image dependent. The literatures are not unanimous regarding their opinion about the performance of kMeans and FCM. This paper proceeds through the specification of test images, preprocessing, mathematical formulation of k Means and FCM. Eventually, qualitative evaluation of segmentation results of both the algorithm, in terms of number of tissue classes identified and the accuracy of clustering are furnished.
2. Materials and methods
Axial Plane T1 contrast enhanced (Series: AX T1 SE FS + C, Spin Echo Sequence (SE)) MR images (courtesy: Hind Labs, Govt. Medical College Kottayam, Kerala) were selected for the experimental evaluation of kMeans and FCM. The specification of MR equipment is;
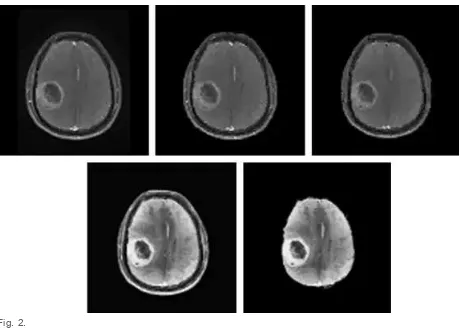
Manufacturer: GE Medical Systems, Model Name: Signa HDxt, Acquisition Type: 2D and 1.5T field strength. Experimental evaluation of FCM and kMeans was performed on Matlab®, (Version: 7.12.0.635 (R2011a)) Image Processing Tool Box. The preprocessing includes elimination of noisy background, restoration with bilateral filter(10) contrast enhancement with Contrast Limited Adaptive Histogram Equalization (CLAHE) (11) and skull stripping. Fig. 2 shows the output images at various stages of preprocessing. FCM (12) is based on minimizing an
objective function, with respect to fuzzy membership ‘U’, and set of cluster centroids, ‘V’.
1
Fig. 2.
Original image, background eliminated image, restored image after bilateral filtering, contrast enhanced image after CLAHE and skull stripped image.
In (1)X = {x1, x2, …. xj … xN} is a p × N data matrix, where, p represents the dimension of
each xj “feature” vector, and N represents the number of feature vectors (pixel numbers in the image). ‘C’ is the number of clusters. Uij U (p,N,C) is the membership function of vector xj to the ith cluster, which satisfies uij ∈ [0, 1] and,
The membership function can be expressed as,
V = {v1, v2 … vi … VC} is a p × C matrix and denotes the cluster feature center.
m ∈ (1, ∞) is a weighting exponent on each fuzzy membership, which controls the degree of
fuzziness. d2(xj, vi) is a measurement of similarity between xj and vi.
||.|| can be either Euclidean distance or one of its generalizations as Mahalanobis distance. Euclidian metric is used in this experimental study. Degree fuzziness was set to two. It was observed that variations in degree of fuzziness did not have substantial influence on
segmentation outcome. The feature vector ‘X’ in the MR image represents the pixel intensities, so p = 1. ‘C’ is the number of tissue classes in the preprocessed MR image and cluster centers in ‘V’ are the mean intensity of tissue classes, derived from the histogram guided initialization. The FCM algorithm iteratively optimizes Jm(U, V) with the continuous update of ‘U’ and ‘V’, until |U(l+1) − U(l)| ε where, ‘l’ is the number of iterations and ‘ε’ is the user defined threshold or
Figure options
⊆
2
3
4
5
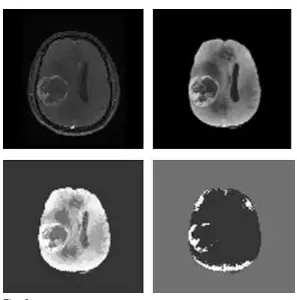
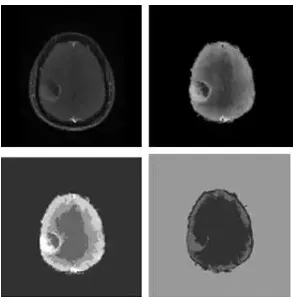
termination criteria. ‘ε’ was set to 0.001 in this experiment. The number of tissue classes ‘C’ is six, GM, WM, CSF, necrosis, enhancing edema and background as visible in Figs. 3 and 4. The CSF is absent in the axial slice shown in Fig. 5 so that the number of tissue classes is five.
Fig. 3.
Raw MR image 1 preprocessed image, clustered classes with kMeans and clustered classes with FCM.
Fig. 4.
Raw MR image 2 preprocessed image, clustered classes with kMeans and clustered classes with FCM.
Figure options
Fig. 5.
Raw MR image 3, preprocessed image, clustered classes with kMeans and clustered classes with FCM.
The mean intensity of tissue classes for initializing both FCM and kMeans is derived from a histogram guided method. In histogram guided initialization, let μ be the vector of mean intensity of ‘k’ tissue classes present in the preprocessed image,
and ‘j’ be an arbitrary sequence
The range of pixel intensities or the interval between maximum and minimum intensities in the preprocessed MR image is divided into ‘k’ intensity bins, with k + 1 intensity points between the maximum and minimum intensity. These intensity points,
where IH is the maximum intensity in the preprocessed MR image and IL, the minimum intensity. As pointed earlier, the number of tissue classes ‘k’ is six, GM, WM, CSF, necrosis, enhancing edema and background.
The mean of pixel intensities present in a bin represents the mean intensity of tissue class
corresponding to that bin. ‘i’ is the intensities present in the jth bin and ni is the histogram of these intensities.
In kMeans clustering (13), let the initialized cluster centers at the first iteration be,
The pixel intensities actually present in the preprocessed MR image are redistributed to one of the classes or clusters such that,
Figure options
6
μ={μ
1,μ
2,μ
3….μ
k}
7
j={0,1,2,3….k}
8
9
10
μ(1)={μ
1(1),μ
2(1),μ
3(1),…,μ
k(1)}
where I = 1, 2, 3, …, k and j = 1, 2, 3, …, k but i ≠ j and Cj is the cluster or tissue class with class mean or cluster center μj. Generalizing (11), at the nth iterative step,
Before the (n + 1)th iteration, class means or cluster centers are updated, such that the sum of squared distances from all samples or intensities in the tissue class or clusterCj(n) to the cluster center is minimized. In fact, new cluster center is just mean intensity of the tissue class Cj,
where Nj is the number of samples in the cluster Cj at nth iteration Cj(n) otherwise Nj is the number of intensities in the jth tissue class in the preprocessed MR image. The algorithm converges when the condition (14) is satisfied and tissue class mean updating would be terminated.
After the class mean recalculation has been converged, intensities in the image is redistributed to one of the clusters, obeying (12), so that the output mask contains tissue class labels from one to k.
3. Results and discussion
The ability of kMeans and FCM to classify the tissue classes present in the real MR images is qualitatively analyzed. The first raw MR image, preprocessed image, clustered image with k Means and FCM, respectively are showed in Fig. 3. Figs. 4 and 5correspond to second and third test images. First test image in Fig. 1 and second one inFig. 2 contain five tissue types and background. The morphological structures present in first and second test images are WM, GM, CSF, necrotic focus and edema. But, CSF is absent in the third test image.
From Fig. 3, Fig. 4 and Fig. 5 it is apparent that FCM is able to identify only three classes, including the background, in all the test images. FCM consider edema and certain parts of WM as a single tissue class. Similarly, FCM clubs GM, CSF and necrotic focus into a single tissue class. In other words, FCM produces empty clusters. Even if the kMeans identifies all the tissue classes, certain parts of WM are clubbed with vasogenic edema because of their homogenous intensity features. This happens to certain regions of necrotic focus, CSF and GM also. Perhaps, semiautomated methods like deformable model based segmentation may be considered as an alternative
technique. In deformable model based techniques, a rough margin of the Region of Interest (ROI) is marked manually so that there is no burden of identifying distinct classes present in the image to be processed.
4. Conclusion
The efficacy of FCM and kMeans, with histogram guided initialization, was analyzed on T1 contrast axial plane MR images of GBMedema complex. FCM could identify two tissue classes and background. It merged GM, CSF and necrotic focus into one class and WM and perifocal edema into another. FCM produced three empty clusters in first two test images and two in the last one. kMeans could identify CSF, GM, WM, necrosis, edema and background region. But, certain parts of the WM were clustered with enhancing edema and vice versa. This cross talk occurs between CSF, necrosis and GM also. This happens as the intensity features of the edema and certain parts of WM are perfectly equal. Similarly, certain parts of CSF, GM and necrosis also shares homogenous intensity features. Fully automated segmentation of GBM, hence would be intricate and intensity based segmentation would not be viable for MR images of GBMedema complex.
12
13
1
Conflict of interest
None.
Acknowledgement
The authors would like to thank Dr. Jose Tom, Professor & Head, Department of Radiotherapy, Government Medical College, Kottayam, Kerala, Dr. Unni. S. Pillai, Department of Oncology, The Jawaharlal Institute of Postgraduate Medical Education & Research (JIPMER), Puducherry and Dr. GowriShanker, Hindlab, Govt. Medical College, Kottayam, for their incessant involvement in this endeavor.
References
A. Elnakib, G. Gimel’farb, J.S. Suri, A. ElBaz
Medical image segmentation: a brief survey
Handbook of multi modality stateoftheart medical image segmentation and registration methodologies, vol. 2(1)SpringerVerlag, New York (2011), pp. 1–39
View Record in Scopus | Full Text via CrossRef | Citing articles (16)
A. Alansary, A. Soliman, F. Khalifa, A. Elnakib, M. Mostapha, M. Nitzken, et al.
MAPbased framework for segmentation of MR brain images based on visual appearance and prior shape
MIDAS J, 1 (2013), pp. 1–13 <http://hdl.handle.net/10380/3440>
View Record in Scopus | Citing articles (4)
Q. Wen, M.E. Celebi
Hard versus fuzzy cmeans clustering for color quantization
EURASIP J Adv Signal Process, 2011 (2011), p. 118
View Record in Scopus | Full Text via CrossRef | Citing articles (7)
S. Panda, S. Sahu, P. Jena, S. Chattopadhyay
Comparing fuzzyC means and Kmeans clustering techniques: a comprehensive study
Adv Intell Soft Comput, 166 (2012), pp. 451–460
View Record in Scopus | Full Text via CrossRef | Citing articles (5)
M. Etehadtavakol, S. Sadri, E.Y. Ng
Application of K and fuzzy cmeans for color segmentation of thermal infrared breast images
J Med Syst Arch, 34 (2010), pp. 35–42
View Record in Scopus | Full Text via CrossRef | Citing articles (35)
J. Yin, H. Sun, J. Yang, Q. Guo
Comparison of Kmeans and fuzzy cmeans algorithm performance for automated determination of the arterial input function
PLoS One, 9 (2) (2014), p. e85884
Full Text via CrossRef
Sueli A. Mingoti, Joab O. Lima
Comparing SOM neural network with Fuzzy cmeans, Kmeans and traditional hierarchical clustering algorithms
Eur J Oper Res, 174 (2006), pp. 1742–1759
9
10
11
12
13
Comparative analysis of Kmeans and fuzzy Cmeans algorithms (IJACSA)
Int J Adv Comput Sci Appl, 3 (2013), pp. 45–47
View Record in Scopus | Citing articles (1)
Wang XY, Garibaldi JM. A comparison of fuzzy and nonfuzzy clustering techniques in cancer diagnosis; 2005 <http://ima.ac.uk/papers/wang2005.pdf>.
Tomasi C, Manduchi R. Bilateral filtering for gray and color images. In: Proceedings of the 1998 IEEE international conference on computer vision. Bombay, India; 1998.
Karel Zuiderveld
Contrast limited adaptive histogram equalization, Graphic Gems IVAcademic Press, San Diego (1994) p. 474–85
S. Shen, W. Sandham, M. Granat, A. Sterr
MRI fuzzy segmentation of brain tissue using neighborhood attraction with neuralnetwork optimization
IEEE Trans Inform Technol Biomed, 9 (2005), pp. 459–467
View Record in Scopus | Full Text via CrossRef | Citing articles (172)
Ray S, Turi RH. Determination of number of clusters in Kmeans clustering and application in colour image segmentation. In: Proc 4th international conference on advances in pattern recognition and digital techniques (ICAPRDT’99). Calcutta, India; 1999. p. 137–43.
Peer review under responsibility of Egyptian Society of Radiology and Nuclear Medicine. Available online 24 March 2015
Corresponding author. Tel.: +91 9495431623.