COMPARISON OF THE SPECTRAL PROPERTIES OF PANSHARPENED IMAGES
GENERATED FROM AVNIR-2 AND PRISM ONBOARD ALOS
M. Matsuoka a *
a Natural Science Cluster, Kochi University, 200 Monobe-otsu, Nankoku, Kochi, 783-8502 Japan -
Commission VII, WG VII/6
KEY WORDS: Pansharpening, Fusion, ALOS, PRISM, AVNIR-2, Comparison
ABSTRACT:
A considerable number of methods for pansharpening remote-sensing images have been developed to generate higher spatial resolution multispectral images by the fusion of lower resolution multispectral images and higher resolution panchromatic images. Because pansharpening alters the spectral properties of multispectral images, method selection is one of the key factors influencing the accuracy of subsequent analyses such as land-cover classification or change detection. In this study, seven pixel-based pansharpening methods (additive wavelet intensity, additive wavelet principal component, generalized Laplacian pyramid with spectral distortion minimization, generalized intensity-hue-saturation (GIHS) transform, GIHS adaptive, Gram–Schmidt spectral sharpening, and block-based synthetic variable ratio) were compared using AVNIR-2 and PRISM onboard ALOS from the viewpoint of the preservation of spectral properties of AVNIR-2. A visual comparison was made between pansharpened images generated from spatially degraded AVNIR-2 and original images over urban, agricultural, and forest areas. The similarity of the images was evaluated in terms of the image contrast, the color distinction, and the brightness of the ground objects. In the quantitative assessment, three kinds of statistical indices, correlation coefficient, ERGAS, and Q index, were calculated by band and land-cover type. These scores were relatively superior in bands 2 and 3 compared with the other two bands, especially over urban and agricultural areas. Band 4 showed a strong dependency on the land-cover type. This was attributable to the differences in the observing spectral wavelengths of the sensors and local scene variances.
1. INTRODUCTION
A large number of Earth observation satellites have been launched, and huge quantities of scenes have been archived over the last few decades. Integrated use of this information through data fusion helps both understanding and decision making in land surface management. The data-fusion technical committee of the Geoscience and Remote Sensing Society (GRSS) of the IEEE has organized data-fusion contests in recent years (GRSS, 2012). Pansharpening is one major technique in image fusion for the generation of higher spatial resolution multispectral images. It involves the synthesis of lower resolution multispectral images and higher resolution panchromatic images. A wide variety of pansharpening methods has been proposed using optical, synthetic aperture radar (SAR), light detection and ranging (LiDAR), and other geographical data. The major concern in the quality evaluation of pansharpened images is the preservation of the spectral characteristics of multispectral data because it affects subsequent applications such as the land-cover classification, change detection, and the extraction of physical properties.
The Advanced Land Observing Satellite (ALOS) has a multispectral sensor, the Advanced Visible and Near Infrared Radiometer type 2 (AVNIR-2); a panchromatic sensor, the Panchromatic Remote-sensing Instrument for Stereo Mapping (PRISM); and a SAR, the Phased Array type L-band Synthetic Aperture Radar (PALSAR) (EORC/JAXA, 2012). ALOS was launched on January 24, 2006, and completed its operation on May 12, 2011. It acquired 6.5 million image scenes by observing all over the Earth for 5 years (JAXA, 2011).
The aims of this study are to apply the existing pansharpening methods to AVNIR-2 and PRISM for the synergic use of these data and to evaluate the spectral characteristics of pansharpened images both qualitatively and quantitatively.
2. DATA AND METHOD 2.1 Data
AVNIR-2 is a multispectral sensor with four observation bands in the visible and near-infrared spectral region. The spatial resolution is 10 m, and the swath width is 70 km at the nadir. It can change the observation angle 44 degrees to the cross-track direction. PRISM is a panchromatic radiometer in the visible wavelength with 2.5-m spatial resolution. It has three independent optical systems for viewing nadir, forward, and backward, producing a stereoscopic image along the satellite track. It has an observational swath width of 70 km or 35 km, depending on the operation mode. The characteristics of AVNIR-2 and PRISM are summarized in Table 1.
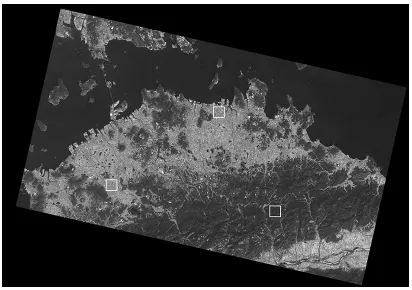
Scenes over Kagawa, Japan, observed on April 7, 2009, were used in this study (Figure 1). PRISM in 70-km observation mode was ortho-rectified with a spatial resolution of 2.5 m by means of a rational polynomial coefficients (RPC) model combined with interpolated digital elevation and geoid models supplied by the Geospatial Information Authority of Japan (GSI, 2012). AVNIR-2 (nadir observation) was also rectified to the same map projection, but with a resolution of 10 m. The geometric error of AVNIR-2 was compensated in this process by image-to-image matching with PRISM. Radiometric corrections were not applied to either dataset. Three types of land cover (urban, agricultural, and forest) were selected in the scene, with image size 200 × 200 pixels, to assess the quality of pansharpened images. These areas are also shown in Figure 1.
Figure 1. Study area
2.2 Pansharpening Methods
Seven kinds of pansharpening methods were adopted. Three were based on a multi-resolution analysis, three on component substitution, and one on modulation-based fusion techniques (Zhang, 2010).
Additive Wavelet Intensity (AWI) (Núñez et al., 1999, González-Audícana et al., 2005): The basic idea of this method is to insert the spatial detail of the panchromatic (PAN) image into the intensity component of the multispectral (MS) image that gathers most of its spatial information. This is in contrast to the intensity-hue-saturation (IHS) transformation pansharpening method, where this component is replaced by the whole panchromatic image (González-Audícana et al., 2005). The processing steps in this study are as follows:
(1) An IHS transform is applied to the red-green-blue (RGB)
(4) These wavelet planes are added to the intensity image. (5) An inverse IHS transform is applied to derive the
pansharpened RGB component.
For the forward and inverse IHS transforms, the triangle model by Smith (1978) was adopted in this study. Because the IHS transformation is applicable only for three of the four AVNIR-2 bands, the AWI was performed for both true color (R:G:B = band 1:2:3) and false color (R:G:B = band 4:3:2) compositions. These results are referred as AWI-123 and AWI-432, respectively.
Additive Wavelet Principal Component (AWPC) (González-Audícana et al., 2005): This method is basically the same as the AWI, except that the first principal components derived by principal component analysis using four bands are used instead of the intensity component of the IHS transform in AWI.
Generalized Laplacian Pyramid with Spectral Distortion Minimization (GLP-SDM) (Aiazzi et al., 2002a, 2002b, 2005): The method combines the generalized Laplacian pyramid, one of the multi-resolution analyses, and the detail-injection model of spectral distortion minimizing. Spatial detail is extracted from the difference between the original and smoothed PAN images and added to the expanded MS image. The weighting factor is derived from the ratio of PAN and MS images. The simplest three-taps pyramid-generating low-pass filter (i.e. bilinear interpolation) and a cascade of two reduction steps were adopted in this study for computational simplicity. This method can be applied on a band-by-band basis, although others are implemented to all bands at one time.
Generalized Intensity-Hue-Saturation transform (GIHS) (Tu et al., 2004): GHIS is an expansion of fast IHS fusion methods to more than three channels of a color image. The intensity component is derived from a linear sum of each band with a set of weighting coefficients. The difference between the PAN and intensity component is added to each band of the MS image to improve the spatial resolution.
GIHS Adaptive (GIHSA) (Tu et al., 2004, Aiazzi et al., 2007): This method is almost the same as the GHIS, but weighting coefficients are determined by scenes based on a linear regression of the PAN image by the MS bands.
Gram–Schmidt spectral sharpening (GS) (Laben et al., 2000, Aiazzi et al., 2007): The method uses Gram–Schmidt orthogonalization to enhance the spatial resolution of the MS image. The steps adopted in this study are:
(1) A lower spectral resolution PAN image (the same as the MS image) is derived by spatial averaging of 4 × 4 pixels of the original PAN image.
(2) The modified Gram–Schmidt transformation is performed on the lower PAN image together with the MS image. The lower spatial resolution PAN image is employed as the first band in the GS transformation
(3) The statistics of the original PAN image are adjusted to set of bands to produce the pansharpened MS images.
Block-based Synthetic Variable Ratio (Block-SVR) (Zhang et al., 2010): This is a technique based on multiple linear regression of blocks (i.e., square regions of pixels) to fuse the images. Multiplying the ratio of the original and synthesized PAN images (the latter is derived by multiple regression of the PAN image by MS bands) derives the pansharpened MS band. The original SVR performs multiple regressions by image base. In other words, all pixels in the image are used to derive a single set of coefficients, but the block-based regression is modified in this method. The steps are as follows:
(1) Low resolution MS images are resampled (expanded) to the same size as the PAN image.
(3) Linear multiple parameters are calculated through multiple linear regression of the pixels in the blocks. (4) The pixels in the central block are pansharpened by the
SVR scheme and regression coefficients. (5) Steps (2)–(4) are repeated for all blocks.
In this study, one block is composed of 16 (4 × 4) pixels, and the number of blocks used in regression is 7 × 7.
2.3 Methods of Quality Assessment
Because the spatial resolution of AVNIR-2 and PRISM were originally 10 and 2.5 m, respectively, the pansharpened image could have a resolution of 2.5 m. It is difficult, however, to assess the quality of images at this resolution because of a lack of reference MS data. Therefore, the spatial resolution of the input images was degraded by a factor of four (to 40 and 10 m) by simple averaging of 4 × 4 pixels. Then, a pansharpened image of 10-m resolution was generated. The results were compared with the original MS data of AVNIR-2.
Qualitative and quantitative assessments were used to evaluate the results. In the qualitative assessments, the pansharpened results were compared with the original images by means of visual interpretation and scatter plots of the image digital numbers. In quantitative assessments, three frequently used statistics, the correlation coefficient, erreur relative globale adimensionnelle de synthèse (ERGAS, relative global dimensional synthesis error) (Wald, 2000), and Q index (Wang and Bovik, 2002), were adopted (Alparone et al., 2004, Cetin and Musaoglu, 2009, Otazu et al., 2005, González-Audícana et al., 2004). The ERGAS, given in equation 1, has lower values for better quality. Wald (2000) stated that a good quality is achieved when the index is less than 3.
,
(1)
where h = the spatial resolution of the PAN image l = the spatial resolution of the MS image N = the number of spectral bands (Bi)
Mi = the mean of each spectral band
RMSE = root mean square error between each band of the original and pansharpened images
The Q index models the difference between two images as a combination of three different factors: the loss of correlation, the luminance distortion, and the contrast distortion (Otazu et al., 2005). Q ranges from -1 to 1; a higher value indicates better quality. Q indices were calculated using a sliding window approach, with window sizes of 128 × 128 used for each band. Here we used the expression
,
(2)
where x ,y = the mean of 10 m resolution original (x) and pansharpened (y) images
σx2,σy2 = variance of x and y
σxy = covariance between x and y.
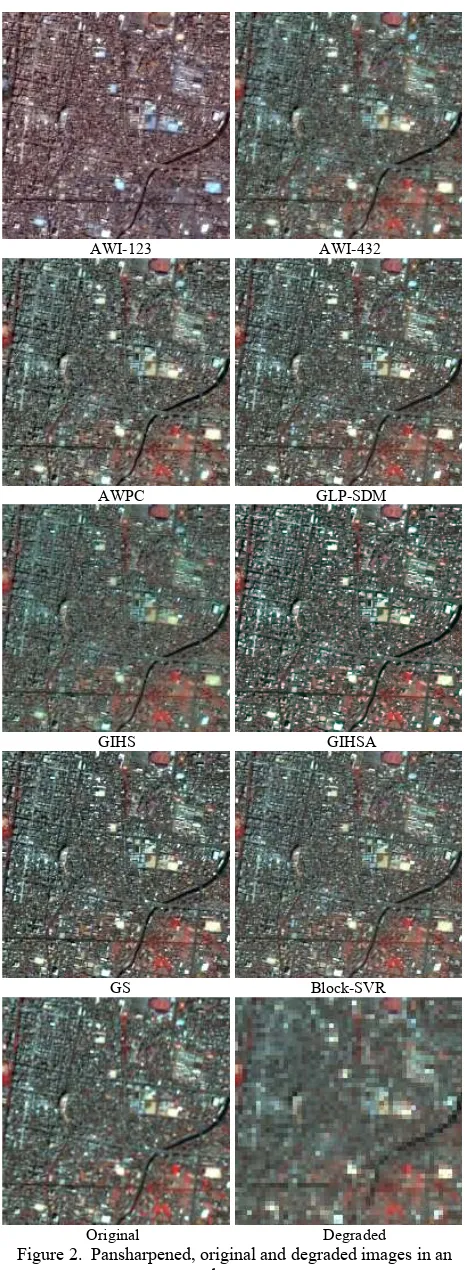
AWI-123 AWI-432
AWPC GLP-SDM
GIHS GIHSA
GS Block-SVR
Original Degraded Figure 2. Pansharpened, original and degraded images in an
urban area
3. RESULTS AND DISCUSSIONS
original (i.e., 10-m resolution) AVNIR-2 image. The images are shown in false color composition, except the AWI-123, which is in true color composition.
In urban areas, most of the methods produce relatively higher contrast than the original MS data. The edges of buildings, roads, and water are all sharpened to some degree, especially in the AWPC, GLP-SDM, GIHSA, GS, and Block-SVR data. In GIHS, the brightness is decreased, particularly for bright objects such as roads and buildings. The AWI showed the closest appearance to the original image.
AWI-123 AWI-432 AWPC
GLP-SDM GIHS GIHSA
GS Block-SVR Original Figure 3. Pansharpened and original images in an agricultural
area
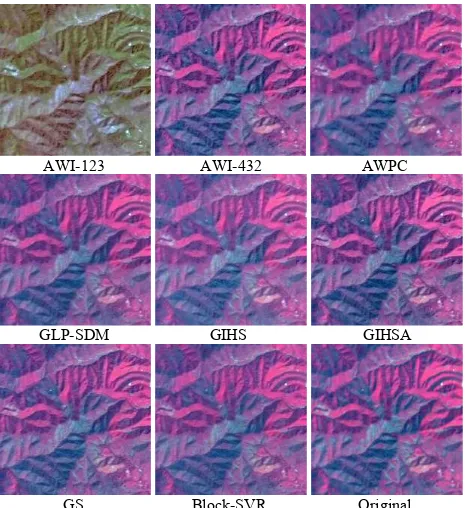
AWI-123 AWI-432 AWPC
GLP-SDM GIHS GIHSA
GS Block-SVR Original Figure 4. Pansharpened and original images in a forest area
In agricultural areas, bright red farm fields were degraded in brightness in all methods. In other words, a larger digital number for band 4 (near-infrared wavelengths) resulted in a larger decrease in brightness. This is also clear in the scatter plots of original and pansharpened images, as shown in Figure 5. Correlation coefficients of each scatters are shown in Table 2. Similarities between the pansharpened images and the original are greater in bands 2 and 3 but relatively poor in bands 1 and 4. A larger digital number (over 100) resulted in a peak at or below ~100, especially in band 4. Excessive enhancements of contrast, as in urban areas, were also recognized in the GLP-SDM, GIHSA, GS, and Block-SVR data.
AWI-123 AWI-432
AWPC GLP-SDM
GIHS GIHSA
GS Block-SVR
Figure 5. Scatter plots of original and pansharpened images in an agricultural area (horizontal: original, vertical:
pansharpened)
that lower local variances of pixel values in both MS and PAN images caused smooth and similar spectral characteristics for all methods.
3.1 Quantitative Assessments
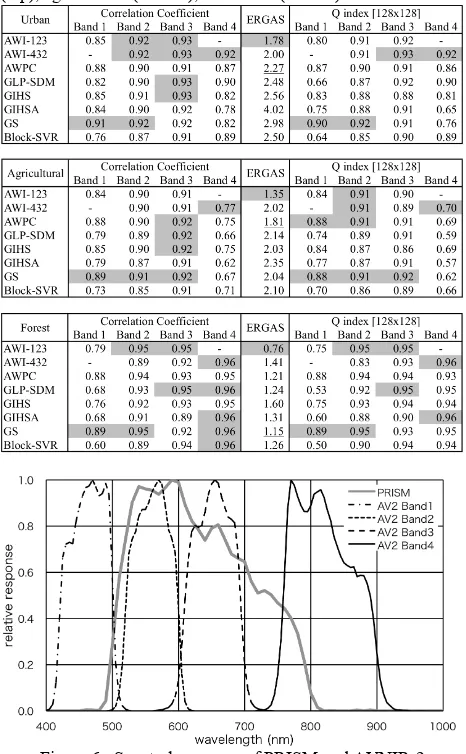
The statistical properties of each pansharpening method are shown in Table 2 for each land cover type. The highest scores among the methods are shaded in each area. In the correlation coefficient (CC), higher values (around 0.9) were acquired in bands 2 and 3 for all areas and methods. In band 1, in contrast, the CCs were relatively lower than bands 2 and 3, ranging from 0.60 to 0.91. Higher values in band 1 were derived in urban areas, and lower values were found in forest areas. The GS data showed the best value in band 2 for all land cover types. In band 4, much higher CCs (0.95 to 0.96) were derived for forest area in all methods. However, agricultural areas showed CCs ranging from 0.62 to 0.77 (refer to band 4 in Figure 5). The AWI-432 data showed the highest values in band 4 in all areas. The GS data counted eight of the highest values among 12 cases, whereas the AWI-432 data had five. These methods had the advantage from the viewpoint of the correlation coefficient.
Most of the ERGAS values were less than 3, indicating high-quality images. Higher values were derived in forest areas compared with urban and agricultural areas. The AWI-123 data showed the highest values among the methods. One reason was that all bands used in this method had higher correlations, i.e., PRISM and bands 1 to 3 of AVNIR-2 had spectral responses in visible wavelengths. Within the methods applicable for four data bands (i.e., other than AWI), AWPC and GS showed the higher values (underlined).
The Q index showed a similar trend to the correlation coefficient. It was higher in bands 2 and 3 and lower in band 1. In case of band 4, it was higher in forests and lower in agricultural areas. One of the reasons for these features was the spectral characteristics of the sensors. Figure 6 shows the relative spectral response functions of PRISM and AVNIR-2. The spectral responses of bands 2 and 3 of AVNIR-2 overlapped, in contrast to those of bands 1 and 4. This resulted in higher correlation coefficients and Q indices in bands 2 and 3. In the case of band 4, the situation was rather different because it observes at near-infrared wavelengths, where vegetation shows much higher reflectance. In general, the spectral characteristics of the near-infrared images were dissimilar to those of visible images, resulting in lower correlation. They also depended heavily on the existence and activity of vegetation. This meant that image similarity had wide variation on both local and large scales. This might be the reason that Q indices in band 4 were higher in the forest, where local variation was low (i.e., smooth), but lower in agricultural areas, where there was greater local variation due to vegetated/non-vegetated fields, narrow roads, and so on. For the same reason, the values of GIHSA did not show improvements over those for GIHS in this study. This is in contrast to the result by Aiazzi (2007) derived using IKONOS, for which panchromatic bands had sensitivity in both the visible and near-infrared wavelengths.
Of the seven tested methods, GS and AWI-432 showed better results in the evaluation by correlation coefficient and Q index. Meanwhile, AWI-123, AWPC, and GS had the advantage in ERGAS. These methods showed relatively higher values even in bands 1 and 4, where PRISM had little sensitivity.
Table 2. Correlation coefficient, ERGAS, and Q index of urban (top), agricultural (middle), and forest (bottom) areas.
Figure 6. Spectral response of PRISM and AVNIR-2
4. CONCLUSIONS
Acknowledgements
The ALOS data were provided by the Research Announcement (RA) of the ALOS Science Program of JAXA. This work was supported by KAKENHI (23380143, 22710011).
References
Aiazzi. B., Alparone, L., Baronti, S., and Garzelli, A., 2002a. Context-driven fusion of high spatial and spectral resolution images based on oversampled multiresolution analysis. IEEE Geoscience and Remote Sensing Letters, 40(10), pp. 2300-2312.
Aiazzi, B., Alparone, L., Baronti, S., Pippi, I., and Selva, M., 2002b. Generalized Laplacian Pyramid-Based Fusion of MS + P Image Data with Spectral Distortion Minimization, ISPRS Commission III, Symposium.
http://www.isprs.org/proceedings/XXXIV/part3/papers/paper08 3.pdf (24 Jun. 2011).
Aiazzi, B., Baronti, S., Garzelli, A., Santurri, L., and Selva, M., 2005. Spatial Enhancement of TIR ASTER data via VNIR images and Generalized Laplacian Decomposition. Proceedings of 4th EARSeL Workshop on Imaging Spectroscopy, pp. 489-500.
http://www.earsel.org/workshops/IS_Warsaw_2005/papers/Met hods_Data_Processing/52_Aiazzi_489_500.pdf (10 Jul. 2011).
Aiazzi, B., Baronti, S., and Selva, M., 2007. Improving Component Substitution Pansharpening Through Multivariate
Regression of MS+Pan Data. IEEE Transactions on
Geoscience and Remote Sensing, 45(10), pp. 3230-3239.
Alparone, L., Baronti, S., Garzelli, A., and Nencini, F., 2004. A global quality measurement of pan-sharpened multispectral imagery. IEEE Geoscience and Remote Sensing Letters, 1(4), pp. 313-317.
Cetin, M., and Musaoglu, N., 2009. Merging hyperspectral and panchromatic image data: qualitative and quantitative analysis. International Journal of Remote Sensing, 30(7), pp. 1779-1804.
EORC/JAXA (Earth Observation Research Center, Japan Aerospace Exploration Agency), 2012. Advanced Land Observing Satellite (ALOS) website.
http://www.eorc.jaxa.jp/ALOS/en/index.htm (3 Jan. 2012).
Geospatial Information Authority of Japan (GSI) website. 2012. http://www.gsi.go.jp/kiban/index.html (in Japanese) (3 Jan. 2012).
González-Audícana, M., Saleta, J. L., Catalán, R. G., and García, R., 2004. Fusion of multispectral and panchromatic images using improved IHS and PCA mergers based on wavelet
decomposition. IEEE Transactions on Geoscience and Remote
Sensing, 42(6), pp. 1291-1299.
González-Audícana, M., Otazu, X., Fors, O., and Seco, A., 2005. Comparison between Mallat's and the ‘à trous’ discrete wavelet transform based algorithms for the fusion of multispectral and panchromatic images. International Journal of Remote Sensing, 26(3), pp. 595-614.
GRSS, 2012. Data Fusion Contest - Geoscience and remote sensing society, International Institute of Electrical and Electronic Engineers (IEEE).
http://www.grss- ieee.org/community/technical-committees/data-fusion/data-fusion-contest/ (6 Jan. 2012).
JAXA, 2011. DAICHI (ALOS) Operation Completion. JAXA press release.
http://www.jaxa.jp/press/2011/05/20110512_daichi_e.html (30 Dec 2011).
Laben, C. A., Brower, B. V., 2000. Process for enhancing the spatial resolution of multispectral imagery using pan-sharpening. United States Patent No. 6011875.
Núñez, J., Otazu, X., Fors, O., Prades, A., Palà, V., and Arbiol, R., 1999. Multiresolution-based image fusion with additive
wavelet decomposition. IEEE Transactions on Geoscience and
Remote Sensing, 37(3), pp. 1204-1211.
Otazu, X., González-Audícana, M., Fors, O., and Núñez, J., 2005. Introduction of sensor spectral response into image fusion methods. Application to wavelet-based methods. IEEE Transactions on Geoscience and Remote Sensing, 43(10), pp. 2376-2385.
Smith A. R., 1978. Color Gamut Transform Pairs. SIGGRAPH 78 Conference Proceedings, pp. 12-19.
http://alvyray.com/Papers/CG/color78.pdf (6 Jul. 2011).
Tu. T-M., Huang, P. S., Hung, C-L., and Chang, C-P., 2004. A fast intensity-hue-saturation fusion technique with spectral
adjustment for IKONOS imagery. IEEE Geoscience and
Remote Sensing Letters, 1(4), pp. 309-312.
Wald, L., 2000. Quality of high resolution synthesised images: is there a simple criterion?. Proceedings of the third conference "Fusion of Earth data: merging point measures, raster maps and remotely sensed images", Sopia Antipolis, France, pp. 26-28. http://www.scep.ensmp.fr/Public/themes_de_recherche/teledete ction/title_tele_fusion/ergas_-_wald_2000 (20 Nov. 2011).
Wang, Z., and Bovik, A. C., 2002. A universal image quality index. IEEE Signal Processing Letters, 9, pp. 81-84.
Zhang, J., 2010. Multi-source remote sensing data fusion: status and trends. International Journal of Image and Data Fusion, 1(1), pp. 5-24.
Zhang, J., Yang, J., Zhao, Z., Li, H., and Zhang, Y., 2010. Block-regression based fusion of optical and SAR imagery for feature enhancement. International Journal of Remote Sensing, 31(9), pp. 2325-2345.