The
6
th
Report of the
National Eye Database
2012
port
of the
National Eye
Database
Sponsors:
The Network of Clinical Research Centre, Ministry of Health
The National Eye Database is funded with grants from: • The Ministry of Health
April 2013©
National Eye Database ISSN 1985-7489
Published by the
National Eye Database (NED) Registry Coordinating Centre c/o Clinical Research Centre Level 4, Specialist Office Hospital Selayang
Lebuhraya Selayang-Kepong
68100 Batu Caves Selangor, Malaysia Telephone : 603-61203233 Ext.: 4169 Fax : 603-61202761
Email : [email protected]
Website : http://www.acrm.org.my/ned
Important information
The Fourth Report of the National Eye Database is the copyright of Ophthalmology Sevice, Ministry of Health and Clinical Research Centre. We are happy for our materials to be downloaded, printed out, copied, used and distributed free of charge for non-commercial purposes only. Where our materials are copied, used or distributed, the source of the material must be identified and the copyright status acknowledged. No alteration or adaptation of any of the materials may be made without obtaining the permission of the steering committee of National Eye Database. Reproduction or distribution of materials either in whole or in part for a commercial purpose is prohibited without the prior written permission of steering committee of National Eye Database.
Suggested citation is:
i
THE 6
thREPORT OF THE NATIONAL EYE DATABASE 2012
ACKNOWLEDGEMENTS
ACKNOWLEDGEMENTS
The National Eye Database (NED) would like to thank each and everyone who have directly or indirectly contributed to the success of the National Eye Database.
In particular we would like to thank the following:
1. Ophthalmologists, heads of MOH Ophthalmology Departments, doctors in-charge, site coordinators mainly optometrists and paramedics at all the 36 MOH hospitals with ophthalmology service and resident optometrists at district hospitals without ophthalmologists. Thank you for being the source data providers for NED. The success of NED depends on you.
2. Staff Nurse Teng Kam Yoke, NED clinical registry manager at Registry Coordinating Centre. 3. The Division of Research and Technology Support, Ministry of Health, for financial support. 4. Information Technology Personnel; Ms Lim Jie Ying and Mr Sebastian Thoo.
5. Database administrator; Ms Amy R Porle, Web application programmer; Mr Abdul Malik Bin Tanjeng and Graphics Designer; Mr Azizi Bin Abd Rahman.
6. Clinical Data Management Personnel; Ms Teo Jau Shya and Ms Huziana. 7. Statistician; Puan Tassha Hilda bt Adnan dan Cik Nadiah Sa’at.
8. Malaysian Society of Ophthalmology, Malaysia Medical Association Foundation, and Alcon Laboratories Sdn Bhd for providing financial support.
Last but not least, the Director-General of Health for the permission to publish this report. Thank you.
NED STEERING COMMITTEE MEMBERS 2014
NED STEERING COMMITTEE MEMBERS 2011
Advisor Dr Elias Hussein
Head,
Ophthalmology Service, Ophthalmology Department, Hospital Selayang
Chairperson Dr Goh Pik Pin
Director, Clinical Research Centre, MOH
Co- Chairperson Dr Mohamad Aziz Salowi
Ophthalmologist, Hospital Umum Sarawak
Members Dr Mariam Ismail
Vitreoretinal Consultant, Ophthalmology Department, Hospital Sungai Patani
Dr Radzlian Othman
Head & Consultant Ophthalmologist, Ophthalmology Department, Hospital Serdang
Dr Nor Fariza Ngah
Head & Consultant Ophthalmologist, Ophthalmology Department, Hospital Selayang
Dr Zuraidah Mustari
Head & Consultant Ophthalmologist Ophthalmology Department,
Hospital Sultanah Nur Zahirah, K. Terengganu
Puan Che Rohani
Head of Optometry Service, Optometrist,
Hospital Kuala Lumpur
Secretariat Teng Kam Yoke
iii
THE 6
thREPORT OF THE NATIONAL EYE DATABASE 2012
ABOUT NATIONAL EYE DATABASE
ABOUT NATIONAL EYE DATABASE
Introduction
The National Eye Database (NED) is an eye health information system supported by MOH. It is a clinical database consisting of six patient registries and a monthly ophthalmology service census. The patient registries are Cataract Surgery Registry, Diabetic Eye Registry, Contact Lens-Related Corneal Ulcer Surveillance, Glaucoma Registry, Retinoblastoma Registry, and Age Related Macular Degeneration Registry. The source data producers are eye care providers, currently from the public. Information collected, both clinical and epidemiological, are very useful in assisting the MOH, Non-Governmental Organizations, private healthcare providers and industry in the planning, evaluation and continuous improvement of eye care services, leading to prevention and control of blindness in the nation.
Vision
An accessible eye health information.
General Objectives of the National Eye Databases
1. To establish and maintain a web based eye health information system on natural history of visual threatening eye diseases, which are of public health importance. The information is useful in the planning and evaluation of eye care service.
2. To determine the effectiveness of treatment, both clinical outcomes and cost, and to identify factors influencing outcomes. This serves the needs of outcome assessment.
3. To provide information necessary to evaluate ophthalmology services through census and key performance indicators, as well as on safety or harm of products and services used in the treatment of a disease. This contributes to continuous quality initiative.
4. To evaluate the accessibility and equity in health care provision. This information enhances accountability. 5. To provide a mean of prompt and wide dissemination of epidemiological and clinical information through web such
as real time registries reports and notification of epidemic of contact lens-related corneal ulcer. This is essential for public health advocacy.
6. To stimulate and facilitate research on eye diseases.
Cataract Surgery Registry
The Cataract Surgery Registry (CSR) was initiated in 2002 and collects data pertaining to patients who have had cataract surgery. Data collected include demography, medical history, operative events, post-operative visual outcomes and probable causes for poor outcome. Since 2008, data on posterior capsular rupture, visual outcome and post-operative endophthalmitis were linked to online key performance indicator for monitoring centre performance while data on incidence of posterior capsular rupture and patients with poor visual outcome are linked to online cumulative sum (CUSUM) to monitor competency of individual surgeon. Annual reports for the year 2002, 2003, 2004 and 2007 are available at www.acrm.org.my/ned, under the section of publication.
Specifi c Objectives
1. To determine the frequency, distribution and practice pattern of cataract surgery in Malaysia. 2. To determine the outcomes and factors influencing outcomes of cataract surgery.
3.
To evaluate cataract surgery services based on rate of posterior capsular rupture, operative infection, post-operative visual outcome and induced astigmatism.
4. To stimulate and facilitate research on cataract and its management.
Retinoblastoma Registry
Retinoblastoma registry collects data on the pattern of clinical presentation, mode of treatment and outcome of patients with retinoblastoma seen at ophthalmology clinics with paediatric ophthalmology service. The main SDP is Hospital Kuala Lumpur. Specifi c Objectives
1. To determine the incidence and distribution of retinoblastoma in different states in Malaysia. 2. To determine the ethnic-specific prevalence of retinoblastoma in Malaysia.
3.
To study characteristics of RB patients in terms of clinical presentation and stage of disease based on International Intraocular Retinoblastoma Classification.
4. To evaluate types of treatments and monitor treatment trends.
ABOUT NATIONAL EYE DATABASE
Monthly Ophthalmology Service Census
Since 2002, Ophthalmology Service of MOH has been collecting annual census from all the hospitals with ophthalmology departments. Data include essential service census and key performance indicators for ophthalmology service. There are 13 sections in the census return, namely out-patients, inpatients, major eye operations, cataract service, diabetic service, glaucoma service, and optometry service, and subspecialty services which include vitreoretinal, corneal, paediatric ophthalmology, oculoplasty, medical retinal, and a public health ophthalmology, and data on training records and prevention of blindness activities. Data are entered monthly by staff at sites via on-line data entry. Heads of ophthalmology department can view their own and other hospitals’ real-time reports.
Specifi c Objectives
1. To evaluate service output in all ophthalmology departments. 2. To study trends in service output and service patterns.
3. To get baseline and norm from services provided by MOH ophthalmology departments.
4. To determine norm and set standards for performance indicators for centres which differ in strength of physical and human resources.
CUSUM-Ophthalmology
Cataract surgery is the most common procedure done in ophthalmology departments. The procedure is quite consistent and outcome is measured by visual acuity. Cataract surgery outcome depends greatly on surgeons’ skill. With advancement in technology and intraocular lens implantation, good visual outcome is almost certain among patients without pre-existing ocular co-morbidity. Hence, monitoring and evaluating surgeons’ competency, especially trainees’ performance, are essential in ensuring standard of care.
Cumulative Sum (CUSUM) software auto-mine data on occurrence of posterior capsular rupture and patients with post-operative vision worse then 6/12 from cataract surgery registry on surgery done by individual surgeon using unique surgeon ID. From 2008, by using individual unique username and password, surgeon can access his/her own CUSUM charts via eCUSUM web page. Consultant ophthalmologists can view their own as well as their trainees’ charts. By doing so, monitoring on surgeons’ competency in cataract surgery is made most effectively and easily.
Key Performance Indicator
The Ministry of Health (MOH) launched the implementation of Key Performance Indicators (KPIs) in February 2008 with the aim to assess the overall performance of services provided by Clinical Departments in MOH. The MOH Ophthalmology Service has identified eight KPIs which measure clinical performance of core ophthalmology service such as out-patient service, cataract surgery and diabetic eye screening.
v
THE 6
thREPORT OF THE NATIONAL EYE DATABASE 2012
ABOUT NATIONAL EYE DATABASE
MEASUREMENT INDICATOR STANDARD
PI 1
Percentage of patients with waiting time of 90 minutes to see the doctor at specialist clinic
³ 80% of the patients are seen within ninety
(90) minutes
PI 2
KPI 1
Percentage of diabetic patients who were given an appointment for first consultation within 6 weeks
³ 80% of the patients are given an appointment for First Consultation within 6 weeks
PI 3
Percentage of patients with waiting time of within 16 weeks for cataract surgery
³ 80% of patients have appointment given for cataract surgery within 16 weeks PI
4 KPI 2
N|A Rate of infectious endophthalmitis following cataract surgery (2 cases per 1000 operations)
< 0.2% (2 cases per 1000 operations)
PI 5
KPI 3
N|A Percentage of patients with post-operative visual acuity of 6/12 or better within 3 months following cataract surgery in patients without ocular co-morbidity (850 cases 1000 operations)
> 85% (900 cases per 1000 operations)
PI 6
Cancellation rate of patients listed for cataract surgery under local Anaesthesia
10% cancellation
PI 7
Number of mortality/morbidity audits/ meetings conducted in the Department (in 6 months)
At least 6 times in 6 months
Note:
PI = Performance Indicator KPI = Key Performance Indicator NIA = National Indicator Approach
The NED website also has interactive online registry charting that allows public users to review data captured in cataract surgery registry and adverse incident reporting to notify defect in intraocular lens (IOL) noted during or after cataract surgery by public and private eye care providers, an initiative to promote patient safety.
The new feature for NED launched in 2012 is an e-notification of patients with suspected post-operative infectious endophthalmitis
Methods of the National Eye Database
The National Eye Database is designed as a cohort study. It is an online clinical database hosted at the Association of Clinical Registry Malaysia website at www.acrm.org.my/ned. Its protocol was approved by the Medical Research Ethical Committee of MOH on 2nd September 2008 (reference number NMRR 08-552-1707) and is accessible at the NED website.
Data collection and data entry are done at SDP sites. Data are collected either using case report forms (CRF) which are later entered into the web application, or are directly entered into the web application during the course of clinical work.
NED ORGANIZATION
NED ORGANIZATION
Organisation Chart
Sponsor
Steering Committee
(Ophthalmologists Optometrists)
Sub committee/Expert panels
• Registry PI/Co-PI
• Independent data monitoring • Outcome evaluation
• Data access & publication • Medical writing
Governance/Advisory Board
(MOH, public, university, private ophthalmologists)
Registry Coordinating Centre
(Public health ophthalmologist/epidemiologist) Clinical Registry Manager
Research Assistant IT personnel
Statistician
Source Data Producers
(Heads of Department (Site Co-Investigator)
Doctors in charge Site Coordinators)
Users
(SDP, MOH, Universities, NGO, Industry,
vii
THE 6
thREPORT OF THE NATIONAL EYE DATABASE 2012
NED SOURCE DATA PROVIDERS
NED SOURCE DATA PROVIDERS
List of doctors in charge & site coordinator for 2010
Northern Zone
No. SDP Doctor-in-charge Site Coordinator
1. Hospital Kangar Dr Noram Azian bin Ramli Roslinda bt Rahman 2. Hospital Sultanah Bahiyah Dr Lee Annie Nur Diana Mohd Zani 3. Hospital Sungai Petani Dr Nor’aini Ramlee Juliana Md Desa
4. Hospital Pulau Pinang Dr Ang Ee Ling Noor Asmah Md Azmi
5. Hospital Bukit Mertajam Dr Ng Seok Hui Marhaini Othman
6. Hospital Ipoh Dr Ummi Kalsom Noraini Harith
7. Hospital Taiping Dr Ng Sok Lin Rohaiza bt Abdul Hamid
8. Hospital Teluk Intan Dr Mimi Marina Adawiyah Ismail
9. Hospital Sri Manjung Dr Yushaniza Yaacob Juhaida bt Zahri
Central Zone
No. SDP Doctor-in-charge Site Coordinator
10. Hospital Kuala Lumpur Dr Rohanah Alias Intan Khusiah Abd Rahman
11. Hospital Putrajaya Dr Salmah Othman Lily Muhanifa Mustafa
12. Hospital Selayang Dr Shelina Oli Mohamed Nurul Aini Yusoff
13. Hospital Tengku Ampuan Rahimah Dr Fiona Chew Lee Min Najihah Muhammad Sharif
14. Hospital Serdang Dr Zaida Mohd Kasim Yusrina Mohamat Hata
15. Hospital Sungai Buloh Dr. Chan U-Teng Majidah Zainal Abidin 16. Hospital Ampang Dr Zalifa Zakiah bt Asnir Noriah binti Abdullah
Southern Zone
No SDP Doctor in charge Site Coordinator
17. Hospital Tuanku Jaafar Dr Norlelawati Abu Normalisa Muhammad Som 18. Hospital Tuanku Ampuan
Najihah Kuala Pilah Dr Khairul Husnaini binti Mohd Khalid Nazura Selamat
19. Hospital Melaka Dr Juliana Jalaluddin Eryanti Md Omar
20. Hospital Sultanah Aminah Dr Kevin Ong Nurazilah Ismail 21. Hospital Pakar Sultanah Fatimah Dr Ngim You Siang Roziana Sumardi
22. Hospital Batu Pahat Dr. Liu Han Seng Nur Adilah Abdullah
NED SOURCE DATA PROVIDERS
Southern Zone
No SDP Doctor in charge Site Coordinator
25. Hospital Temerloh Dr Fatimah Suhaila Sukaimi Nor Hanim Ahmad Adnan 26. Hospital Kuala Terengganu Dr Nor Anita Che Omar Noor Hayati Mohammad 27. Hospital Kota Bharu Dr Azma Azalina Ahmad Alwi Rossaidah bt Mustapa 28. Hospital Kuala Krai Dr. Hj Abdul Mutalib Othman Farawahida Fakaruddin
East Malaysia Zone –Sarawak
No SDP Doctor-in-charge Site Coordinator
29. Hospital Umum Sarawak Dr Mohamad Aziz Salowi Nazirin bin Arshad
30. Hospital Sibu Dr Jakiyah Daud Mohammad Ridzwan Bihem
31. Hospital Bintulu Dr KM Reddy Mohd Zharif Mohd Nor
32. Hospital Miri Dr Chieng Lee Ling Nur Hafizah Mat Jalil
East Malaysia Zone –Sabah
No SDP Doctor-in-charge Site Coordinator
33. Hospital Queen Elizabeth Dr Chin Kelvin Iramayanah Ambo Mase 34. Hospital Duchess Of Kent Dr Suriana Suaibun Norhafizah Abd Razik
35. Hospital Tawau Dr Ajit Majumder Arni Rehny Ahmad Rakhli
ix
THE 6
thREPORT OF THE NATIONAL EYE DATABASE 2012
FOREWORD
FOREWORD
National Eye Database was invited to participate in the Fine-Tuning Health Care – a high level conference held in Stockholm, Sweden on 21-22nd May 2013, organized by the Swedish Ministry of Health and Social Affair. The conference was attended by the Health Ministers and Director Generals from all over Europe and several other countries like USA, Canada, Australia, India and China. We were proud that Malaysia was also invited.
The interaction with other participants and visits to the world renowned Karolinska Institute, St Erik’s Eye Hospital and round table discussions at the Health Ministry and Social Affair’s office the Stockholm Registry Coordinating Centre itself inspired us at how well data were used to manage health care in Sweden. The health care workers at all levels understood that it was essential not only to engage themselves but also the patients and the public to participate in utilizing outcome data for health care services. This usage of quality data has resulted in lower health care costs across all the counties in Sweden.
We were invited to collaborate with the Swedish Cataract Register and invited to become the cataract working group in the International Consortium for Health Outcomes Measurements (ICHOM) because we have a significant large pool of data in Cataract Surgery Registry (CSR). As of 2012, we have registered more than 200,000 cataract surgeries mainly performed by surgeons in the Ministry of Health (MOH) throughout the country. But we would like to appeal for an improved data quality. A large pool of data will be useless if data are missing or inaccurate.
One of the highlights in 2012 was the total number of medical officers performing cataract surgery continued to decrease. This trend is worrying as MOH, as the main service provider may not be giving adequate time for training new cataract surgeons. The total number of patients operated in the same year and the time taken before the second eye was operated also continued to show an upward trend. Similar to previous years, only 1/3 of patients returned for the second eye surgery.
Beginning with NED report 2012, all the SDPs’ name will be published. This will facilitate comparisons between hospitals. Direct and clear comparison in the performance of each hospital will hopefully trigger an initiative by the hospitals to improve further by applying the necessary remedial steps for better outcomes.
The Satellite Cataract Services and the Klinik Katarak 1Malaysia (KK1M) have started their services and started feeding data to CSR. Several new SDPs were also added in 2012 onwards. We will continue to monitor data quality and outcome of cataract surgeries especially in these outreach services and publish the results in 2013 report.
Thank you.
NED Advisor NED Chairperson NED Co-Chairperson
……… ………. ……….
Dr Elias Hussein Dr Goh Pik Pin Dr Mohamad Aziz Salowi
Consultant and Head of Service Director, Ophthalmologist
Hospital Selayang Clinical Research Centre Hospital Umum Sarawak
ABBREVIATION
ABBREVIATION
ADED Advanced Diabetic Eye Disease AMD Age related Macular Degeneration CAI Carbonic Anhydrase Inhibitor
CF Counting Finger
CLRCU Contact Lens-Related Corneal Ulcer CSMO Clinically Significant Macular Odema
CMO Cystoid Macular Oedema
CSR Cataract Surgery Registry
DER Diabetic Eye Registry
DM Diabetes Mellitus
DR Diabetic Retinopathy
ECCE Extracapsular Cataract Extraction
FU Follow Up
HM Hand Movement
HPT Hypertension
ICCE Intracapsular Cataract Extraction
IOL Intraocular Lens
MOH Ministry Of Health
NED National Eye Database
NPDR Non Proliferative Diabetic Retinopathy
NPL No Perception Of Light
OT Operating Theatre
PCO Posterior Capsule Opacification
PCR Posterior Capsule Rapture
PDR Proliferative Diabetic Retinopathy
Phaco Phacoemulsification
PL Perception Of Light
PI Principal Investigator
RB Retinoblastoma
RCC Registry Coordinating Centre
SD Standard Division
SDP Source Data Producers
VA Visual Acuity
VR Vitreoretinal Surgery
xi
THE 6
thREPORT OF THE NATIONAL EYE DATABASE 2012
CONTENT
CONTENT
ACKNOWLEDGEMENTS ... i
NED STEERING COMMITTEE MEMBERS 2014 ... ii
ABOUT NATIONAL EYE DATABASE ... iii
CATARACT SURGERY REGISTRY ... iii
RETINOBLASTOMA REGISTRY ... iii
MONTHLY OPHTHALMOLOGY SERVICE CENSUS... iv
CUSUM- OPHTHALMOLOGY ... iv
KEY PERFORMANCE INDICATOR ... iv
NED SOURCE DATA PROVIDERS ... vii
ABBREVIATION ... x
LIST OF TABLES ... xiii
LIST OF FIGURES ... xv
CHAPTER 1: CATARACT SURGERY 2012 ... 1
1.1 Stock and flow ... 2
1.2 Characteristics of patient ... 4
1.2.1 Patient demography ... 4
1.2.2 Medical history ... 6
1.2.2.1 Systemic co-morbidity ... 6
1.2.2.2 Causes of cataract ... 8
1.2.2.3 First or Fellow Eye Surgery ... 9
1.2.2.4 Past Ocular Surgery of the Operated Eye ... 10
1.2.2.5 Preexisting Ocular Co-morbidity ... 11
1.2.2.6 Pre-operative Vision ... 13
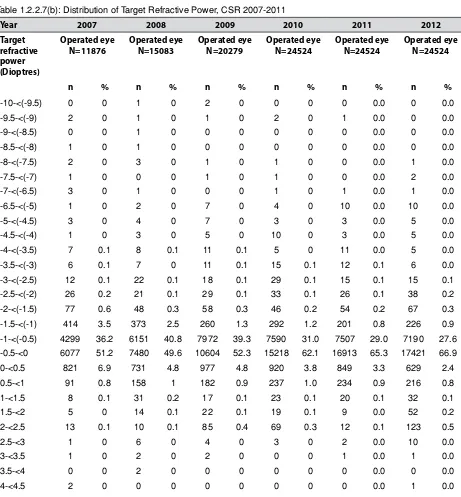
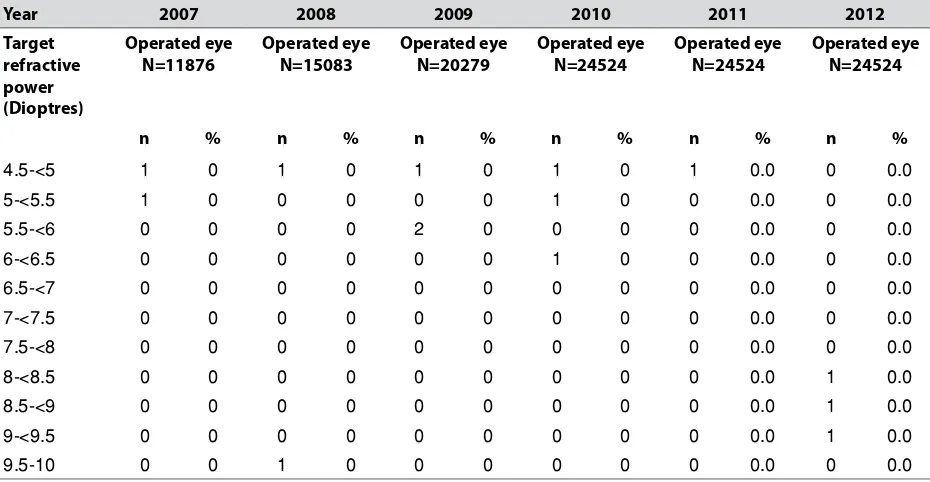
1.2.2.7 Target Refractive Power ... 16
1.3 CATARACT SURGICAL PRACTICES ... 17
1.3.1 Number of Cataract Surgery by SDP ... 17
1.3.2 Number of Cataract Surgery by Month ... 18
1.3.3 Number of Cataract Surgery Registered to CSR by State ... 18
1.3.4 Surgeon Status ... 19
1.3.5 Duration of Surgery ... 23
1.3.6 Distribution of Cataract Surgery Performed Under Day Care Setting ... 23
1.3.7 Distribution of Types of Cataract Surgery ... 26
1.3.8 Distribution of Combined Surgery ... 32
1.3.9 Anaesthesia in Cataract Surgery ... 34
1.3.10 Intraocular Lens Implantation ... 59
1.4 INTRA-OPERATIVE COMPLICATIONS ... 61
1.4.1 Intra-operative Complications by Years ... 61
1.4.2 Intra-operative Complication by Type of Surgery ... 62
1.4.3 Intra-operative Complications by Combined Surgery ... 67
1.4.4 Intra-operative Complications by Types of Local Anaesthesia ... 68
1.4.5 Intra-operative Complications by Surgeon Status ... 69
1.4.6 PCR ... 73
1.4.7 PCR by Type of Cataract Surgery ... 76
1.5 CATARACT SURGERY OUTCOME ... 77
1.5.1 Post-operative Complications ... 77
1.5.1.1 Post-operative Infectious Endophthalmitis ... 78
1.5.1.2 Unplanned Return to Operating Theatre (OT) ... 83
1.5.1.3 Post-operative Follow-up Period ... 84
1.5.2 Post-operative Visual Acuity ... 85
1.5.2.1 Post-operative Visual Acuity (All Eyes) ... 85
1.5.2.2 Post-operative Visual Acuity (Eyes without Ocular Co-morbidity) ... 88
1.5.2.3 Post-operative Visual Acuity 6/12 or Better Among Eyes without Ocular Co-morbidity ... 91
1.5.3 Reasons for No Record of Visual Acuity ... 96
1.5.4 Factors Contributing to Post-operative Refracted Visual Acuity of Worse than 6/12 ... 97
CONTENT
CHAPTER 2: RETINOBLASTOMA REGISTRY 2012 ... 106
2.1 INTRODUCTION ... 107
2.2 PATIENT DEMOGRAPHY ... 107
2.3 OCULAR HISTORY AND PRESENTATION ... 108
2.4 INVESTIGATION AND CLASSIFICATION ... 109
2.5 MANAGEMENT AND OUTCOME ... 111
xiii
THE 6
thREPORT OF THE NATIONAL EYE DATABASE 2012
LIST OF TABLES
LIST OF TABLES
Table 1.1(a) : Stock and Flow ... 2
Table 1.1(b) : Ascertainment for MOH Hospitals, CSR 2002-2012 ... 2
Table 1.1(c) : Ascertainment for CSR by SDP in 2012 ... 3
Table 1.2.1 : Age and Gender Distributions, CSR 2002-2012 ... 5
Table 1.2.2.1 : Distribution of Systemic Co-Morbidity, CSR 2002-2012 ... 7
Table 1.2.2.2 : Causes of Cataract, CSR 2002-2012 ... 8
Table 1.2.2.3 : First or Fellow Eye Surgery, CSR 2002-2012 ... 9
Table 1.2.2.4 : Past Ocular Surgery of the Operated Eye, CSR 2002-2012 ... 10
Table 1.2.2.5 : Distribution of Pre-existing Ocular Co-Morbidity, CSR 2002-2012 ... 11
Table 1.2.2.6 : Distribution of Pre-Operative Vision, CSR 2002-2012 ... 13
Table 1.2.2.7(a) : Distribution of Target Refractive Power, CSR 2007-2012 ... 16
Table 1.2.2.7(b) : Distribution of Target Refractive Power, CSR 2007-2012 ... 16
Table 1.3.1 : Range of Cataract Surgery Registered by SDP per year, Census versus CSR 2002-2012 ... 17
Table 1.3.2 : Number of Cataract Surgery by Month, CSR 2002-2012 ... 18
Table 1.3.4 : Surgeon Status, CSR 2002-2012 ... 19
Table 1.3.4.1 : Surgeon Status for Phaco, CSR 2002-2012 ... 19
Table 1.3.4.2: : Surgeon Status for ECCE, CSR 2002-2012... 19
Table 1.3.4(a) : Specialist by SDP 2002-2012 ... 20
Table 1.3.5(a) : Duration of Surgery by Types of Cataract Surgery in minutes, CSR 2007-2012 ... 23
Table 1.3.5(b) : Duration of Surgery by Surgeon Status, CSR 2007-2012 ... 23
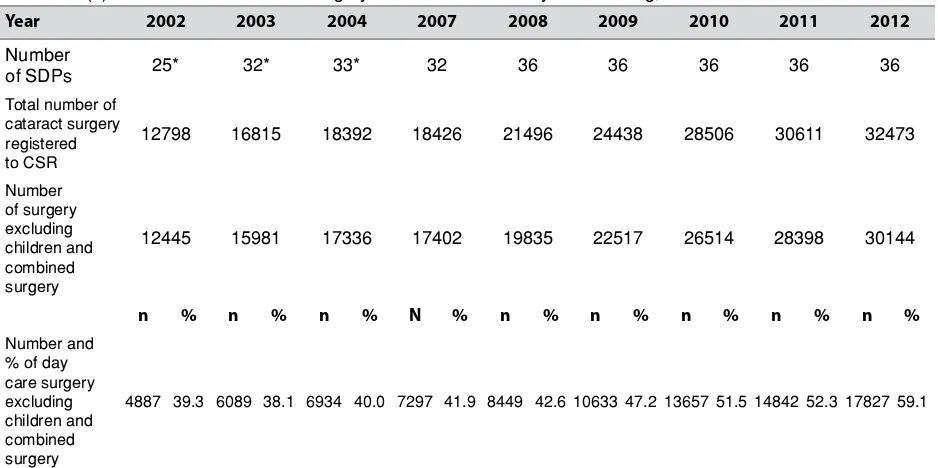
Table 1.3.6(a) : Distribution of Cataract Surgery Performed Under Day Care Setting, CSR 2002-2012 ... 23
Table 1.3.6(b) : Distribution of Cataract Surgery (Excluding Children and Combined Surgery) Performed as Day Care by SDP, CSR 2002-2012 ... 24
Table 1.3.7(a) : Distribution of Types of Cataract Surgery, CSR 2002-2012 ... 26
Table 1.3.7(b) : Distribution of Types of Cataract Surgery by SDP, CSR 2012 ... 27
Table 1.3.7(c) : Distribution of Phacoemulsification by SDP, CSR 2002-2012 ... 29
Table 1.3.7(d) : Distribution of ECCE by SDP, CSR 2002-2012 ... 30
Table 1.3.8(a) : Distribution of Combined Surgery all SDP, CSR 2002-2012 ... 32
Table 1.3.8(b) : Distribution of Combined Surgery by SDP, CSR 2012 ... 33
Table 1.3.9.2(a) : Types of Anaesthesia all SDPs and more 50years CSR 2002-2012 ... 35
Table 1.3.9.1(b) : Types of Anaesthesia by SDPs, CSR 2012 ... 36
Table 1.3.9.2(b) : Types of Anaesthesia by SDPs and 50yr above, CSR 2012 ... 37
Table 1.3.9.1(c) : Types of Local Anaesthesia by SDPs, CSR 2012 ... 38
Table 1.3.9.2(c) : Types of Local Anaesthesia by SDPs and 50yrs above, CSR 2012 ... 40
Table 1.3.9.1(d) : Types of Local Anaesthesia by SDPs Excluding Combined Surgery, CSR 2012 ... 41
Table 1.3.9.2(d) : Types of Local Anaesthesia by SDPs 50yrs above and Excluding Combined Surgery, CSR 2012 ... 43
Table 1.3.9.1(e) : Subtenon Anaesthesia by SDPs, CSR 2002-2012 ... 44
Table 1.3.9.2(e) : Subtenon Anaesthesia by SDPs and 50yrs, CSR 2002-2012 ... 46
Table 1.3.9.1(f) : Topical Anaesthesia by SDPs, CSR 2002-2012 ... 47
Table 1.3.9.2(f) : Topical Anaesthesia by SDPs and 50yr, CSR 2002-2012 ... 49
Table 1.3.9.1(g) : Types of Sedation in Eyes Given Local Anaesthesia by SDPs, CSR 2012 ... 51
Table 1.3.9.2(g) : Types of Sedation in Eyes Given Local Anaesthesia and age 50yrs above by SDPs, CSR 2012 ... 52
Table 1.3.9.1(h) : Oral Sedation Alone by SDPs, CSR 2002-2012 ... 53
Table 1.3.9.2(h) : Oral Sedation Alone and Age 50yr Above by SDPs, CSR 2002-2012 ... 54
Table 1.3.9.1(i) : Intravenous Sedation Alone by SDPs, CSR 2002-2012 ... 56
Table 1.3.9.2(i) : Intravenous Sedation Alone and Age 50yr above by SDPs, CSR 2002-2012 ... 57
Table 1.3.10(a) : Intraocular Lens Implantation, CSR 2002-2012 ... 59
Table 1.3.10(b) : Distribution of IOL Placement by SDP, CSR 2012 ... 60
Table 1.4.1(a) : Distribution of Type of Intra-operative Complications, CSR 2002-2012 ... 61
Table 1.4.1(b) : Distribution of Type of Intra-operative Complications – Posterior Capsule Rupture, CSR 2 002-2012 ... 61
Table 1.4.2(a) : Intra-operative Complications by Types of Cataract Surgery, CSR 2002-2012 ... 62
Table 1.4.2(b) : Distribution of Types of Intra-operative Complications by Specific Types of Cataract Surgery, CSR 2012 ... 63
Table 1.4.2(c) : Distribution of Types of Intra-operative Complications by SDP, CSR 2012 ... 64
LIST OF TABLES
Table 1.4.3(a) : Distribution of Intra-operative Complications by Specific Combined Surgery, CSR 2012 ... 67
Table 1.4.3(b) : Distribution of Intra-operative Complications by Specific Combined Surgery, CSR 2012 ... 67
Table 1.4.3(c) : Distribution of Intra-operative Complications when Combined with Filtering Surgery, CSR 2002-2012 ... 68
Table 1.4.3(d) : Distribution of Intra-operative Complications when Combined with VR Surgery, CSR 2002-2012 ... 68
Table 1.4.4 : Intra-operative Complications by Types of Local Anaesthesia, CSR 2012 ... 69
Table 1.4.5(a)(i) : Percentage of Intra-operative Complications by Surgeon Status, CSR 2003-2012 ... 69
Table 1.4.5(a)(ii) : Percentage of Intra-operative Complications by Surgeon Status for Phacoemulsification, CSR 2009-2012 ... 71
Table 1.4.6 (i) : PCR by SDP, CSR 2007-2012 ... 73
Table 1.4.6 (ii) : PCR in Phacoemulsification by SDP by surgeon status, CSR 2012 ... 74
Table 1.4.7 : PCR by Type of Cataract Surgery, CSR 2002-2012 ... 77
Table 1.5.1 : Distribution of Cataract Surgery with Post-operative Complication Record, CSR 2002-2012 ... 78
Table 1.5.1.1(a) : Post-operative Infectious Endophthalmitis, CSR 2002-2012 ... 78
Table 1.5.1.1(b) : Time from Surgery to Diagnosis of Post-operative Infectious Endophthalmitis, CSR 2007-2012 ... 83
Table 1.5.1.2(a) : Unplanned Return to OT, CSR 2004-2012 ... 83
Table 1.5.1.2(b) : Reasons for Unplanned Return to OT, CSR 2004-2012 ... 84
Table 1.5.1.2(c) : Time from Surgery to Unplanned Return to OT, CSR 2012 ... 84
Table 1.5.1.3(a) : Median Follow-up Period for Eyes with Unaided Vision (in weeks) by Types of Surgery, 2012 ... 85
Table 1.5.1.3(b) : Median Follow-up Period for Eyes with Refracted Vision (in weeks) by Types of Surgery, 2011 ... 85
Table 1.5.2.1 : Post-operative Visual Acuity, All Eyes, CSR 2002-2012 ... 86
Table 1.5.2.2 : Post-Operative Visual Acuity for Eyes without Ocular Co-morbidity, CSR 2002-2012 ... 89
Table 1.5.2.3(a) : Post-operative Visual Acuity 6/12 or Better for Eyes without Ocular Co-morbidities by Types of Surgery, CSR 2002-2012 ... 91
Table 1.5.2.3(b) : Post-operative Refracted Visual Acuity 6/12 or Better in Eyes without Ocular Co-morbidities by Complications and Types of Surgery, CSR 2012 ... 92
Table 1.5.2.3(c) : Post-operative Refracted Visual Acuity 6/12 or Better in Eyes without Ocular Co-morbidities by Surgeon Status and Types of Surgery, CSR 2012 ... 92
Table 1.5.2.3(d) : Post-operative Refracted Visual Acuity 6/12 or Better in Eyes without Ocular Co-morbidities by SDP and Types of Surgery, CSR 2012 ... 94
Table 1.5.3 : Reasons for No Records of Visual Acuity, CSR 2002-2012 ... 96
Table 1.5.4(a) : Factors Contributing to Post-operative Refracted VA of Worse than 6/12 in All Eyes, CSR 2002-2012 ... 97
Table 1.5.4(b) : Factors Contributing to Post-operative Refracted VA of Worse than 6/12 in Eyes without Preexisting Ocular co-morbidity, CSR 2004-2012 ... 98
Table 1.5.5(a) : Distribution of Target and Actual Refractive Power in ECCE and Phaco, CSR 2007-2012 ... 98
Table 1.5.5(b) : Percentage Distribution of Target and Actual Refractive Power in ECCE and Phaco, CSR 2007-2012 ... 99
Table 1.5.5(c) : Difference in Target and Actual Refractive Power for Patients who had Phacoemulsification Only, CSR 2007-2012 ... 102
Table 1.5.5(d) : Percentage of Difference in Target and Actual Refractive Power within ±1.0D by SDP, CSR 2012 ... 104
Table 1.5.5(e) : Post-operative visual acuity and week of outcome notification, CSR 2012 ... 105
Table 2.1 : Stock and Flow ... 107
Table 2.2(a) : Distribution of Patients by Age ... 107
Table 2.2(b) : Distribution of Patients by Gender ... 107
Table 2.2(c) : Distribution of Patients by Ethnics ... 108
Table 2.3(a) : Clinical Presentation ... 108
Table 2.3(b) : Duration of Disease at the Time of Presentation ... 108
Table 2.3(c) : Eyes Affected ... 108
Table 2.4(a) : Type of imaging done at diagnosis, by no. of eyes ... 109
Table 2.4(b) : Type of imaging done at diagnosis by patient ... 109
Table 2.4(c) : Presence of mass, by CT scan ...109
Table 2.4(d) : Presence of mass, by MRI scan ...109
Table 2.4(e) : Presence of calcification, by CT scan ...110
Table 2.4(f) : Presence of calcification, by MRI scan ...110
Table 2.4(g) : Presence of extraocular extension, by CT scan ...110
Table 2.4(h) : Presence of extraocular extension, by MRI scan ...110
xv
THE 5
thREPORT OF THE NATIONAL EYE DATABASE 2011
LIST OF TABLES
Table 2.4(k) : Classification of Retinoblastoma ... 110
Table 2.5(a) : Chemotherapy by patient ... 111
Table 2.5(b) : Treatment method by no. of eyes ... 111
Table 2.5(c) : Treatment method for all patients with chemotherapy ... 111
Table 2.5(d) : Outcome and complications, by no. of eyes ... 112
Table 2.5(e) : Outcome by patient ... 112
LIST OF FIGURES
Figure 1.1(a) : Stock and flow ... 3Figure 1.1(c) : Ascertainment for CSR by SDP in 2012 ... 4
Figure1.2.1 : Age Distribution, CSR 2002-2012 ... 6
Figure 1.2.2.1 : Percentage of Patients with Specific Ocular Co-morbidity, CSR 2002-2012 ... 7
Figure 1.2.2.4 : Percent Distribution of Past Ocular Surgery of the Operated Eye, CSR 2002-2012 ... 10
Figure 1.2.2.5 : Percent Distribution of Eyes with Diabetic Retinopathy, Glaucoma or Lens-induced Glaucoma, CSR 2002-2012 ... 12
Figure 1.2.2.6(a) : Distribution of Pre-Operative Vision (Unaided/presenting and refracted), CSR 2002-2012 ... 14
Figure 1.2.2.6(b) : Distribution of Pre-Operative Vision (Unaided/presenting), CSR 2002-2012 ... 15
Figure 1.2.2.6(c) : Distribution of Pre-Operative Vision (Refracted), CSR 2002-2012 ... 15
Figure 1.3.2 : Number of Cataract Surgeries by Month, CSR 2002-2012 ... 18
Figure 1.3.3 : Number of Cataract Surgery Registered to CSR by State, CSR 2002-2012 ... 19
Figure 1.3.6(a) : Distribution of Cataract Surgery Performed as Day Care by SDP, CSR 2012 ... 25
Figure 1.3.6(b) : Distribution of Cataract Surgery Performed as Day Care and In-patient by SDP (Excluding Surgery Done in Children and Combined Surgery), CSR 2012 ... 26
Figure 1.3.6(c) : Distribution of Cataract Surgeries Performed as Day Care all SDPs (Excluding Surgery Done in Children and Combined Surgery), CSR 2002-2012 ... 26
Figure 1.3.7 : Distribution of Phacoemulsification, ECCE and Phaco Converted to ECCE, CSR 2002-2012 ... 32
Figure 1.3.8(a) : Distribution of Specific Combined Surgery, CSR 2002-2012 ... 36
Figure 1.3.9 : Types of Anaesthesia all SDPs, CSR 2002-2012 ... 60
Figure 1.3.10 : Intraocular Lens Implantation, CSR 2002-2012 ... 62
Figure 1.4.1 : Distribution of Specific Type of Intra-operative Complications, CSR 2012-2012 ... 63
Figure1.4.2 : Intra-operative Complications by Types of Cataract Surgery, CSR 2002-2012 ... 71
Figure 1.4.5 (i) : Percentage Distribution of Intra-operative Complications by Surgeon Status, CSR 2003-2012 ... 72
Figure 1.4.5 (ii) : Percentage Distribution of Intra-operative Complications by Surgeon Status, CSR 2009-2012 ... 73
Figure 1.4.6(a) : PCR by SDP, CSR 2012-Bar Chart (National standard set at <3.0%) ... 76
Figure 1.4.6(b) : PCR by SDP, CSR 2012-Radar Chart (National standard set at <3.0%) ... 76
Figure 1.4.7 : PCR by Type of Cataract Surgery, CSR 2002-2012 ... 77
Figure 1.5.1.1(a) : Percentage of Post-operative Infectious Endophthalmitis, CSR 2002-2012 ... 78
Figure 1.5.1.1(b-i) : Post-operative Infectious Endophthalmitis, by SDP CSR 2007 ... 79
Figure 1.5.1.1(b-ii) : Post-operative Infectious Endophthalmitis, by SDP CSR 2008 ... 79
Figure 1.5.1.1(b-iii) : Post-operative Infectious Endophthalmitis, by SDP CSR 2009 ... 79
Figure 1.5.1.1(b-iv) : Post-operative Infectious Endophthalmitis, by SDP CSR 2010 ... 80
Figure 1.5.1.1(b-iv) : Post-operative Infectious Endophthalmitis, by SDP CSR 2011 ... 80
Figure 1.5.1.1(b-iv) : Post-operative Infectious Endophthalmitis, by SDP CSR 2012 ... 81
Figure 1.5.1.1(c-i) : Post-operative Infectious Endophthalmitis, by SDP CSR 2007 ... 81
Figure 1.5.1.1(c-ii) : Post-operative Infectious Endophthalmitis, by SDP CSR 2008 ... 81
Figure 1.5.1.1(c-iii) : Post-operative Infectious Endophthalmitis, by SDP CSR 2009 ... 82
Figure 1.5.1.1(c-iv) : Post-operative Infectious Endophthalmitis, by SDP CSR 2010 ... 82
Figure 1.5.1.1(c-iv) : Post-operative Infectious Endophthalmitis, by SDP CSR 2011 ... 82
Figure 1.5.1.1(c-iv) : Post-operative Infectious Endophthalmitis, by SDP CSR 2012 ... 82
Figure 1.5.1.2 : Reasons for Unplanned Return to OT, CSR 2004-2012 ... 84
Figure 1.5.2.1(a) : Percent Distribution of Post-operative Unaided and Refracted Visual Acuity, CSR 2002-2012 ... 87
Figure 1.5.2.1(b) : Post-operative Unaided and Refracted Visual Acuity by Visual Category for All Eyes, CSR 2002-2012 ... 88
Figure 1.5.2.2(a) : Post-Operative Visual Acuity for Eyes without Ocular Co-morbidity, CSR 2002-2012 ... 90
LIST OF TABLES
Figure 1.5.2.3(b) : Post-operative Refracted Visual Acuity 6/12 or Better in Eyes without Ocular
Co-morbidities by Surgeon Status and Types of Surgery, CSR 2002-2012 ... 93 Figure 1.5.2.3(c) : Post-operative Refracted Visual Acuity 6/12 or Better in Eyes without Ocular
Co-morbidities by SDP and All Surgeries, CSR 2012 ... 95 Figure 1.5.2.3(d) : Post-operative Refracted Visual Acuity 6/12 or Better in Eyes without Ocular
Co-morbidities by SDP for Phacoemulsification, CSR 2012 ... 96 Figure 1.5.2.3(e) : Post-operative Refracted Visual Acuity 6/12 or Better in Eyes without Ocular
Co-morbidities by SDP for ECCE, CSR 2012 ... 96 Figure 1.5.4 : Factors Contributing to Post-operative Refracted VA of Worse than 6/12 in All Eyes,
CSR 2002-2012 ... 97 Figure 1.5.5(a) : Percentage Distribution of Actual Refractive Power in ECCE and Phaco, CSR
2007-2012 ... 101 Figure 1.5.5(b) : Difference in Target and Actual Refractive Power for Patients who had
Phacoemulsification Only, CSR 2007-2012 ... 103 Figure 2.3 : Onset of Disease ... 109 Figure 2.4 : Disease Staging (IIRC) ... 110
EXECUTIVE SUMMARY
FroData for Cataract Surgery Registry (CSR) in 2012 were collected from 36 participating centers in the Ministry of Health (MOH). Although the total number of cataract surgery increased, it was not representative of a national data as its portion in the private sector, the Ministry of Defence and the Ministry of Education was unknown. Ascertainment in MOH was encouraging but submission of data by some individual centers was still unsatisfactory. Nevertheless, effort is underway to make data entry or reporting of cataract surgery to CSR compulsory for all cataract surgeons. This will enable us to produce the true Cataract Surgical Rate for the country in future.
The percentage of patients having systemic co-morbidity in particular Hypertension and Diabetes Mellitus showed an increasing trend. This warrants more detailed pre-operative assessment for each patient presenting for cataract surgery. Public awareness also has to be intensified as only one third of patients returned for surgery in the fellow eye and less number operated in the same year.
In contract to the generally acceptable fact among surgeons that daycare is the more cost-effective way to perform cataract surgery, CSR data showed that day care service utilization was poor. This issue has to be addressed adequately by both the healthcare providers and the policy makers to identify barrier to daycare both from the patients’ and health care provider’s perspectives to ensure maximum utilization of daycare services.
In term of cataract surgery method, phacoemulsification surgery has become the preferred method of performing cataract surgery. It was also shown to be the safest and better method of cataract surgery with lower intra-operative complication and better post-operative outcomes. These results can hopefully be used by the policy makers in allocating adequate budget to support the consumables and the maintenance costs of phacoemulsification machines throughout the countries.
There was an improvement in patients’ visual outcome observed over the years but there were obvious variations in individual centre’ performance. Clinical audit and monitoring of outcomes particularly in centres with performances below standards is necessary
REPORT SUMMARY
CATARACT SURGERY REGISTRY 1. Stock and Flow
• From the year 2008 to 2012, out of 39 MOH hospitals with resident or visiting ophthalmologist, 36 hospitals participated in CSR.
• The number of SDP increased from 25 SDPs in 2002 to 36 SDPs in 2008 onwards.
• The total number of cataract surgery registered to CSR increased from 12798 in 2002 to 32473 in 2012. • The CSR ascertainment slightly reduced from 95.4% in 2011 to 94.5% in 2012
2. Characteristics of Patients
xvii
THE 6
thREPORT OF THE NATIONAL EYE DATABASE 2012
REPORT SUMMARY
age was younger than data published by the Swedish cataract surgery register (74 years old). • Up to 1/3 of patients presented within the age group of 65-74 years old (38.4% in 2012).
• The proportion of patients with systemic co-morbidity increased from 56.8% in 2002 to 72.4% in 2012.
• There was an increase in the proportion of patients presented for cataract surgery who had hypertension (from 35.4% in 2002 to 57.5% in 2012) and diabetes mellitus (from 28.9% in 2002 to 42.0% in 2012).
• Senile cataract was the commonest cause of primary cataract (98.3 % in 2012). • Trauma was the commonest cause for secondary cataract (51.5% in 2012).
• The proportion of patients who returned for cataract surgery in the fellow eye remained the same from 2002 to 2012, i.e. only one third (33.6% in 2012).
• Majority of the eyes had no prior ocular surgery (97.0% in 2012).The commonest prior ocular surgery was vitreoretinal surgery (1.1% in 2012).
• One third of the eyes had ocular co-morbidity (40.1% in 2012). The commonest ocular co-morbidity was diabetic retinopathy in any forms (10.7% in 2012).
• About half of the eyes had unaided vision in the category of 2/60-NPL (45.6% in 2012). • Refraction was not done in more than 2/3 of the eyes (77.5% in 2012).
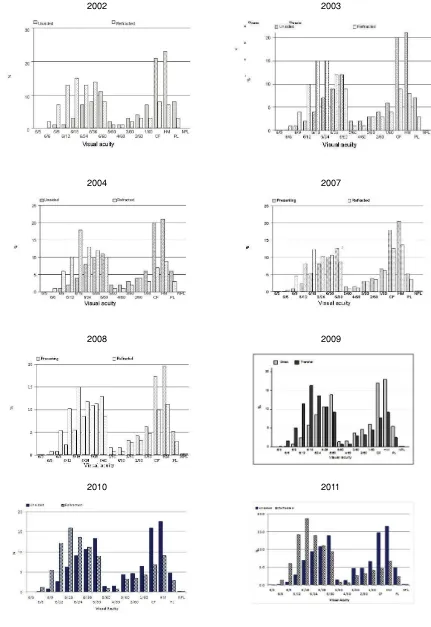
• Bimodal pattern of pre-operative vision was consistently observed over the years with one peak at the range between 6/18 to 6/36 and another peak at CF-HM.
• In term of the choice of IOL power, majority of surgeons chose target refraction as emmetropia or slightly myopic. The mean target refractive power in 2012 was -0.4D (SD 0.4).
3. Cataract Surgery Practice Patterns
• The number of cataract surgery performed by SDPs varied. In 2012, out of the 36 SDPs,9 performed less than 500 surgeries, 16 performed between 501 to 1000, and 11 performed more than 1000 cataract surgeries a year.
• The number of surgery performed was lower than average in the month of February and September and highest in July.
• Selangor (5 SDPs), Perak (4 SDPS)and Sarawak (4 SDPS), performed higher number of cataract surgeries compared to other state.
• More than 2/3 of the cataract surgery was performed by specialists (85.0% in 2012). • The percentage of cataract surgery done by medical officers is decreasing
• The median duration taken to do a cataract surgery was 25 min for phaco and 40 min for ECCE in 2012. • Though there is an increasing trend for day care surgery, from 39.3% in 2002 to 59.1% in 2011, the percentage
varied among SDPs. In 2011, 3 SDPs did not perform any cataract surgery under day care, 20 SDPs performed less than 50.0%. Only 10 SDPs performed more than 90.0% of cataract surgery as day care.
• Phaco was the preferred method of cataract surgery and the proportion increased from 39.7% in 2002 to 81.1% in 2012. Percentage of ECCE decreased from 54.0% in 2002 to 14.7% in 2012.
• The preferred IOL material was acrylic and non-foldable type.
• The percentage of phaco converted to ECCE was 1.9% in 2012. It remained the same over the years.
• Among combined surgery, VR surgery was the highest, while filtering surgery and pterygium surgery showed a decreasing trend.
• Majority of cases were done under local anaesthesia (93.1% in 2012). The preferred type of local anesthesia was topical (61.1% in 2012).
• The use of topical anesthesia has increased from 11.7% in 2002 to 61.1% in 2012. • The use of retrobulbar anesthesia has decreased from 25.9% in 2002 to 2.2% in 2012. • There is a decrease in the use of oral sedation (33.3% in 2002 to 6.0% in 2012).
• Majority of the patient operated had IOL implantation (98.5% in 2012). Among these patients who had IOL, 95.9% had posterior chamber IOL.
4. Intra-operative Complications
• The percentage of intra-operative complication decreased from 5.8% in 2011 to 5.2% in 2012 • PCR decreases from 3.1% in 2011 to 2.7% in 2012. It showed a decreasing trend over the years.
• Intra-op complication was seen among 48.3% of patients who had phaco converted to ECCE and 42.6% who had ICCE in 2012.
• In 2012, the percentage of intra-operative complication was higher in cataract surgeries performed by MO (8.0%), followed by gazetting specialists (7.9%) as compared to specialist (4.8%). For phaco surgeries, MO (6.2%), gazetting specialists (5.5%) and specialist (3.2%).
5. Cataract Surgery Outcome
• In average, more than 85.0% of patient registered to CSR had cataract surgery outcome data.
• The percentage of patients with post-operative endophthalmitis declined from 0.2% in 2002 (25 patients) to 0.04% in 2012 (13 patients)
REPORT SUMMARY
• Iris prolapse showed a decreasing trend but wound dehiscence, high post- operative IOP and IOL related problem demonstrated an increasing trend. IOL related problem demonstrated otherwise
• In eyes without ocular co-morbidity, less than 50.0% of eyes had post-op unaided visual acuity 6/12 or better and the patterns were consistent over the years. With refraction, more than 80.0% achieved post-op vision 6/12 or better (81.0% in 2002, 89.0% in 2003, 90.0% in 2004, 84.0% in 2007, 88.0% in 2008, 90.9% in 2009, 92.0% in 2010, 92.4% in 2011 and 92.6% in 2012). This observation suggested that poor post- op unaided vision was due to refractive error and patients’ vision could be improved with glasses.
• Patients who had phaco had better post-op visual outcome when compared to other type of surgeries. 94.2% of phaco patients had refracted vision of 6/12 or better in 2012 as compared to ECCE (84.1%), phaco convert to ECCE (73.6%), lens aspiration (87.9%) and ICCE (65.0%).
• Post-op visual outcome improved over the years. Refracted visual outcome of 6/12 or better among phaco patient improved from 87.0% in 2002 to 94.2% in 2012 and among ECCE patients from 78.0% in 2002 to 84.1% in 2012.
• In all type of surgeries, visual outcome became less favourable when there were intra-operative complications.
• The post-op visual outcomes within 1 week to 3 months was better in eyes with IOL implantation compared to non IOL, in eyes with foldable IOL and IOL made of acrylic.
• The main contributing factor for eyes with post-operative refracted VA worse than 6/12 was pre- existing ocular co-morbidity followed by high astigmatism and posterior capsule opacification.
• When patients with preexisting ocular co-morbidity were excluded from analysis, high astigmatism followed by preexisting ocular co-morbidity (not detected preoperatively) were the major causes of poor visual outcome. • In 2012, the choice of IOL power was aimed towards targeted refraction of -0.4D. However, post- operative
actual refraction was -0.3D for all eyes, -0.6D for phaco eyes, and -0.9D for ECCE eyes. Thus, eyes which had undergone ECCE had more myopic shift than eyes which had phaco.
• In 2012, there was disparity between the targeted and the actual refraction. 29.0% of eyes had a different in target and actual refraction of between 0 and -0.5D, and 22.1% had a different of between 0 to +0.5D.
• When analysed by SDPs, the results were varied. Some SDP did not achieve the difference of actual from target refraction of within +1.0D and -1.0D in all the eyes operated in 2012
RETINOBLASTOMA REGISTRY
CATARACT SURGERY REGISTRY 1. Stock and Flow
• A total of 119 patients registered, of which 11 patients were diagnosed in 2012.
2. Patients Demography
• Mean age at presentation was 2.2 years.
• Youngest age was 3 weeks and the oldest was 10.2 years.
• About a third (30.3%) of these patients was in the age group of 13 to 24 months and 26.1% were less than 12 months at presentation.
• More boys (56.3%) than girls were affected.
• Majority were of Malay ethnicity (54.6%), followed by Chinese (17.7%) and Indians (8.4%).
3. Ocular History and Presentation
• The most common presentation was leukocoria.
• Mean duration of disease from onset of symptoms to presentation was 4.5 months with the majority (80.2%) within 1 to 6 months.
• 43 patients (33.4%) had bilateral disease.
• 1 patient had positive family history of retinoblastoma.
4. Investigation and Classifi cation
• The presence of calcified mass was detected in 75.9% by CT scan.
• In patients who underwent MRI, 12.3% showed presence of mass but only 9.3% had calcification.
• Extraocular extension detected by CT scan in 10.5% of eyes and by MRI in 3.1% of eyes, the majority involved the optic pathway.
• Two-thirds (61.7%) of the patients presented with Group E Retinoblastoma.
5. Management
xix
THE 6
thREPORT OF THE NATIONAL EYE DATABASE 2012
REPORT SUMMARY
• 6 patients had subtenon injection of chemotherapy combined with systemic chemotheraphy
• 60 affected eyes out of 76 eyes (78.9%) with unilateral RB were enucleated with 44.7% of these eyes showed histopathological extension outside eyeball.
CHAPTER 1
CATARACT SURGERY REGISTRY 2012
2
THE 6
thREPORT OF THE NATIONAL EYE DATABASE 2012
CHAPTER 1 :
CATARACT SURGERY REGISTRY 2012
CHAPTER 1: CATARACT SURGERY 2012
1.1 STOCK AND FLOW
Table 1.1(a): Stock and Flow
Year 2002 2003 2004 2007 2008 2009
Number of SDP 25* 32* 33* 32 36 36
Total no. of cataract surgery registered to CSR
12798 16815 18392 18426 21496 24438
n % n % n % n % n % n %
Cataract surgery with visual outcome records
12512 97.7 14683 87.3 6228 33.9 15786 85.7 19063 88.7 20590 84.3
2010 2011 2012
36 36 36
28506 30611 32473
n % n % n %
24521 86.0 27219 88.9 28589 88.0
*2002, 2003 and 2004 included private centre and University Hospital
The CSR ascertainment in 2012 was slightly lower than the year before.
Table 1.1(b): Ascertainment for MOH Hosp 1
Year 2002 2003 2004 2007 2008 2009 2010 2011 2012
Total number of cataract surgery performed at MOH Hospitals (Source: MOH census returns)
14316 16498 18884 22051 25393 26274 29873 32099 34363
Total number of cataract surgery performed at MOH hospitals and registered to CSR
12552 16039 17536 18426 21496 24438 28506 30611 32473
CATARACT SURGERY REGISTRY 2012
: CHAPTER 1
Figure 1.1(a): Stock and flow
Hospital Keningau, Kuala Krai, Kota Bharu and Pulau Pinang had poor CSR submission. Hospital Ipoh, Kota Bharu, Kuala Lumpur and Johor Bharu had poor outcome form submission. Hospital Tawau had post-op refraction data submission.
Table 1.1(c): Ascertainment for CSR by SDP in 2012
4
THE 6
thREPORT OF THE NATIONAL EYE DATABASE 2012
CHAPTER 1 :
CATARACT SURGERY REGISTRY 2012
Miri 924 901
Figure 1.1(c): Ascertainment for CSR by SDP in 2012
1.2 CHARACTERISTICS OF PATIENT
1.2.1 Patient Demography
THE 6
th
REPOR
T O
F THE
N
A
TION
A
L E
YE D
A
T
ABASE 2012
C
A
T
ARACT
SURGER
Y R
EGISTR
Y
2012
: CHAPTER 1
Table 1.2.1: Age and Gender Distributions, CSR 2002-2012
Year 2002* 2003* 2004* 2007 2008 2009 2010 2011 2012
Total number of cataract surgery
12798 16815 18392 18426 21496 24438 28506 30611 32473
Age
Mean (years) 64.0 63.7 63.5 64.3 64.6 64.7 65.0 65.0 65 Median (years) 66 66 66 66 66 66 66 66 66 Minimum (month) 1.0 1.0 1.0 1.0 1.0 1.2 1.8 2.6 0.8 Maximum (years) 97 100 104 97 102 99 99 104 99
% Distribution
Age group, years n % n % n % n % n % N % n % n % n %
<1 21 0.2 23 0.1 50 0.3 18 0.1 34 0.2 17 0.1 7 0.0 11 0.0 14 0.0 1-14 171 1.3 202 1.2 266 1.5 50 0.3 116 0.5 148 0.6 170 0.6 169 0.6 192 0.6 15-24 101 0.8 139 0.8 134 0.7 141 0.8 133 0.6 129 0.5 143 0.5 175 0.6 139 0.4 25-34 115 0.9 147 0.9 207 1.1 120 0.7 167 0.8 210 0.9 227 0.8 215 0.7 242 0.8 35-44 376 2.9 575 3.4 526 2.9 157 0.9 539 2.5 557 2.3 655 2.3 632 2.1 670 2.1 45-54 1472 11.5 1974 11.7 2238 12.2 499 2.7 2407 11.2 2697 11.0 3043 10.7 3170 10.4 3077 9.5 55-64 3415 26.7 4496 26.7 4882 26.5 2135 11.6 6037 28.1 6956 28.5 8225 28.9 8987 29.4 9447 29.1 65-74 4880 38.1 6480 38.5 7051 38.3 5031 27.3 8307 38.6 9534 39.0 10720 37.6 11479 37.5 12474 38.4 75-84 2041 16.0 2511 14.9 2722 14.8 7103 38.6 3391 15.8 3802 15.6 4805 16.9 5294 17.3 5707 17.6 >=85 206 1.6 264 1.6 316 1.7 2889 15.7 344 1.6 388 1.6 509 1.8 479 1.6 511 1.6 Missing NA - 4 0.0 NA - 283 1.5 21 0.1 0 0.0 2 0.0 0 0.0 0 0.0
Gender
6
THE 6
thREPORT OF THE NATIONAL EYE DATABASE 2012
CHAPTER 1 :
CATARACT SURGERY REGISTRY 2012
Figure 1.2.1: Age Distribution, CSR 2002-2012
1.2.2 Medical history
1.2.2.1 Systemic co-morbidity
THE 6
th
REPOR
T O
F THE
N
A
TION
A
L E
YE D
A
T
ABASE 2012
C
A
T
ARACT
SURGER
Y R
EGISTR
Y
2012
: CHAPTER 1
Table 1.2.2.1: Distribution of Systemic Co-Morbidity, CSR 2002-2012
Year 2002 2003 2004 2007 2008 2009 2010 2011 2012
No of patients (N) 12798 16815 18392 18426 21496 24438 28506 30611 32473
Percentage of patients with any systemic co-morbidity
56.8 59.1 59.9 67.5 68.7 71.0 70.6 72.0 72.4
Percentage of patients with specifi c systemic co-morbidity
n % n % n % n % n % n % n % n % n %
1. Hypertension 4529 35.4 6408 38.1 7425 40.4 8630 46.8 10932 50.9 13050 53.4 15630 54.8 17238 56.3 18655 57.5
2. Diabetes Mellitus 3694 28.9 5136 30.5 5800 31.5 6869 37.3 8188 38.1 9556 39.1 11598 40.7 12778 41.7 13635 42.0
3. Ischaemic Heart Disease 1148 9.0 1538 9.1 1782 9.7 1668 9.1 2037 9.5 2294 9.4 2441 8.6 2515 8.2 2565 7.9
4. Renal Failure 211 1.6 303 1.8 351 1.9 461 2.5 624 2.9 679 2.8 804 2.8 814 2.7 822 2.5
5. Cerebrovascular accident 106 0.8 165 1.0 174 0.9 0 0.0 29 0.1 305 1.2 302 1.1 380 1.2 352 1.1
6. COAD/Asthma 669 5.2 907 5.4 955 5.2 798 4.3 955 4.4 1039 4.3 1024 3.6 1088 3.6 1104 3.4
7. Others 935 7.3 2409 7.2 861 4.7 1399 7.6 1974 9.2 2460 10.1 2891 10.1 3538 11.6 3916 12.1
8
THE 6
th
REPOR
T O
F THE
N
A
TION
A
L E
YE D
A
T
ABASE 2012
CHAPTER 1 :
C
A
T
ARACT
SURGER
Y R
EGISTR
Y
2012
1.2.2.2 Causes of cataract
Majority of the patients presented with primary cataract. In eyes with primary cataract, senile or age-related cataract was the commonest. In eyes with secondary cataract, trauma was the commonest. This pattern remained unchanged over the years.
Table 1.2.2.2: Causes of Cataract, CSR 2002-2010
Year 2002 2003 2004 2007 2008 2009 2010 2011 2012
No of patients (N) 12798 16815 18392 18426 21496 24438 28506 30611 32473 n % n % n % n % n % n % n % n % n %
Primary cataract 12294 96.1 16161 96.1 17697 96.2 17410 94.4 20329 94.6 23117 94.6 26981 94.7 29050 94.9 30813 94.9
Secondary cataract 499 3.9 654 3.9 695 3.8 557 3.0 530 2.5 587 2.4 660 2.3 764 2.5 608 1.9
Missing value - - - 460 2.5 637 3.0 734 3.0 865 3.0 797 2.6 1052 3.2
Primary Cataract (N) 12294 16161 17697 17410 20329 23117 26981 29050 30813
n % n % n % n % n % n % n % n % n %
Senile/age related 11960 97.3 15623 96.7 17290 97.7 17075 98.1 19995 98.4 22782 98.6 26671 98.9 28736 98.9 30299 98.3
Congenital 130 1.1 175 1.1 173 1.0 129 0.7 124 0.6 124 0.5 44 0.2 34 0.1 57 0.2
Development 155 1.3 317 2.0 209 1.2 169 1.0 156 0.8 166 0.7 236 0.9 249 0.9 419 1.4
Others 49 0.4 46 0.3 25 0.1 37 0.2 54 0.3 45 0.2 30 0.1 31 0.1 38 0.1
Secondary Cataract (N) 499 654 695 557 530 587 660 764 608
n % n % n % n % n % n % n % n % n %
Trauma 325 65.1 399 61 440 63.3 355 63.7 330 62.3 330 56.2 346 52.4 383 50.1 313 51.5
Drug induced 53 10.6 81 12.4 84 12.1 55 9.9 76 14.3 79 13.5 64 9.7 60 7.9 46 7.6
Surgery induced 23 4.6 67 10.2 56 8.1 82 14.7 39 7.4 107 18.2 93 14.1 101 13.2 122 20.1
THE 6
th
REPOR
T O
F THE
N
A
TION
A
L E
YE D
A
T
ABASE 2012
C
A
T
ARACT
SURGER
Y R
EGISTR
Y
2012
: CHAPTER 1
1.2.2.3 First or Fellow Eye Surgery
Two third of patients were operated for the first time. Only one third of the patients returned for second surgery (for the fellow eye). This pattern remained unchanged since 2002. This was despite the declining percentage of eyes with intra-operative complications during surgery in the previous eye surgery (from 24.4% in 2002 to 2.6% in 2012).
Overall data showed that, the percentage of patients who had fellow eye surgery in the same year showed an initial increasing trend (from 4.5% in 2002 to 11.1% in 2009). But the percentage started to decline thereafter (7.5% in 2010 to 7.8% in 2012). The mean duration between the first and fellow eye showed an increasing trend, from 16 months in 2002 to 41 months in 2012.
Table 1.2.2.3: First or Fellow Eye Surgery, CSR 2002-2012
Year 2002 2003 2004 2007 2008 2009 2010 2011 2012
No of patients (N) 12798 16815 18392 18426 21496 24438 28506 30611 32473 n % n % n % n % n % n % n % n % n %
First eye surgery 8958 70.0 11851 70.5 12911 70.2 12810 69.5 14610 68.0 16446 67.3 18919 66.4 20466 66.9 21539 66.3
Fellow eye surgery 3840 30.0 4964 29.5 5481 29.8 5559 30.2 6849 31.9 7938 32.5 9441 33.1 10088 33.0 10896 33.6
Missing NA - NA - NA - 57 0.3 37 0.2 54 0.2 146 0.5 57 0.2 38 0.1
Patients who had second surgery in the same year
573 4.5 713 4.2 825 4.5 759 4.1 1135 5.3 2702 11.1 2129 7.5 2246 7.3 2545 7.8
Period of time between fi rst and fellow eye surgery (months)
N 2716 3322 3673 4860 5953 7353 9378 10009 10784
Mean 16.7 16.3 16.9 23.4 22.0 24.4 36.1 39.2 40.9
SD 18.0 17.1 18.8 24.3 22.8 31.5 43.6 49.3 52.4
Median 10.3 10.1 10.5 13.3 13.1 12.1 15.1 15.4 14.7
Patients who had cataract surgery before
3840 4964 5481 5559 6849 7938 9441 10008 10896
n % n % n % n % n % n % n % n % n %
Eyes with intra-operative complications during surgery in the first eye
10
THE 6
th
REPOR
T O
F THE
N
A
TION
A
L E
YE D
A
T
ABASE 2012
CHAPTER 1 :
C
A
T
ARACT
SURGER
Y R
EGISTR
Y
2012
1.2.2.4 Past Ocular Surgery of the Operated Eye
Most eyes to be operated had no prior ocular surgery. The commonest past ocular surgery was vitreoretinal (VR) surgery. The percentage of eye with past history of filtering surgery and penetrating keratoplasty remained low.
Table 1.2.2.4: Past Ocular Surgery of the Operated Eye, CSR 2002-2012
Year 2002 2003 2004 2007 2008 2009 2010 2011 2012
No. of patients 12798 16815 18392 18426 21496 24438 28506 30611 32473
No. of eyes with past ocular surgery record (N)
12798 16782 18372 17379 20674 23109 26711 28349 30687
n % n % n % n % n % n % n % n % n %
Patients with no past ocular surgery
12414 97.0 16178 96.4 17711 96.4 16545 95.2 20010 96.8 22387 96.9 25870 96.9 27400 96.7 29770 97.0
Vitreoretinal surgery 8959 0.7 1510 0.9 1653 0.9 261 1.4 161 0.8 267 1.2 352 1.3 325 1.1 326 1.1
Pterygium excision 77 0.6 1177 0.7 92 0.5 869 0.5 140 0.7 164 0.7 21 0.1 11 0.0 208 0.7
Filtering surgery 77 0.6 1007 0.6 1102 0.6 1043 0.4 57 0.3 69 0.3 65 0.2 80 0.3 75 0.2
Penetrating keratoplasty 13 0.1 168 0.1 184 0.1 1738 0.1 14 0.1 18 0.1 212 0.8 207 0.7 11 0.0
Others 1408 1.1 235 1.4 276 1.5 417 2.4 304 1.5 216 0.9 203 0.8 332 1.2 305 1.0
THE 6
One third of the eyes to be operated had ocular co-morbidities. The commonest was diabetic retinopathy (DR) in any forms then followed by glaucoma. The percentage of eyes with DR appeared to be decreasing from 2010 onwards. The percentage of eyes presented with lens related complications (phacolytic and phacomorphic) appeared to be decreasing.
Table 1.2.2.5: Distribution of Pre-existing Ocular Co-Morbidity, CSR 2002-2012
Year 2002 2003 2004 2007 2008 2009 2010 2011 2012
No of patients (N) 12798 16815 18392 18426 21496 24438 28506 30611 32473
N % n % n % n % n % n % n % n % n %
Patients with any ocular co-morbidity 3691 28.8 6068 36.1 6993 38.0 5973 32.4 7269 33.8 9442 38.6 11977 42.0 12756 41.7 13024 40.1
Patients with specifi c ocular co-morbidity
Anterior segment
1. Glaucoma 795 6.2 1096 6.5 1238 6.7 1126 6.1 1408 6.6 1655 6.8 1799 6.3 1976 6.5 2095 6.5 2. Pterygium involving the cornea 342 2.7 393 2.3 349 1.9 288 1.6 319 1.5 345 1.4 387 1.4 405 1.3 405 1.3 3. Pseudoexfoliation 184 1.4 254 1.5 209 1.1 221 1.2 253 1.2 318 1.3 289 1.0 312 1.0 365 1.1 4. Corneal opacity 184 1.4 200 1.2 183 1.0 176 1.0 194 0.9 231 0.9 251 0.9 299 1.0 311 1.0 5. Chronic uveitis 54 0.4 48 0.3 80 0.4 81 0.4 63 0.3 80 0.3 89 0.3 98 0.3 70 0.2
Len related complication
1. Phacomorphic 106 0.8 152 0.9 118 0.6 89 0.5 85 0.4 83 0.3 120 0.4 114 0.4 138 0.4 2. Phacolytic 61 0.5 63 0.4 79 0.4 44 0.2 45 0.2 47 0.2 59 0.2 69 0.2 41 0.1 3. Subluxated/Disclosed 87 0.7 110 0.7 86 0.5 101 0.5 89 0.4 83 0.3 95 0.3 119 0.4 120 0.4
Posterior segment
1. Diabetic Retinopathy: Non Proliferative
12
THE 6
th
REPOR
T O
F THE
N
A
TION
A
L E
YE D
A
T
ABASE 2012
CHAPTER 1 :
C
A
T
ARACT
SURGER
Y R
EGISTR
Y
2012
9. Cannot be assessed 884 6.9 1962 11.7 2290 12.5 1357 7.4 2092 9.7 3139 12.8 4457 15.6 5053 16.5 4914 15.1
Miscellaneous
1. Amblyopia 64 0.5 61 0.4 78 0.4 71 0.4 65 0.3 62 0.3 75 0.3 99 0.3 98 0.3 2. Significant previous eye trauma 52 0.4 80 0.5 96 0.5 41 0.2 39 0.2 39 0.2 51 0.2 45 0.2 49 0.1 3. Pre-existing non
glaucoma field defect
2 0.0 3 0.0 4 0.0 4 0.0 2 0.0 6 0.0 3 0.0 4 0.0 6 0.0 4. Others 380 3.0 827 4.9 1153 6.3 668 3.6 755 3.5 1053 4.3 1321 4.6 1505 4.9 1729 5.3 *CSME=Clinically Signifi cant Macular Oedema
Number or percentage may be more than total or 100% as patients might have more than one ocular co-morbidity
THE 6
th
REPOR
T O
F THE
N
A
TION
A
L E
YE D
A
T
ABASE 2012
C
A
T
ARACT
SURGER
Y R
EGISTR
Y
2012
: CHAPTER 1
1.2.2.6 Pre-operative Vision
In each year, more than 70% of all patients did not have refraction pre-operatively. The proportion of eyes operated (with unaided vision) in the category of 2/60-NPL appeared to be decreasing but the percentages were still high. The bimodal pattern of pre-operative vision remained the same over the years. The first peak was at 6/18 and the second peak was at CF/HM. There was a low proportion of patients between 5/60 to1/60.
Table 1.2.2.6: Distribution of Pre-Operative Vision, CSR 2002-2012
Year 2002 2003 2004 2007 2008 2009 2010 2011 2012
No. of patients (N) 12798 16815 18392 18426 21496 24438 28506 30611 32473 n % n % n % n % n % n % n % n % n %
Patients with unaided VA 12691 99.2 16723 99.4 18222 99.1 18356 99.6 21212 98.7 23796 97.4 27977 98.1 30018 98.1 31833 98.0
Patients with refracted VA 700 5.5 2104 12.6 2319 12.7 5071 27.8 5683 26.4 5150 21.1 7895 27.7 7932 25.9 7315 22.5
Patients with no refraction 12098 94.5 14711 87.5 16073 87.4 13355 72.5 15813 73.6 19288 78.9 20611 72.3 22679 74.1 25158 77.5
6/5- 6/12
Unaided 281 2.2 396 2.4 523 2.9 602 3.3 646 3.0 788 3.3 1016 3.6 1133 3.8 1397 4.4
Refracted 155 22.1 327 15.5 396 17.1 678 13.3 935 16.4 944 18.3 1474 18.7 1712 21.6 1840 25.2
6/18- 3/60
Unaided 4465 35.2 6440 38.5 7235 39.7 7734 42.4 9375 44.2 10849 45.6 13073 46.7 14569 48.5 15923 50.0
Refracted 374 53.4 1198 56.9 1315 56.7 2375 46.9 2892 50.9 2796 54.3 4324 54.8 4536 57.2 4262 58.3
2/60- NPL
Unaided 7945 62.6 9887 59.1 10464 57.4 9920 54.3 11180 52.7 12159 51.1 13888 49.6 14316 47.7 14513 45.6
Refracted 171 24.4 579 27.5 608 26.2 2018 39.8 1845 32.5 1410 27.4 2097 26.6 1684 21.2 1213 16.6
Unaided VA for patient with no refraction
n 13355 15813 19288 20611 22679 25158
6/5 – 6/12 396 3.0 414 2.6 553 2.9 651 3.2 702 3.1 887 3.5
6/18 – 3/60 5133 38.4 6149 38.9 7828 40.5 8239 40.0 9350 41.2 10948 43.5