Summary Daytime xylem sap flow was measured by the compensation heat pulse velocity technique in dipterocarp forest trees growing on sandy loam (haplic acrisol) and in heath forest trees growing on bleached sand (albic arenosol) in Brunei during wet and dry periods. In dipterocarp forest trees, daily sap flow was stable during the dry period but declined on rainy days presumably as a result of reduced transpiration. At the heath site, daily sap flow of the small trees was stable during the dry period, whereas it declined in the large trees as the dry season progressed. In some trees at both sites, the hydroactive area of xylem was less during the dry period than during the wet period. Daily sap flow was linearly related to projected crown area, and a common regression fitted trees of different species from both forest types. The dry/wet period ratio of sap flow (about 0.7) was statistically equivalent for heath and dipterocarp forest trees, whereas it had been expected that trees on the freely draining arenosol would suffer greater water stress during drought. For well-watered trees ≥ 0.2 m dbh (diameter at 1.3 m above ground) in both the dipterocarp and heath forests, stand water use was estimated to be 40 mm month−1.
Keywords:stand water use, tropical forest.
Introduction
In the humid tropics of Borneo, heath forest, characterized by floristically distinct vegetation with small tough, leathery leaves (microphylly and sclerophylly), develops on coarsely textured, very sandy soils. Taller, more species-rich diptero-carp forests occur on soils containing clay (Whitmore 1984). It is not known whether the special features of heath vegetation are due mainly to nutrient deficiency, especially phosphate limitation (Loveless 1962, Beadle 1966, Specht 1979), water stress (Brunig 1971, Kruger 1979, Whitmore 1989), or an interaction between water regime and nutrient availability (Klinge and Medina 1979, Bongers et al. 1985). Many of the attributes of heathland species such as slow growth rates and sclerophylly are characteristic of plants adapted to conserve nutrients or water (Connor and Doley 1981).
I measured sap flow in individual trees by the compensation heat pulse velocity technique to test the hypothesis that water uptake is reduced more in heath forest than in dipterocarp
forest during drought. Preliminary estimates of stand water use are also reported.
Materials and methods
Sap flow measurements were made in a mixed dipterocarp forest at Andulau Forest Reserve (4.66° N, 114.52° E, 37--59 m asl) and in a tropical heath forest at Badas Forest Reserve (4.57° N, 114.41° E, 11--16 m asl) in Brunei (central north Borneo). Annual rainfall is about 3000 mm with drier periods (≤ 100 mm month−1) occurring in March and August (Becker 1992). A general description of heath and dipterocarp forests is given by Whitmore (1984). The vegetation and soils at the study sites have been described in detail by Ashton (1964) and Brunig (1974). Davies and Becker (1995) have shown that the floristic composition and stand structure of the 0.96-ha study plots are characteristic of their respective forest types. The sandstone-derived haplic acrisols and dystric fluvisols in the dipterocarp forest plot exceed 1 m in depth. Slopes are moder-ate (≤ 20°) and have a 0.1-m thick humus layer overlying loamy sand grading to sandy loam. On the terrace in the heath forest plot, an albic arenosol with a 0.15-m thick humus layer overlies an indurated humic horizon at 2 m depth. Stem basal area (39 and 36 m2) and stem frequency (1484 and 1341) of trees ≥ 0.05 m dbh (diameter at 1.3 m above ground) were similar in the dipterocarp and heath forest plots, respectively. The heath forest was 30--50 m in height and had 113 tree species, whereas the dipterocarp forest was 40--60 m in height and contained 393 species; only 7% of all species occurred in both plots. Species dominance was greater in the heath forest with Agathis borneensis comprising 65% of the total basal area compared with only 7% for the most dominant species, Dryo-balanops aromatica, in the dipterocarp forest plot. The five species with the largest total stem basal area and the five most frequent species were selected from each forest type for study (Table 1).
Dry period measurements were made during April 10--24, 1993, following 81 days in which the 30-day total rainfall was less than 100 mm (Figure 1). Wet period measurements were made during November 22--29 and December 21--28, 1993 (Trees A0303, A1239 and B0430 only), when the 30-day total rainfall exceeded 150 mm.
Sap flow in Bornean heath and dipterocarp forest trees during wet and
dry periods
PETER BECKER
Biology Department, Universiti Brunei Darussalam, Bandar Seri Begawan 2028, Brunei, SE Asia
Received March 2, 1995
Sap flow measurements
The compensation heat pulse velocity technique was used to measure sap flow in 10 trees at both sites simultaneously. On each tree, two probe sets were implanted opposite each other and monitored with a data logger. Each probe set comprised two stainless steel sensor probes containing two pairs of ther-mistors spaced 10 mm apart and aligned 10 mm above and 5 mm below a central heater probe (Greenspan Technology, Warwick, Queensland, Australia). Heat pulse duration was 1.2 or 1.6 s, and heat pulse velocity at four depths in the
hydroac-tive xylem was recorded every 30 min. A core was taken near to where probes were implanted to determine, by color and texture, the approximate inner and outer boundaries of the sapwood and its volume fractions of wood and water. To account for tree size effects, crown areas were calculated from a vertical projection of the crown perimeter, sighted with the aid of a self-leveling mirror.
Sap flow analysis
Sap velocity-depth profiles were compared for the peak (1000--1400 h) and minimum (2200--0200 h) flow periods (Figure 2). If the sap velocity (mean − 2 SE) of the peak period overlapped that (mean + 2 SE) of the minimum period, that depth was considered nonhydroactive. That is, the absence of diel fluctuation in sap velocity at a particular depth was taken to indicate nonconductive tissue, and sapwood boundaries were adjusted accordingly. This approach was necessary be-cause it is impossible to distinguish low from zero sap flow by the compensation heat pulse velocity method. For this reason also, sap flow calculations were restricted to daytime (sunrise to sunset). Sap velocities were calculated using SAPCAL X software (v. 2.51, Greenspan Technology) as described by Edwards and Warwick (1984), with no imposed time-out value for return to thermal balance. Heat pulse velocity was cor-rected for implantation wound effects (Swanson and Whitfield 1981), based on a wound diameter of 2.2 mm. Sap flow was Table 1. Species selected for sap flow measurements based on the top five contributors to stand basal area and frequency. Selected trees were mostly members of the main canopy and emergent ‘‘strata’’ with crown exposures of 75--100%, exceptions being Trees A1216, B 1218 and B0233 with exposures of 50--75, 50--75 and 25--50%, respectively.
Tree number Species Family Diameter (mm)1
Dipterocarp
A0047 Pentace adenophora Kosterm. Tiliaceae 560
A00652 Dipterocarpus globosus Vesque Dipterocarpaceae 534
A0303 Dryobalanops aromatica Gaertn. f. Dipterocarpaceae 750
A0515 Shorea ovalis (Korth.) Bl. Dipterocarpaceae 645
A12162 Shorea quadrinervis V. Sl. Dipterocarpaceae 375
A1239 Shorea faguetiana Heim. Dipterocarpaceae 907
A13252 Shorea mecistoperyx Ridl. Dipterocarpaceae 1010
A1326 Lophopetalum subovatum King Celastraceae 440
A1451 Hopea beccariana Burck. Dipterocarpaceae 318
A14892 Shorea scaberrima Burck. Dipterocarpaceae 349
Heath
B0047 Cotylelobium burckii Heim. Dipterocarpaceae 322
B0233 Eugenia muelleri Miq. Myrtaceae 257
B0349 Lophopetalum pachyphyllum King Celastraceae 476
B0430 Heritiera albiflora (Ridl.) Kosterm. Sterculiaceae 277
B0618 Castanopsis foxworthyi Schot. Fagaceae 203
B06663 Agathis borneensis V. Sl. Araucariaceae 634
B0716 Isonandra lanceolata Wight Sapotaceae 425
B1068 Nephelium lappaceum Linn. Sapindaceae 188
B1218 Stemonurus umbellatus Becc. Icacinaceae 238
B1222 Vatica mangachapoi Blanco Dipterocarpaceae 229
1 Over bark at probe implantation height.
2 Sap flow measurement during the dry or wet period, or both, was unsuccessful due to instrument malfunction or sensor misplacement. 3 Sap flow was not reliably measured because of indeterminate inner boundary of hydroactive xylem.
calculated by using an area-weighted average of the point estimates of sap velocity as described by Hatton et al. (1990)
Results and discussion
Daily variation in sap flow
In the dipterocarp forest, daily sap flow was stable during the dry period, but declined on rainy days when low vapor pressure deficits and low incident radiation presumably reduced
tran-spiration (Figure 3a). In both forests, coefficients of variation within trees were low, ranging from 4 to 15% (n = 15 days, mostly) during the dry period and 8 to 21% during the wet period (n = 8 days). In the heath forest, daily sap flow was stable during the rainless period in the small trees, but it declined throughout the rainless period in the large trees, especially in A. borneensis (Figure 3b).
Tree size and seasonal variation in sap flow
There was a linear relation between mean daily sap flow and projected crown area, although the coefficient of determina-tion (r2) was less in the dry period than in the wet period (Figure 4). Èermák et al. (1995) also noted that among-tree variation in sap flow is greater during a dry period than during a wet period. There was up to 2.5-fold variation among simul-taneous duplicate or triplicate measurements of sap flow on the same tree, and the variation was greater in large trees than in small trees (Figure 5). However, the scatter about the regres-sions for the multispecies plot in Figure 4 was no greater than that for the single species shown in Figure 5, indicating that the species effect was small compared with that of tree size. The same regression provided a good fit for both forest types, especially during the wet period (Figure 4). Jordan and Kline (1977) also concluded that the relation between transpiration and sapwood area was independent of species and soil type.
Mean peak sap velocities were lower during the dry period than during the wet period in four of seven dipterocarp forest trees and seven of nine heath forest trees. Three trees had smaller hydroactive areas during the dry period than during the wet period (Figure 2), probably as a result of the formation of embolisms caused by water stress (see Hatton et al. 1995). Steinberg et al. (1989) also stated that the conducting area of xylem is not constant over time.
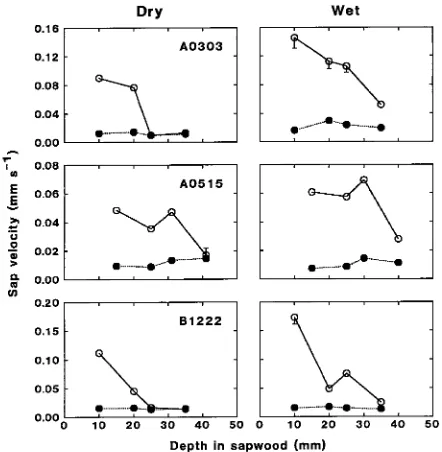
I hypothesized that, during drought, heath forest trees grow-ing on well-drained sand would exhibit a relatively greater reduction in water use than dipterocarp forest trees growing on sandy loam. Based on the slopes of the reduced major axis regressions, which intersected only for the smallest measured trees (Figure 4), daily sap flow was significantly lower during Figure 2. Variation of sap velocity with depth in sapwood during
periods of peak (1000--1400 h, s) and minimum (2200--0200 h, d) sap flow in dry (April 1993) and wet (November--December 1993) periods. Values are means of observations at 30-min intervals over a 7-day period. One-sided error bars (2 SE) are shown when they exceed symbol size. Sapwood exceeding 25 mm in depth in Trees A0303 and B1222, and 40 mm in depth in Tree A0515, was considered nonhy-droactive in the dry period.
the dry period than the wet period. However, the relative reduction in water use during the dry period was not signifi-cantly different (Mann-Whitney test, U = 33, P = 0.48) be-tween heath and dipterocarp forest trees. Median values of the dry/wet period ratio of mean daytime sap flow per tree were 0.8 (range 0.4--1.5, n = 6) and 0.6 (range 0.4--1.5, n = 9) for the dipterocarp and heath forest trees, respectively. These results suggest that the heath forest trees had access to deep water, or that within-tree variation in sap flow measurements prevented detection of different responses to drought by the two forest types. However, during a severe drought in an Amazonian forest, measurements of water absorption from the upper 8 m of soil indicated that evapotranspiration declined just 25% from the rates measured at the beginning of the dry season (Nepstad et al. 1995), a value similar to that measured in the present study.
Stand water use
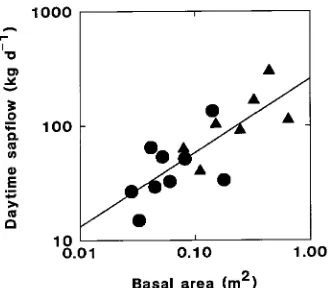
Because bole diameters were the only measure of size recorded for most of the trees in the 0.96-ha study plots, basal area was used to scale transpiration from this nonrandom sample of trees to the stand (cf. Calder et al. 1992). However, the regres-sion of sap flow against basal area, after log-transformation to linearize the data (Figure 6), indicated that basal area (r2 = 0.62) was not as effective as crown area (r2 = 0.91) in account-ing for the variation in sap flow among trees duraccount-ing the wet period (cf. Figures 4 and 6).
Another limitation of the stand estimate of heath forest water use is the lack of an accurate measurement of sap flow in the dominant emergent A. borneensis. The behavior of this species, which accounts for 65% of the stand basal area, is likely to dictate soil water availability for most of the other species in the forest. Unfortunately, the deep (at least 120 mm) hydroactive zone of A. borneensis made it difficult to obtain accurate measurements of sap flow. Ng (1986) has reported several other tropical species in which heartwood is absent.
Applying the regression in Figure 6 to the basal area of all trees ≥ 0.2 m dbh (n = 196 in both study plots) yielded estimates of stand water use that were virtually identical for dipterocarp and heath forest: 40 and 41 mm month−1, respec-tively. This result reflects both the similar size class distribu-tions of the larger trees in the two stands (Davies and Becker 1995) and the use of a common regression. When separate regressions were calculated, the estimated water use was 43 and 35 mm month−1 for dipterocarp forest and heath forest, respectively. Nocturnal water use may be nontrivial, but this was ignored.
Stand water use was modest compared with monthly rainfall (64 mm in April 1993 (dry period), 155 mm and 379 mm in November and December, 1993, respectively (wet period)), which partly reflects the restriction of the calculations to trees ≥ 0.2 m dbh. Although trees of this size made up 75% of stand Figure 4. Relation between mean daily daytime sap flow and projected
crown area for dipterocarp forest trees (triangles) and heath forest trees (circles) during wet (solid) and dry (open) periods. Because the regres-sion slopes for dipterocarp and heath forest trees were not significantly different (P > 0.05), common regressions were fitted for the two forest types. The reduced major axis regression slopes of the wet and dry periods were significantly different (Clarke’s (1980) test, T12 = 3.57,
df = 15.5, P < 0.01): wet, Y = 4.86 + 1.23X (n = 16, r2 = 0.91); dry, Y = 19.2 + 0.631X (n = 16, r2 = 0.56).
Figure 5. Relation between mean daily daytime sap flow and projected crown area for Dryobalanops aromatica trees of different sizes during a wet period (August 2--11, 1993). Simultaneous, duplicate determi-nations (,, n) of sap flow and crown area were made on all but the smallest tree and combined (r) (after Becker and Barker 1995).
Figure 6. Relation between mean daily daytime sap flow and stem basal area for dipterocarp trees (m) and heath forest trees (d) during the wet period. Because the reduced major axis regression slopes for the dipterocarp and heath forest trees were not significantly different (P > 0.5), a common line was fitted by least squares regression for predictive purposes, following log-transformation of both variables to linearize the data (Sokal and Rohlf 1981), where Y = 2.41 + 0.647X
basal area, they apparently accounted for just half of stand water use, based on an extrapolation of the regression in Figure 6 to the smallest trees (0.05 m dbh) measured in the plots. Hence, an accurate estimate of stand water use will require measurement of the numerous small understory trees. Bruijnzeel (1990) calculated transpiration as the difference between total evapotranspiration and interception for nine low-land tropical forests. He reported a range of 885 to 1285 mm year−1 and an average of 1045 mm year−1 (87 mm month−1). Doubling my estimate of stand water use based on sap flow measurements brings it in line with Bruijnzeel’s (1990) esti-mate of stand transpiration. However, it is likely that under-story trees will use less water for their size than predicted by extrapolation from overstory trees, given that maximum sto-matal conductance decreases with depth in the canopy (Roberts et al. 1990).
Acknowledgments
This research was funded by Universiti Brunei Darussalam and facili-tated by the Department of Forestry. Hj Rusian bin Kurus and Andrew Smith assisted with field work, and Martin Barker was a valued collaborator. Travel funds were provided by the International Tropical Timber Organization. Martin Barker, Sampurno Bruijnzeel and Tim Whitmore provided helpful comments on an earlier draft of this paper.
References
Ashton, P.S. 1964. Ecological studies in the mixed dipterocarp forests of Brunei State. Oxford For. Mem. No. 25, 75 p
Beadle, N.C.W. 1966. Soil phosphate and its role in molding segments of the Australian flora and vegetation, with special reference to xeromorphy and sclerophylly. Ecology 47:991--1007.
Becker, P. 1992. Seasonality of rainfall and drought in Brunei Darus-salam. Brunei Mus. J. 7(4):99--109.
Becker, P. and M.G. Barker. 1995. Sap flow within different sized trees of Dryobalanopsaromatica Gaertn. f. (Dipterocarpaceaea) in a mixed dipterocarp forest of Brunei Darussalam. Proc. 5th Round Table Conf. on Dipterocarps, Chiang Mai, Thailand. Eds. S. Ap-panah and K.C. Khoo. For. Res. Inst. Malaysia, Kuala Lumpur. In press.
Bongers, F., D. Engelen and H. Klinge. 1985. Phytomass structure of natural plant communities on spodsols in southern Venezuela: the Bana woodland. Vegetatio 63:13--34.
Bruijnzeel, L.A. 1990. Hydrology of moist tropical forests and effects of conversion: a state of knowledge review. Free University, Am-sterdam, 224 p.
Brunig, E.F. 1971. On the ecological significance of drought in the equatorial wet evergreen (rain) forest of Sarawak (Borneo). In The Water Relations of Malesian Forests. Ed. J.R. Flenley. Dept. Geog-raphy, Univ. Hull, Misc. Ser. No. 11, pp 65--97.
Brunig, E.F. 1974. Ecological studies in the kerangas forests of Sarawak and Brunei. Borneo Literature Bureau, Kuching, Sarawak, 237 p.
Calder, I.R., M.H. Swaminath, G.S. Kariyappa, N.V. Srinivasalu, K.V. Srinivasa Murty and J. Mumtaz. 1992. Deuterium tracing for the estimation of transpiration from trees. Part 3. Measurements of transpiration from Eucalyptus plantation, India. J. Hydrol. 130:37--48.
Èermák, J., E. Cienciala, E. Kuæera, A. Lindroth and E. Bednárová. 1995. Individual variation of sap-flow rate in large pine and spruce trees and stand transpiration: a pilot study at the central NOPEX site. J. Hydrol. 168:17--27.
Clarke. M.R.B. 1980. The reduced major axis of a bivariate sample. Biometrika 67:441--446.
Connor, D.J. and D. Doley. 1981. The water relations of heathlands: physiological adaptations to drought. In Ecosystems of the World: Heathlands and Related Shrublands. Vol. 9B. Ed. R.L. Specht. Elsevier, Amsterdam, pp 131--141.
Davies, S.J. and P. Becker. 1995. Floristic composition and stand structure of mixed dipterocarp and heath forests in Brunei Darus-salam. J. Trop. For. Sci. In press.
Edwards, W.R.N. and N.W.M. Warwick. 1984. Transpiration from a kiwifruit vine as estimated by the heat pulse technique and the Penman-Monteith equation. N.Z. J. Agric. Res. 27:537--543. Hatton, T.J., E.A. Catchpole and R.A. Vertessy. 1990. Integration of
sap flow velocity to estimate plant water use. Tree Physiol. 6:201--209.
Hatton, T.J., S.J. Moore and P.H. Reece. 1995. Estimating stand transpiration in a Eucalyptus populnea woodland with the heat pulse method: measurement errors and sampling strategies. Tree Physiol. 15:219--227.
Jordan, C.F. and J.R. Kline. 1977. Transpiration of trees in a tropical rain forest. J. Appl. Ecol. 14:853--860.
Klinge, H. and E. Medina. 1979. Rio Negro caatingas and campinas, Amazonas states of Venezuela and Brazil. In Ecosystems of the World: Heathlands and Related Shrublands. Vol. 9A. Ed. R.L. Specht. Elsevier, Amsterdam, pp 483--488.
Kruger, F.J. 1979. South African heathlands. In Ecosystems of the World: Heathlands and Related Shrublands. Vol. 9A. Ed. R.L. Specht. Elsevier, Amsterdam, pp 19--80.
Loveless, A.R. 1962. Further evidence to support a nutritional inter-pretation of sclerophylly. Ann. Bot. 26:549--561.
Nepstad, D.C., P. Jipp, P. Moutinho, G. Negreiros and S. Vieira. 1995. Forest recovery following pasture abandonment in Amazonia: can-opy seasonality, fire resistance and ants. In Evaluating and Monitor-ing the Health of Large-Scale Ecosystems. Eds. D.J. Rapport, C.L. Gaudet and P. Calow. Springer-Verlag, Berlin, pp 333--349. Ng, F.S.P. 1986. Tropical sapwood trees. Nat. Monspel. Coll. Int. sur
l’Arbre, Montpellier, France, pp 61--67.
Roberts, J., O.M.R. Cabral and L.F. de Aguiar. 1990. Stomatal and boundary-layer conductances in an Amazonian terra firme rain forest. J. Appl. Ecol. 27:336--353.
Sokal, R.R. and J.J. Rohlf. 1981. Biometry. 2nd Edn. W.H. Freeman and Sons, San Francisco, 859 p.
Specht, R.L. 1979. The sclerophyllous (heath) vegetation of Australia: the eastern and central states. In Ecosystems of the World: Heath-lands and Related ShrubHeath-lands. Vol. 9A. Ed. R.L. Specht. Elsevier, Amsterdam, pp 125--210.
Steinberg, S., C.H.M. van Bavel and M.J. McFarland. 1989. A gauge to measure mass flow rate of sap in stems and trunks of woody plants. J. Am. Soc. Hortic. Sci. 114:466--472.
Swanson, R.H. and D.W.A. Whitfield. 1981. A numerical analysis of the heat pulse velocity theory and practice. J. Exp. Bot. 32:221--239. Whitmore, T.C. 1984. Tropical rain forests of the Far East. 2nd Edn.
Clarendon Press, Oxford, 352 p.