Supplementary Material for:
MMFF VII. Characterization of MMFF94, MMFF94s, and Other
Widely Available Force Fields for Conformational Energies and
for IntermolecularInteraction Energies and Geometries.
THOMAS A. HALGREN
Molecular Systems, Merck Research Laboratories, P.O. Box 2000, Rahway, NJ 07065
Appendix A: Experimental Conformational Energies for Set 1
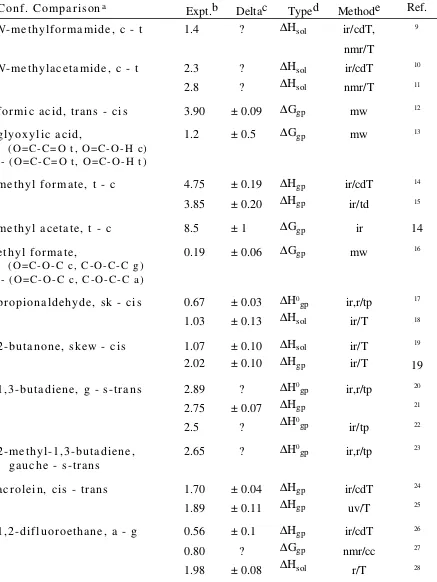
Table A.I lists some, but by no means all, of the experimental conformational energies that are available for the comparisons in Set 1. It also lists experimental uncertainties (a few of which we estimated from data in the original report), indicates the type of quantity measured, and specifies the method used. When two or more experimental values are listed, the first is used in the comparisons of conformational energies made in this paper. As will be noted, in a few instances we have chosen a different experimental value than the one we employed in our earlier work.1 We also wish to point out that our earlier paper cited previous theoretical papers
as the basis for the listed values, whereas we now give citations to the original literature. For
conformational Set 2, we adopted the experimental values cited by Gundertofte2 without further
examination.
many incorrect experimental results. This fact is established simply by noting the many
instances in which alternative experimental values for the same conformational difference differ by many multiples of the stated uncertainty in either. In such cases, both experimental results cannot be correct (except possibly where strong medium effects are involved).
Given that some of the listed experimental values are wrong, it is fair to ask how a choice can be made. One approach is to consider the reliability of the experimental technique. Our own, somewhat untutored, prejudice is for determinations based on spectroscopic intensities measured as a function of temperature, either directly (indicated by "/T" in the table) or on samples cryogenically deposited from different initial temperatures (indicated by "/cdT"). In such cases, a plot of the logarithm of relative intensity vs. 1/T gives directly. Even this technique, however, can give poor results, as the differences of more than 1 kcal/mol between alternative experimental values determined in this way for 1,2difluoroethane and for 2
butanone attest. We also favor determinations in which vibrational band progressions are used to construct a complete torsional potential along a onedimensional torsional coordinate. In these cases, differences between local minima then give E for that coordinate (though we call this quantity 0 in recognition of the fact that the subsumed coordinates include zeropoint and
thermal vibrational energy contributions), in close analogy to energy differences taken between local minima on a force field or quantum mechanical energy surface. Conversely,
determinations based on conformationally averaged nmr chemical shifts or coupling constants for which the isolatedconformer endpoint values could not be measured directly seem to us particularly prone to error.
The date of the measurement is also a factor, as we presume that more recent values are more likely to be accurate, in part because of improved experimental technique but also because any substantial variation from previously published values is likely to have been closely
Table III of the paper. Given their general success in predicting the observed conformational energies, we presume that these very high level quantum calculations are unlikely to be seriously in error in any individual case. To be sure, this choice minimizes the rms "error" reported for GVBLMP2 (cf. Table IV), and its use might seem to compromise our claim that this method is the most accurate. In point of fact, however, even selection of the
conformational energies from Table A.I in worst agreement with the GVBLMP2 results still finds that it best reproduces the experimental data. Moreover, we can think of no better approach for dealing with cases in which discordant experimental values appear to have equal claims to validity. We had used much the same approach previously,1 but with
"MP4SDQ(T)/TZP" calculations serving as the best reference values then available to us.
The reasons underlying most choices reflected in the table should be apparent from the foregoing. Thus, we shall comment here only on a few cases. One of these is 2butanone, where all the higherlevel calculations in Table III, as well as several others we had previously reported,1 clearly favor the lower, liquidphase result. A second case is 1,3butadiene, where
we had cited a gauche trans conformational energy difference of 2.5 kcal/mol, this being the average of values referenced by Wiberg et al.4 This value, as it happens, also corresponds to an
often cited2,3b,5 but suspect early determination in which Carreira constructed a onedimensional
torsional potential but used an erroneous torsional coordinate that incorrectly identified the second, higherenergy conformer as being cis rather than gauche.22 The higher, more recent
values20,21 shown in Table A.I seem to us preferable. They are also consistent with the pattern
In the case of 1butene, we had previously cited a conformational energy difference of 0.53 kcal/mol.1 We now realize, however, that this value is derived from the freeenergy difference
of 0.94 kcal/mol measured by Van Hemelrijk et al.65 by simply applying an entropic correction
of R ln2 = 1.18 e.u. to allow for the twofold statistical factor favoring skew. However, the looser skew conformation is also expected to have a higher vibrational entropy. With this mind, we have applied the full entropic correction of 2.3 e.u. favoring skew found by Durig and Compton64 to arrived at the value of 0.24 ± 0.42 kcal/mol listed in Table A.I. This correction to
the measured G brings the derived value for into line with Durig and Compton's value of 0.22 ± 0.02 kcal/mol and with the GVBLMP2 result for E.
The conformational energy difference for methyl vinyl ether is of particular interest. We ourselves had previously referenced the Sullivan, Dickson, and Durig value of 1.70 kcal/mol favoring cis over skew.49 Friesner and coworkers,3b however, cited the earlier Durig and
Compton difference of 1.15 kcal/mol,51 and worked intently to improve their theoretical
methodology to reduce the large discrepancy with their higher LMP2/ccpVTZ(f) theoretical estimate of 2.62 kcal/mol.6 They subsequently published a GVBLMP2 result of 1.45 kcal/mol
favoring skew.3b However, calculations using the current version of Jaguar now find the
conformational energy difference to be 2.14 kcal/mol (Table III, manuscript) when a rigorously consistent protocol for lonepair delocalization is employed in the localized MP2 calculation in connection with improved grid and dealiasing functions. Furthermore, we find that this value falls to 1.61 kcal/mol when zeropoint energy differences3a are taken into account. This last
estimate is fully consistent with the Sullivan, Dickson, and Durig result and with the enthalpy difference of 1.59 kcal/mol obtained Beech et al.,50 the experimental result that caused Durig to
reinvestigate this system and led him to raise his lower early estimate.
For the "simple" but conformationally critical gauche anti conformational difference in n butane, we list what now appears to be a definitive value of 0.67 ± 0.10 kcal/mol.55 Also shown
0.75 kcal/mol value we had previously cited1 on the basis of Allinger, Yuh, and Li's
recommendation.7 Much as in the case of methyl vinyl ether, both the new value and one of the
earlier values it has superseded are by Durig and coworkers. Unfortunately, Durig et al. do not discuss the reasons for rejecting their higher earlier value. However, they do cite a number of other experimental determinations, made using a variety of methods, that agree with their lower value of 0.67 kcal/mol.55 Other recent highlevel quantum calculations8 also support this value,
as does the GVBLMP2/ccpVTZ(f) value of 0.72 kcal/mol cited in Table III of the manuscript.
As an indication of the limitations of experimental data, we point out that the cis trans difference for methyl acetate is particularly tenuous: the listed G of 8.5 ± 1 kcal/mol represents the relative intensity of a single weak band in the infrared carbonyl region that was observed in a sample cryogenically deposited from a temperature of 879 K and was thought to probably arise from the cis conformer.14 Indeed, the original authors cite this conformational energy
difference as being a , though this interpretation apparently assumes no entropy difference between cis and trans conformers. We think it remarkable that the theoretical values in Table III of the manuscript agree with the experimental value
as well as they do, but caution that a even a disagreement of 1 – 2 kcal/mol should not be viewed as indicative of a problem with the theoretical calculation.
Finally, we discuss two entries for which we had previously based our comparisons on free energy differences measured in solution. First, we now list a single value of G = 1.15
kcal/mol for the axial equatorial difference in cyclohexyl amine rather than the previously cited range of 1.1 1.8 kcal/mol.1 The reason for this change is that the larger values in the
enthalpy difference of 0.58 kcal/mol found by Eliel and Gilbert in dilute nonpolar medium for the model 4tbutylcyclohexanol system;46 these authors criticized the consensus value of 0.52
kcal/mol that Hirsch recommended for nonpolar solvents47 as being too low because it
incorporates low values for early determinations that they believed to be unreliable.
Most other minor differences between the present data and that cited previously1 either reflect
TABLE A.I. ___________________________________________________
References for Experimental Conformational Energies (Set 1), in kcal/mol.
Conf. Comparisona Expt.b Deltac Typed Methode Ref.
Nmethylformamide, c t 1.4 ? sol ir/cdT,
nmr/T
9
Nmethylacetamide, c t 2.3 2.8
? ?
sol sol
ir/cdT nmr/T
10
11
formic acid, trans cis 3.90 ± 0.09 Ggp mw 12
glyoxylic acid,
(O=CC=O t, O=COH c) (O=CC=O t, O=COH t)
1.2 ± 0.5 Ggp mw 13
methyl formate, t c 4.75 3.85
± 0.19 ± 0.20
gp
gp
ir/cdT ir/td
14
15
methyl acetate, t c 8.5 ± 1 Ggp ir 14
ethyl formate,
(O=COC c, COCC g) (O=COC c, COCC a)
0.19 ± 0.06 Ggp mw 16
propionaldehyde, sk cis 0.67 1.03
± 0.03 ± 0.13
0
gp sol
ir,r/tp ir/T
17
18
2butanone, skew cis 1.07 2.02
± 0.10 ± 0.10
sol gp
ir/T ir/T
19
19 1,3butadiene, g strans 2.89
2.75 2.5
? ± 0.07
?
ir,r/tp
ir/tp
20
21
22
2methyl1,3butadiene,
gauche strans 2.65 ?
0
gp ir,r/tp 23
acrolein, cis trans 1.70 1.89
± 0.04 ± 0.11
gp
gp
ir/cdT uv/T
24
25
1,2difluoroethane, a g 0.56 0.80 1.98
± 0.1 ? ± 0.08
gp
Ggp sol
ir/cdT nmr/cc
r/T
26
27
1,2dichloroethane, g a 1.08 1.09
± 0.10 ± 0.10
gp
gp ed/Tir
29
30
1fluoropropane, a g 0.35 0.47
± 0.03 ± 0.31
0
gp
gp mw/Tir,r/tp
31
32
1chloropropane, g a 0.09 0.37 0.04
± 0.02 ± 0.03 ± 0.07
gp
0
gp
gp
ir/T ir,r/tp
mw
33
31
34
2methoxytetrahydropyran, (OCOMe g, OMe eq) (OCOMe g, OMe ax)
1.05 ? sol nmr/T 35
2,5dimethyl1,3dioxane,
(2 eq, 5 ax) (2 eq, 5 eq) 0.92 ± 0.01
sol mCal 36
isopropylamine,
lpNCH gauche anti
0.45 0.12
? ± 0.02
gp
sol
ir,r/tp ir/T
37
38
cyclohexylamine, ax eq 1.15 ? Gsol nmr 39
piperidine, ax eq 0.53 ± 0.13 gp ir/T 40
Nmethylpiperidine, ax eq 3.15 ± 0.1 Ggp nmr 41
ethanol, gauche anti 0.12 0.3, 0.5
0.7
± 0.01 ? ir/T
42
43
44
isopropanol, HCOH a g 0.28 ? Ggp mw 45
cyclohexanol, ax C1 eq C1 0.58
0.52
± 0.02 ?
sol Gsol
nmr/T nmr
46
47
methyl ethyl ether, g a 1.5 ± 0.2 gp ir/T 48
methyl vinyl ether,
C=COC skew cis 1.701.59
1.15
± 0.09 ± 0.08 ± 0.05
gp
gp
0 gp
r/T ir/cdT
ir,r/tp
49
50
51
diethyl ether,
(CCOC a, COCC g) (CCOC a, COCC a)
1.14 ± 0.05 sol ir/T 52
ax C1 eq C1 0.4 ± 0.05 Gsol nmr/cs 54
butane, gauche anti 0.67 0.97 1.09 0.75
± 0.10 ± 0.05 ± 0.05 ± 0.25
gp gp 0
gp Ggp
ir/T r/T ir,r/tp
ed
55
56
57
58
cyclohexane,
twist boat chair 5.5 ?
sol,lT nmr/T 59
methylcyclohexane, ax eq 1.75 ± 0.05 sol nmr/T 60
2,3dimethylbutane, HC2C3H g a
0.05 0.17
± 0.03 ?
cyclooctane,
D4d Cs boat chair
1.9 ± 0.2 sol,lT nmr/T 62
cyclononane,
[255] C2 [333] D3
1.0 ? sol,lT nmr 63
1butene, cis skew 0.22 0.07 0.24
± 0.02 ? ± 0.42
sol
gp
gp
r/T ir,r/tp ed/mw
64
64
65
2butene, cis trans 1.2 1.0
± 0.1 ?
gp
gp
mCal comb.
66
67
a In the conformational notation, idealized dihedral angles are: cis or c, 0°; trans, t, anti, or a,
180°; gauche or g, 60°; and skew or sk, 120°.
b When more than one value for the conformational energy is cited, the first listed value is used
in the comparisons in the body of this paper
c Error in measurement as cited by the authors or as explained in a note accompanying the
literature citation.
d gp = gas phase; sol = solution or liquidphase; superscript "0" in 0 denotes a difference
e "r", "ir", "mw", "uv", nmr, and "ed" denote raman, infrared, microwave, ultraviolet, nuclear
1. T. A. Halgren and R. B. Nachbar, J. Comput. Chem., 17, 587615 (1996).
2. K. Gundertofte, T. Liljefors, P.O. Norrby, and I. Petterssen, J. Comput Chem., 17, 429449
(1996).
3. (a) R. A. Friesner, R. B. Murphy, M. D. Beachy, M. N. Ringnalda, W. T. Pollard, B. D. Duneitz,
and Y. Cao, J. Chem. Phys., submitted (1998); (b) R. B. Murphy, W. T. Pollard, and R. A. Friesner, J. Chem. Phys., 106, 50735084 (1997).
4. K. B. Wiberg, P. R. Rablen, and M. Marquez, J. Am. Chem. Soc., 114, 86548668 (1992).
5. (a) N. L. Allinger, F. Li, L. Yan, and J. C. Tai, J. Comput. Chem., 11, 868895 (1990); (b) C. J.
Casewit, K. S. Colwell, and A. K. Rappé, J. Am. Chem. Soc., 114, 10035100046 (1992).
6. R. B. Murphy, M. D. Beachy, R. A. Friesner, and M. N. Ringnalda, J. Chem. Phys., 103, 1481
1490 (1995).
7. N. L. Allinger, Y. H. Yuh, and J.H. Lii, J. Am Chem. Soc., 111, 85518566 (1989). See also N.
L. Allinger and L. Yan, J. Am. Chem. Soc., 115, 1191811925 (1993), and references therein.
8. G. D. Smith and R. L. Jaffe. J. Phys. Chem., 100, 1871818724 (1996).
9. Average of values in: S. Ataka, H. Takeuchi, and M. Tasumi, J. Mol. Struct., 113, 147160
(1984), and F. A. L. Anet and M. Squillacote, J. Am. Chem. Soc., 97, 32433244 (1974).
10. S. Ataka, H. Takeuchi, and M. Tasumi, J. Mol. Struct., 113, 147160 (1984).
11. T. Drakenberg and S. Forsén, Chem. Commun., 14041405 (1971). This result is from a
difference in enthalpies of activation for isomerization in C2H4Cl2 as determined by nmr lineshape
analysis.
12. W. H. Hocking, Naturforsch., 31a, 11131121 (1976).
13. B. P. van Eijck and F. B. van Duijneveldt, J. Mol. Struct., 39, 157163 (1977).
14. C. E. Blom and Hs. H. Günthard, Chem. Phys. Lett., 84, 267271 (1981).
15. S. Ruschin and S. H. Bauer, J. Phys. Chem., 84, 30613064 (1980).
16. J. M. Riveros and E. B. Wilson Jr., J. Chem. Phys., 46, 46054612 (1967). This quantity is
difference, presumably corrected for the twofold statistical factor favoring the COCC gauche conformer; no later report on this measurement appears to have been made.
17. J. R. Durig, D. A. C. Compton, and A. Q. McArver, J. Chem. Phys., 73, 719724 (1980).
18. G. Sbrana and V. Schettino, J. Molec. Spectrosc., 33, 100108 (1970). This value contributes to
the composite value of 0.95 kcal/mol cited in ref. 1. For other references, see: P. van Nuffel, L. van den Enden, C. van Alsenoy, and H. J. Geise, J. Mol. Struct., 116, 99118 (1984).
19. T. Shimanouchi, Y. Abe, and M. Makami, Spectrochim. Acta A, 24A, 10371053 (1968).
20. Y. N. Panchenko, A. V. Abramenkov and C. W. Bock, J. Mol. Struct., 140, 8792 (1985).
21. J. R. Durig, W. E. Bucy, and A. R. H. Cole, Can. J. Phys., 53, 18321837 (1975).
22. L. Carreira, J. Chem. Phys., 62, 38513854 (1975).
23. Y. N. Panchenko, V. I. Pupyshev, A. V. Abramenkov, M. Traetteberg, and S. J. Cyvin, J. Mol.
Struct., 130, 355359 (1985).
24. C. E. Blom and A. Bauder, Chem. Phys. Lett., 88, 5558 (1982). Note that this value supersedes
the earlier result of 1.6 kcal/mol obtained by C. E. Blom, R. P. Müller and Hs. H. Günthard, Chem. Phys. Lett., 73, 483486 (1980).
25. E. J. Bair, W. Goetz, and D. A. Ramsay, Can. J. Phys., 49, 27102717 (1971). A note added in
proof to this paper reports a correction, agreed to by the original authors, to the value of 2.00 ± 0.11 kcal/mol published by: A. C. P. Alves, J. Christoffersen, and J. M. Hollas, Mol. Phys., 20, 625644 (1971); 21, 384 (1971).
26. P. HuberWälchi and Hs. H. Günthard, Chem. Phys. Lett., 30, 347351. This result and the cited
uncertainty were obtained from the relative intensity vs. 1/T plots in Fig. 3. The authors appear to incorrectly label their determinations as G.
27. K. T. Hirano, S. Nonoyama, T. Miyajima, Y. Kurita, T. Kawamura, and H. Sato, J. Chem. Soc.,
Chem. Commun., 1986, 606607.
28. W. C. Harris, J. R. Holtzclaw, and V. F. Kalasinsky, J. Chem. Phys., 67, 33303338 (1977).
30. K. Tanabe, Spectrochim. Acta, 28A, 407424 (1972). An entropy difference calculated from
symmetry numbers, moments of inertia, and vibrational frequencies was used to correct the measured freeenergy difference.
31. J. R. Durig, S. E. Godbey, and J. F. Sullivan, J. Chem. Phys., 80, 59835993 (1984).
32. E. Hirota, J. Chem. Phys., 37, 283291 (1962).
33. W. A. Herrebout and B. J. van der Veken, J. Phys. Chem., 100, 96719677 (1996). I thank Dr.
Michael Beachy (Schrodinger) for supplying this reference.
34. K. Yamanouchi, M. Sugie, H. Takeo, C. Matsumura, and K. Kuchitsu, J. Phys. Chem., 88, 2315
2323 (1984). An entropy difference calculated from moments of inertia and vibrational frequencies was used to correct the measured freeenergy difference of 0.12 kcal/mol.
35. A. J. de Hoog, H. R. Buys, C. Altona, and E. Havinga, Tetrahedron, 25, 33653375 (1969).
Position of the equilibrium as a function of temperature was determined from conformationally averaged nmr coupling constants.
36. R. M. Clay, G. M. Kelle, and F. G. Riddell, J. Am. Chem. Soc., 95, 4632 (1973).
37. J. R. Durig, G. A. Guirgis, and D. A. C. Compton, J. Phys. Chem., 83, 13131323 (1979).
38. P. J. Krueger and J. Jan, Can. J. Chem., 48, 32293235 (1970).
39. Average of values for nonpolar solvents cited in H. Booth and M. L. Jozefowicz, J. Chem. Soc.,
Perkins Trans. II, 895901 (1976).
40. R. W. Baldock and A. R. Katritzky, J. Chem. Soc. B, 14701477 (1968); see also R. A. Y. Jones,
A. R. Katritzky, A. C. Richards, R. J. Wyatt, R. J. Bishop, and L. E. Sutton, J. Chem. Soc. B, 127 131 (1970).
41. P. J. Crowley, M. J. T. Robinson, and M. G. Ward, Tetrahedron, 33, 915925 (1977).
Kineticallycontrolled protonation was used to trap conformers in quaternary salt form for nmr analysis.
42. R. K. Kakar, and C. R. Quade, J. Chem. Phys., 72, 43004307 (1980).
43. J. R. Durig, W. E. Bucy, C. J. Wurrey, and L. A. Carriera, J. Phys. Chem., 79, 988993 (1975).
44. H. L. Fang and R. L. Swofford, Chem. Phys. Lett., 105, 511 (1984). Signal detection was by
photoacoustic spectroscopy.
45. E. Hirota, as cited in W. A. Lathan, L. Radom, W. J. Hehre, and J. A. Pople, J. Am. Chem. Soc.,
95, 699703 (1973). The reference to relative microwave intensities with no reference to
temperature dependence suggests that this measurement is G, presumably corrected for the two fold statistical factor favoring the gauche conformer. For the preliminary study, see: S. Kondo and E. Hirota, J. Mol. Spectrosc., 34, 97107 1970). No followup study seems to have appeared.
46. E. L. Eliel and E. C. Gilbert, J. Am. Chem. Soc., 91, 54875495 (1969). The cited value was
measured for 4tbutylcyclohexanol epimers equilibrated via Raney nickel catalysis.
47. J. A. Hirsch, in N. L. Allinger and E. L. Eliel, Eds., Topics in Stereochemistry, 1, 199222
(1967). This oftencited value (cf. refs. 1, 2, 3b, and 5) is the freeenergy difference Hirsch recommends for nonpolar solvents, but has been criticized by Eliel and Gilbert46 as being too low
because it averages in early determinations they believed to be unreliable.
48. T. Kitagawa and T. Miyazawa, Bull. Chem. Soc., Jpn., 41, 1976 (1968).
49. J. F. Sullivan, T. J. Dickson, and J. R. Durig, Spectrochim. Acta, 42A, 113122 (1986).
50. T. Beech, R. Gunde, P. Felder, and Hs. Günthard, Spectrochim. Acta., 41A, 319339 (1985).
51. J. R. Durig and D. A. C. Compton, J. Chem. Phys., 69, 20282935 (1978). Note that this value is
incorrect and has been superseded by the Sullivan, Dickson and Durig result.49
52. H. Weiser, W. G. Laidlaw, P. J. Kruger, and H. Fuhrer, Spectrochim. Acta, 24A, 10551089
(1968). The listed uncertainty of ± 0.05 reflects a purely subjective assessment on our part of the data in Fig. 13 of this reference, and if anything is likely to be an overestimate.
53. F. R. Jensen, C. H. Bushweller, and B. H. Beck, J. Am. Chem. Soc., 91, 344351 (1969).
54. E. L. Eliel and E. C. Gilbert, J. Am. Chem. Soc., 91, 54875495 (1969). This value was
measured for 4tbutylmethoxycyclohexane using conformationally averaged nmr chemical shifts.
55. W. A. Herrebout, B. J. van der Veken, A. Wang, and J. R. Durig, J. Phys. Chem., 99, 578585
(1995). I thank Prof. Alex MacKerell (Univ. Maryland) for supplying this reference.
56. A. L. Verma, W. F. Murphy, and H. J. Bernstein, J. Chem. Phys., 60, 15401544 (1974).
58. R. K. Heenan and L. S. Bartell, J. Chem. Phys., 78, 12701274 (1983); W. F. Bradford, S.
Fitzwater, and L. S. Bartell, J. Molec. Struct., 38, 185194 (1977). These papers are cited by
Allinger et al.7 as the basis for the value and the uncertainty listed in this table.
59. M. Squillacote, R. S. Sheridan, O. L. Chapman, and F. A. L. Anet, J. Am. Chem. Soc., 97, 3244
3246 (1975); this result uses data from: F. A. L. Anet and A. J. Bourn, J. Am. Chem. Soc., 89, 760
768 (1967).
60. H. Booth and J. R. Everett, J. Chem. Soc., Perkin II, 255259 (1980).
61. T. L. Boates, thesis, Iowa State University, 1966, as cited by: E. J. Jacob, H. B. Thompson, and
L. S. Bartell, J. Chem. Phys., 47, 37363753. This value is reported as a G, but has been corrected
for the twofold statistical factor in favor of the gauche conformer.
62. F. A. L. Anet and V. J. Basus, J. Am. Chem. Soc., 95, 44244426 (1973).
63. F. A. L. Anet and J. Krane, Isr. J. Chem., 20, 7283 (1980). This result was measured by nmr
lineshape analysis at 145° and converted from G = 0.5 kcal/mol by using a forcefieldcalculated
S of 3.5 e.u. Use of the MP2/631G* estimate of 4.33 e.u. for S (cf. ref. 1) would raise H by an
additional 0.1 kcal/mol.
64. J. R. Durig and D. A. C. Compton, J. Phys. Chem., 84, 773781 (1980). We estimated the listed
uncertainty of ± 0.02 kcal/mol from handdrawn slopes for the five highest vs. four lowest temperature points in Fig. 3 of this reference.
65. D. Van Hemelrijk, L. Van den Enden, H. J. Greise, H. L. Sellers, and L. Schäfer, J. Am. Chem.
Soc., 102, 21892195 (1980). The listed H differs from the reported H of 0.53 kcal/mol because
it uses Durig and Compton's measured S of 2.3 e.u. favoring skew (cf. ref. 64) to make the full entropic correction (not just the symmetrynumber correction of R ln2 = 1.18 e.u.) to the measured freeenergy difference of 0.94 kcal/mol.
66. D. M. Golden, K. W. Egger, and S. W. Benson, J. Am. Chem. Soc., 86, 54165420 (1964).
67. Heat of combustion value cited in, but not correctly referenced by: N. L. Allinger, F. Li, and L.
Yan, J. Comput. Chem., 11, 848867 (1990). The value listed here is from heats of formation given
Ibrahim, Z. A. Fataftah, P. von R. Schleyer, and P. D. Stout, J. Comput. Chem., 8, 11311138