ESS
—
Extension of Social Security
Income Inequalities in Perspective
Jomo Kwame Sundaram
Vladimir Popov
Copyright © International Labour Organization 2015 First published 2015
Publications of the International Labour Office enjoy copyright under Protocol 2 of the Universal Copyright Convention. Nevertheless, short excerpts from them may be reproduced without authorization, on condition that the source is indicated. For rights of reproduction or translation, application should be made to ILO Publications (Rights and Permissions), International Labour Office, CH-1211 Geneva 22, Switzerland, or by email:
[email protected]. The International Labour Office welcomes such applications.
Libraries, institutions and other users registered with reproduction rights organizations may make copies in accordance with the licences issued to them for this purpose. Visit www.ifrro.org to find the reproduction rights organization in your country.
ILO Cataloguing in Publication Data
Kwame Sundaram, Jomo; Popov, Vladimir
Income inequalities in perspective / Jomo Kwame Sundaram and Vladimir Popov ; International Labour Office, Social Protection Department.; Initiative for Policy Dialogue - Geneva: ILO, 2015
(Extension of Social Security series ; No 46)
International Labour Office Social Protection Dept.
income distribution / wage differential / social stratification / trend
03.03.1
The designations employed in ILO publications, which are in conformity with United Nations practice, and the presentation of material therein do not imply the expression of any opinion whatsoever on the part of the International Labour Office concerning the legal status of any country, area or territory or of its authorities, or concerning the delimitation of its frontiers.
The responsibility for opinions expressed in signed articles, studies and other contributions rests solely with their authors, and publication does not constitute an endorsement by the International Labour Office of the opinions expressed in them.
Reference to names of firms and commercial products and processes does not imply their endorsement by the International Labour Office, and any failure to mention a particular firm, commercial product or process is not a sign of disapproval.
ILO publications and electronic products can be obtained through major booksellers or ILO local offices in many countries, or direct from ILO Publications, International Labour Office, CH-1211 Geneva 22, Switzerland. Catalogues or lists of new publications are available free of charge from the above address, or by email: [email protected]
Visit our web site: www.ilo.org/publns
The editor of the series is the Director of the Social Protection Department, ILO. For more information on the series, or to submit a paper, please contact:
Abstract
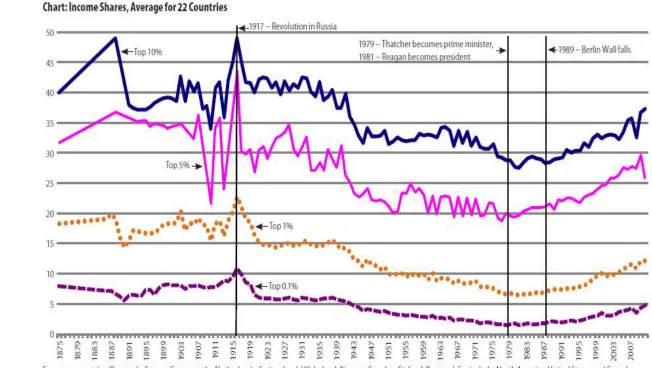
Income and wealth inequalities in most countries – in the West, the former ‘communist’ economies and in the developing world – have been on the rise in the last three decades with some notable exceptions. Inequalities in the 19th century (Figure 1) were much higher than before the Industrial Revolution. Following the rise of workers’ movements in the West and the 1917 Bolshevik revolution, the growth of inequalities of the previous century was reversed for over half a century until the 1980s as the threat of the spread of communism inspired welfarist redistributive reforms, giving capitalism a more human face. Such checks and balances have been greatly weakened in recent decades, even though improved economic performance in many developing countries, including sub-Saharan Africa in the last decade, contributed to some convergence of incomes between rich and poor countries.
JEL Classification: F02, F63, I30, J31, N00
Keywords: Income and wealth inequalities, communism, capitalism, welfare state,
Contents
Acknowledgements ... vii
1. Growing inequalities within countries ... 1
2. Capital versus labour... 6
Acknowledgements
This paper is a shorter version of “Whither Income Inequalities?”, MPRA Paper No. 52154, December 2013 (http://mpra.ub.uni-muenchen.de/52154/). The authors appreciate the comments received from Ron Findlay, Branko Milanovic, Victor Polterovich and Beverly Silver on that earlier version, but implicate none of them in this version.
1.
Growing inequalities within countries
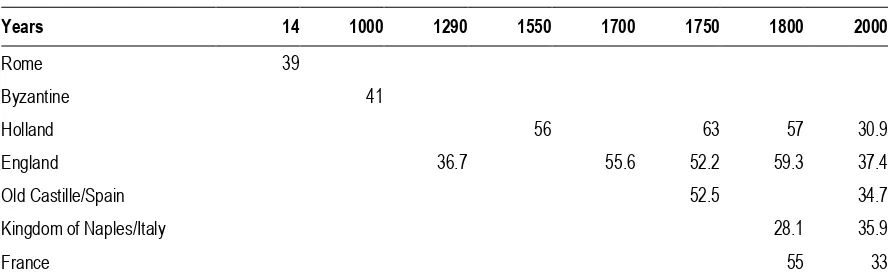
The long term trends suggest increasing inequality from the ancient times before reaching an all-time peak in the early 20th century (Table 1, Figure 1), and then starting to decline after the First World War and the 1917 Russian revolution.
Table 1. Gini coefficients around particular CE years in some Western countries (%)
Years 14 1000 1290 1550 1700 1750 1800 2000
Source: Milanovic, Branko, Peter H. Lindert, Jeffrey G. Williamson. Measuring Ancient Inequality, World Bank Policy Research working paper no. WPS 4412. (Published as: Pre-Industrial Inequality. The Economic Journal, 121, March 2010: 255–272); data for 2000 are sometimes from the World Development Indicators database.
2
In
co
m
e
in
e
q
u
a
litie
s in
p
e
rsp
e
ctiv
e
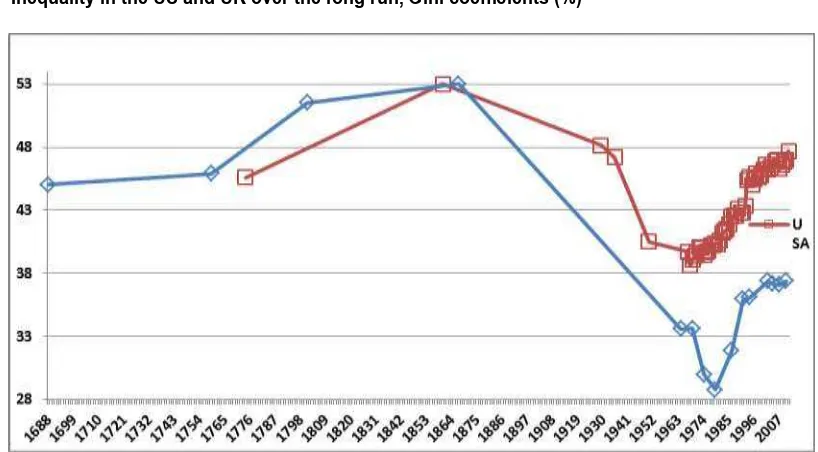
Figure 2. Inequality in the US and UK over the long run, Gini coefficients (%)
Source: The Gini coefficients were computed by Milanovic from social tables before the 20th century and from household survey
and tax returns afterwards (Milanovic, Branko. The Haves and Have-Nots. A Brief and Idiosyncratic History of Global Inequality. Basic Books, New York, 2011; Milanovic, Branko, Peter H. Lindert, Jeffrey G. Williamson. Measuring Ancient Inequality, World Bank Policy Research working paper no. WPS 4412. (Published as: Pre-Industrial Inequality. The Economic Journal, 121 (March 2010): 255–272; and personal correspondence with Milanovic). N.B. Comparable data for the 1867-1929 period are not available.
In the United States in the late 18th century, income and wealth inequalities were initially probably lower than in Europe due to the absence of large accumulated fortunes in the New World and the availability of abundant “free land”. In the late 18th
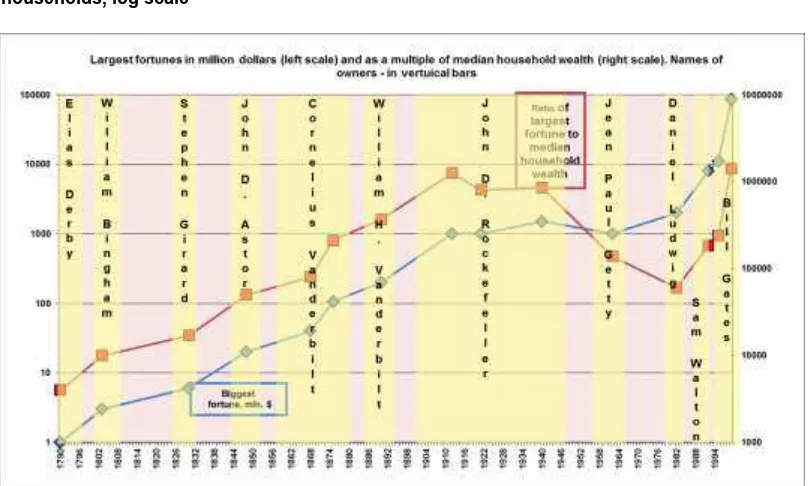
century, the top 10 percent of wealth holders accounted for only 45 percent of total wealth in the US, compared to 64 percent in Scotland and 46-80 percent in Finland, Norway, Sweden and Denmark (Soltow, 1989). But it appears that inequalities increased greatly in the 19th century and in the early 20th century, reaching a peak between the two world wars. Soltow (1989) finds some decrease in income inequality in 1798-1850/60 period in the US, and little or no increase in wealth inequality over the same period. However, the ratio of the largest fortunes to the median wealth of households (Figure 3; Phillips, 2002) suggests a different story. This ratio increased from 1000 in 1790 (Elias Derby’s wealth was estimated to be worth $1 million) to 1,250,000 in 1912 (John D. Rockefeller’s fortune of $1 billion), falling to 60,000 in 1982 (Daniel Ludwig’s fortune of “only” $2 billion), before increasing again to 1,416,000 in 1999 (Bill Gates’ $85 billion fortune)!
4 Income inequalities in perspective
inequalities (with Ginis between 25 and 30 percent on average) and the checks to rising inequalities with the growth of labour and other egalitarian movements (Figure 3) noted by Polanyi among others.
Figure 3. Largest fortunes in the US in million dollars and as a multiple of the median wealth of households, log scale
Source: Phillips, Kevin. Wealth and Democracy: A Political History of the American Rich. Broadway Books, New York, 2002.
The recent period has seen greater income inequality in most, though not all societies. In recent decades, there has also been a general decline in social provisioning in many societies. This is not only true of many so-called welfare states, but also of postcolonial societies featuring some tax-financed social provisioning. Such social provisioning has declined in China, Russia and many other ‘economies in transition’. As a consequence, the welfare of individuals and families depends much more on what they can afford based on their wealth and incomes. The era of economic liberalization has witnessed not only increasing income inequality at the national level (Figure 1), but also growing concentration of income and wealth at the world level (Figure 5).
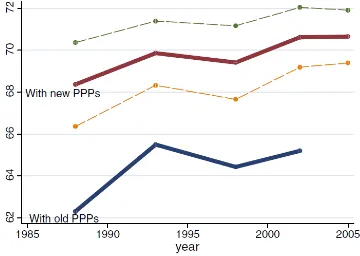
Figure 4. Incomes of the richest as a multiple of average national income
Source: Milanovic, B. The Haves and Have-Nots: A Brief and Idiosyncratic History of Global Inequality. Basic Books, NY, 2011.
The recent rise in inequality has paralleled an increasing rate of profit. During the post-war Golden Age, typically, when profits were high, capital’s success was shared with other social groups. In the 1950s and 1960s, for instance, wages, salaries and social security benefits grew together with rising profit margins. But since the early 1980s, profit margins have increased hand in hand with rising inequalities.
6 Income inequalities in perspective
It is not clear where the trend in income inequalities will lead. Simon Kuznets (1955) hypothesized that there is an inverted U-shaped relationship between economic growth and inequality, with inequality increasing at the industrialization stage, when the urban-rural income gap rises, and declining later with the rise of trend due to the increased wealth (capital) to output ratio (K/Y) under “patrimonial capitalism”, leading to the rising share of capital in national income. He believes this trend will continue into the future and was only temporarily interrupted in the 20th century due to the destruction of capital during the two world wars and for other reasons. In this logic, it is not clear why the sustained increase in capital (versus labour) has not induced a decline in the rate of profit offsetting the effect of the growth of capital (Milanovic, 2014).
An alternative view, consistent with the trends noted above, is that the reversal of growing inequality followed the 1917 Bolshevik revolution in Russia1
, the emergence of the USSR and other socialist countries, the strengthening of socialist and populist movements, the growth of the welfare state and other changes associated with Karl Polanyi’s Great Transformation. Education and health care access not determined by personal and family means and the strength of robust and egalitarian alternatives have constrained and checked economic inequalities, especially as long as socialism was relatively dynamic and seemed to be catching up with the West. As such socialism lost its dynamism from the 1960s and posed less of a threat, income inequalities started to grow again.
2.
Capital versus labour
If income earning producers are mainly wage earners, income distribution will be influenced by the nature of wage determination and wage contracts. Where unemployment is high and incomes low, workers are usually more willing to accept wages close to subsistence. But where labour is better organized for collective bargaining and working conditions are regulated, wages are more likely to rise with productivity increases. For instance, for several decades, living standards in China did not rise as fast as productivity, but in recent years, living standards have risen faster as employers experienced labour shortages and expected greater skills and productivity from their workers. And with greater social protection and provisioning (public health, education, housing), the ‘social wage’ may increase much more than suggested by the money or real wages workers receive. But in many countries, the “social wage” has not risen faster than profits since the 1980s.
To put the issue in historical perspective, the 2008-2009 crisis does not yet seem to be a turning point in the long run, comparable to the Great Depression of the 1930s (Eichengreenand O’Rourke, 2009). The 2008-2009 crisis was not unique
1 Turchin (2013) associated the decline in inequality after 1917 with the rise of the workers’
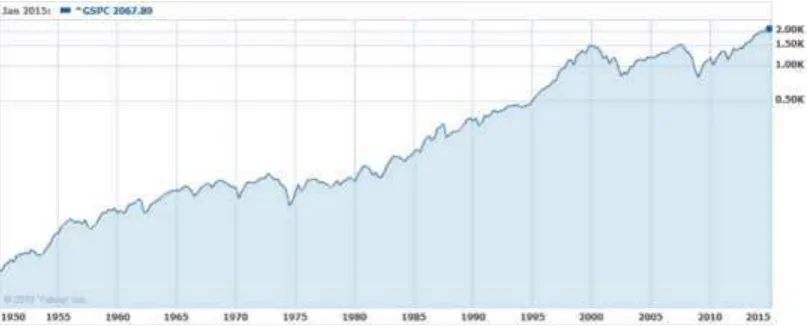
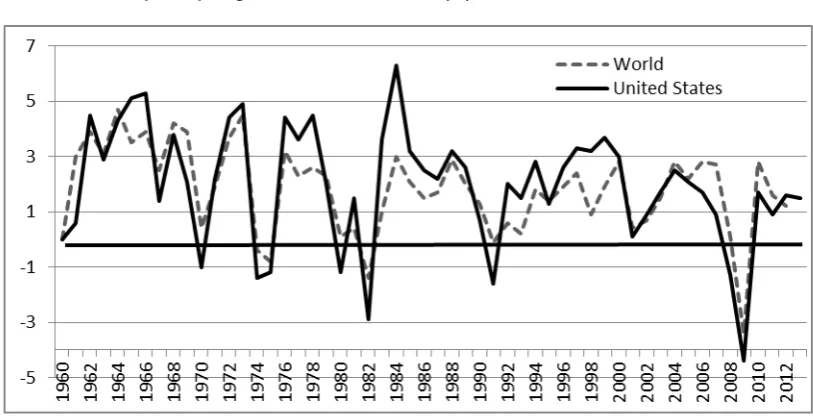
in terms of recent collapses of stock indices; between October 1972 and July 1974, and again between January 2000 and July 2002, the S&P index fell by almost half – as happened between October 2007 and March 2009 (Figure 6). The collapse of world output (by 3.4 per cent in 2009) was the largest decline in 60 years – much greater than the 1.4 per cent reduction in 1982, the 0.4 per cent reduction in 1974, and the 0.8 per cent reduction in 1975 (Figure 7). US profit margins and the rate of profit reached their lowest post-war levels in 1974, 1980 and 2002 (Figure 8). The US unemployment rate reached its post-war peak of 9.7 per cent in 1982, just ahead of the 9.6 per cent in 2009 (Figure 9). Meanwhile, real wages in the US are well below their early 1970s’ level, while profits remain high2
. Figure 6. US Standard & Poor stock price index since 1950, log scale
Source: Yahoo finance.
8 Income inequalities in perspective
Figure 7. World, US GDP per capita growth rates, 1960-2013 (%)
Source: World Development Indicators database, World Bank.
Figure 8. US domestic non-financial corporations’ profit margins (share of profits in sales), 1960-2012 (%)
Source: Bureau of Economic Affairs.
Figure 9. US unemployment rate long term trends (%)
Source: 1890-1930 data from: Christina Romer (1986). Spurious Volatility in Historical Unemployment Data. The Journal of Political Economy, 94 (1): 1–37. 1930–1940 data from: Robert M. Coen (1973). Labor Force and Unemployment in the 1920s and 1930s: A Re-Examination Based on Postwar Experience. The Review of Economics and Statistics, 55(1): 46–55; 1940–2011 data from the US Bureau of Labor Statistics (http://en.wikipedia.org/wiki/File:US_Unemployment_1890-2009.gif).
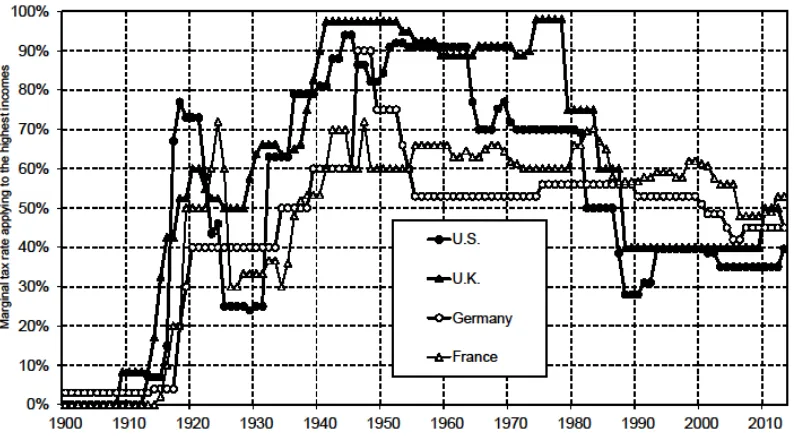
Figure 10. Top income tax rates in the US, UK, Germany and France, 1900-2010 (%)
References
Atkinson, A. B.; Søgaard, J. E. 2013. The long-run history of income inequality in Denmark: Top incomes from 1870 to 2010, EPRU Working Paper Series 2013-01 (Economic Policy Research Unit, Department of Economics, University of Copenhagen).
Milanovic, B. 2011. The Haves and Have-Nots: A Brief and Idiosyncratic History of Global Inequality (Basic Books, New York).
Milanovic, B. 2012. Global Income Inequality by the Numbers: In History and Now. An Overview, Policy Research Working Paper (World Bank).
Milanovic, B. 2014. “The return of “patrimonial capitalism”: Review of Thomas Piketty's Capital in the 21st century”, in Journal of Economic Literature, June.
Milanovic, B.; Lindert, P. H.; Williamson, J. G. 2007. Measuring Ancient Inequality, World Bank Policy Research Working Paper No. WPS 4412, published as: Pre-Industrial Inequality, in The Economic Journal, 121, March 2010, pp. 255–272.
Phillips, K. 2002. Wealth and Democracy: A Political History of the American Rich (Broadway Books, New York).
Piketty, T. 2014. Capital in the XXI Century (Harvard University Press, Cambridge, MA).
Polanyi, K. (2001). The Great Transformation: The Political and Economic
12 Income inequalities in perspective
Turchin, P. 2013. “Return of the oppressed”, in Aeon Magazine, 07 February.