C-8
CHARACTERIZATION OF QUINOLINE AND QUINOLINE CONJUGATED METAL AS THE BASE MATERIAL OFPHOTODETECTOR
I Gusti Made Sanjaya, Dian Novita and Aldo Swaztyznt Saputra
Department of Chemistry, Universitas Negeri Surabaya (the State University of Surabaya) Email: [email protected]
Abstract
Research has been conducted with the aim to characterize quinoline and quinolineconjugated metal as the base material of photo-detector. The characterization was conducted on the bandgap and infrared, visible, and ultraviolet spectra. This is done through computational chemistry method with NWCHEM 6.3 software. The computation is done by using density functional theory with basis set 6.31G*. The result showed that there was a diminution in the bandgap of quinolone conjugated metal of Mg(Eg ~ 0.16),
Ca (Eg ~ 1.25), Cr(Eg ~ 3.51), Fe (Eg ~ 0.37), Ni (Eg ~ 1.18) and Zn (Eg ~ 3.58) than the
bandgap of quinoline (Eg ~ 4.58 eV). Photosensitivity of the quinolin conjugated
metalseem to shift towards the maximum wavelength in the visible and infrared, ie Mg-quinoline ( = 470.57 nm); Ca-quinoline ( = 719.98 nm); Cr-quinoline ( = 855.76 nm); Fe-quinoline ( = 1764.39 nm); Ni-quinoline ( = 1325.20 nm); dan Zn-quinoline ( = 485.04 nm), compare quinolone photosensitivity that occurs in the ultraviolet region ( = 214.39 nm).
Keyword: Quinoline, conjugated metal, photo-detector, characterization.
1. Introduction
Optical sensors is very important in industrial automation systems. Such sensors work based on light sensitivity (Candra, 2006).Optical sensors are generally made by using semiconductor properties of inorganic materials, such as silicon and germanium (Setiawan et al, 2007).The characters of inorganic sensors are rigid, inflexible, limited amount of the deposit, and not easily recycled so it is not environmentally friendly.
Materials of organic compounds have not widely used as a semiconductors which become the raw materials of optical sensors. Though many organic compounds contain group that are active light. Organic semiconductors have such a chromophore groups is very prospective used as raw material of optical sensors.
organic semiconductors that have conjugated double bonds (Brütting, 2005). Organic semiconductors with small band gap have large absorption to the electromagnetic wave.
Organic materials in general have a large band gap. The material is not quite ideal as semiconductors. To improve the properties, organic compounds in the sensor material need to be conjugated with metals. Good use is a metal that has empty d orbitals that electronic transitions can occur more easily (Pamungkas dan Sanjaya, 2013).
The research is focused on studying the semiconductor character of the derivative compound of quinoline and quinoline conjugated metal as the raw material of the optical sensors. The derivative qompound of quinoline which used as organic semiconductor are 8-hydroxyquinoline and 8-8-hydroxyquinoline conjugated metal. Under the terms of the ease electrons movement, the metal used in this study are the metals of Group IIA and the metal of periode 3. This selection is useful to determine the contribution of the metals periodically to improve the semiconductor quality of conjugated organic compounds. Studies conducted theoretically through computation chemistry performance.
2. Method
Modeling quinoline and metal quinoline were performed using the Avogadro 1.1.0. The development of the model is done by considering the possibility of coordination covalent bonds involving d orbitals of group IIA metals and metals of period 3. The model is converted into the input file of computation chemistry with program of gabedit 2.4.7. Computing process is then run using NWCHEM 6.3. Computational chemistry is carried out based on density functional theory with the basis set 6-31G*/B3LYP/Restricted Kohn-Sam (RKS). Band gap is determined using the difference between LUMO and HOMO energies. The absorption of light the virtualized with Spartan program.
3. Result and Discussion
Modeling quinolineandmetal-quinolinewhich is done by using Avogadro, shown in Figure 3.1. The notation M in the center is metal marking, which is conjugated to the quinoline structures.
Table 3.1The band gap result of Quinoline andMetal-Quinoline
Compound HOMO-LUMO Energy (eV) Band gap (eV) HOMO Energy LUMO Energy
Quinoline -1.46458 -6.04240 4.57782
Mg-Quinoline -2.48919 -2.64952 0.16033
Ca-Quinoline -12.43888 -13.68823 1.24936
Cr-Quinoline -12.64305 -16.15032 3.50727
Fe-Quinoline -13.39013 -13.76018 0.37006
Ni-Quinoline -14.13851 -15.32044 1.18193
Zn-Quinoline -11.96226 -15.53794 3.57568
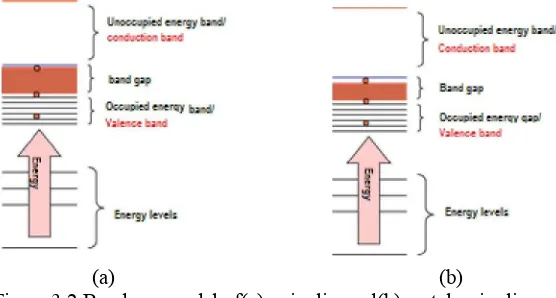
The decrease in the band gap is related to the narrowing gap between the valenceband and the conduction band. This is shown by band gap models in Figure 2. Valence band is indicated by the charging of the pile of orbitals in the HOMO groups and the conduction band is shown with a pile of the orbitals in the LUMO groups (Sanjaya et al, 2013).
(a) (b)
Figure 3.2.Band gap model of(a) quinolineand(b) metal-quinoline
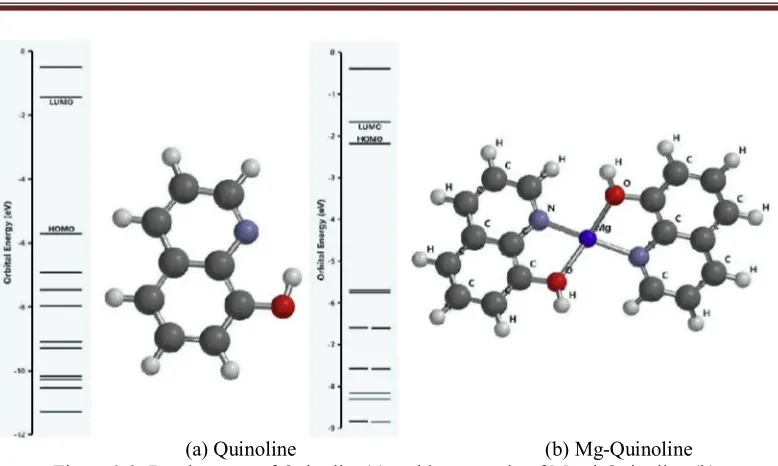
[image:3.612.173.451.344.493.2](a) Quinoline (b) Mg-Quinoline Figure 3.3. Band energy of Quinoline(a) andthe example of Metal-Quinoline (b)
The study could not show a decrease in band gap periodically for quinoline conjugated metals of group IIA and metals of period 3. There are few data on quinoline conjugated metal of group IIA. So it seemed only increase in band gap of Mg-quinoline into Ca-quinoline. While data from computational result of quinoline conjugated metals of period 3 shows the fluctuating band gap width.
Of the seven models of organic semiconductors which is computed, there are two compounds that are close to band gap of the silicon standard semiconductor (Gadisa, 2006),namely Ni-quinoline (Eg ~ 1.18 eV) and Ca-quinoline (Eg ~1.25 eV). There are two compounds that have band gap is smaller than the band gap of silicon, ie Mg-Quinoline (Eg ~0.16 eV)and Fe-Quinoline (Eg ~0.37 eV), so it is expected to work indoor.
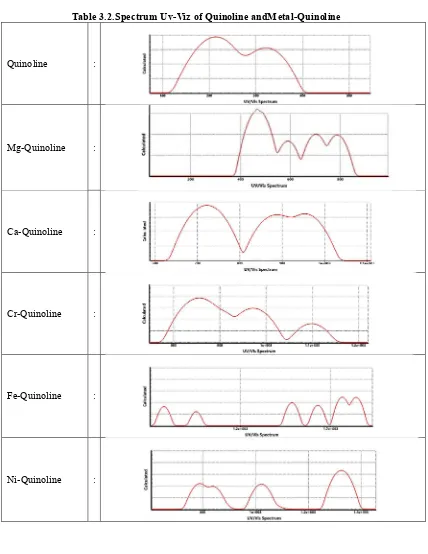
[image:4.612.116.518.513.600.2]Table 3.2.Spectrum Uv-Viz of Quinoline andMetal-Quinoline
Quinoline :
Mg-Quinoline :
Ca-Quinoline :
Cr-Quinoline :
Fe-Quinoline :
Zn-Quinoline :
Quinoline showed absorption at ultraviolet to violet region with the maximum wavelength in the ultraviolet region, = 214.39 nm. Mg-Quinoline has an absorption in blue to infrared light with a maximum wavelength in blue light area, = 470.57 nm. Ca-Quinoline has an absorption in the red to infrared regions with a maximum wavelength in the red light area, = 719.98 nm. Cr-Quinoline together with Ca-Quinoline has an absorption in the red to infrared region. It has a maximum withlength in infrared area, = 855.76 nm. Fe-Quinoline and Ni-Quinoline have absorption in infrared region with a maximum wavelength of each = 1764.39 nm and = 1325.20 nm. Actually, both of these compounds have also absorption in the red light up to pink light, but its intensity is very small so neglected in this study. The Zn-Quinoline has an absorption in the region of blue light to red light with a maximum wavelength in the blue light region, = 485.04 nm.
Photosensitivity of derivate compounds of quinoline shifted from the ultraviolet light into visible light region and infrared light region because of the conjugated metals. That work well in the visible light region is the conjugated metals Mg, Ca, Cr, and Zn although conjugation metals is partly also working in the infrared regions. While the rest of metal conjugate, is working in the infrared regions.
4. Conclusion
Pamungkas, G. dan Sanjaya, IGM. 2013.Kajian Teoritis Untuk Menentukan Celah Energi Porfirin Terkonjugasi Logam Kalsium Menggunakan Teori Fungsional Kerapatan (DFT),Unesa Journal of Chemistry Vol. 2, No. 1, hal 54-61.
Sanjaya, IGM., Pamungkas, G., Novita, D., 2013, Karakterisasi Berilium Porfirin Sebagai Bahan Dasar Fotodetektor, , HKI Cabang Sumbar: Seminar Nasional Kimia dan Pendidikan, Padang 7 Desember 2013