Acne Segmentation and Classification using Region
Growing and Self-Organizing Map
Gregorius Satia Budhi Informatics Department Petra Christian University
Surabaya, Indonesia [email protected]
Rudy Adipranata Informatics Department Petra Christian University
Surabaya, Indonesia [email protected]
Ari Gunawan Informatics Department Petra Christian University
Surabaya, Indonesia
Abstract—Acne vulgaris is a common skin disease found in human of all ages and genders. Acnes have different types according to their severity. In this research, an application were developed to segment and process the classification an acne
object in human’s face. The process begins with the insertion of
several seed points on a picture. Each of those seed points were developed further into a region that mask the whole acne using region growing method. Afterward, the regions were grouped together with other acne of similiar features using self-organizing map. According to the experimental result, the region growing method gives a satisfying result to do a segmentation on an acne object. But it should be pointed out that every different acne object requires different threshold to achieve an ideal result. Self-organizing map gives an undesirable result, as the input picture with different skin colors and lightning conditions affect the accuraccy of the result.
Keywords—acne segmentation, acne classification, region growing, self-organizing map
I. INTRODUCTION
Acne is a common skin problem found in humans of all ages and genders. Acne vulgaris is the most common type of acne found in humans, which generally grows in the face, back and neck [1]. Acne vulgaris can be classified into different categories based on the severity of the acne. The category of acne is important to know because it will affect the type of treatment that needs to be given to the acne [2]. The existence of different categories of acne that affect the type of treatment causes the need for a tool to know the type of acne that is on the face of the patient's skin.
The development of technology in the field of digital image processing and computer vision is very rapid. Computer vision is widely applied in the medical world to get accurate and low cost results. Acne is one type of skin problem that can be detected and grouped through a digital image application. Utilization of computer vision technology to detect skin problems in the form of acne is considered appropriate because of the many cases of acne problems in humans. According to Redfern [3], about 80 percent of all people have acne problems between the ages of 11 and 30. From the statement of Redfern, it can be concluded that the application of acne detection and classification has a broad base of prospective users. In this
research, an application were developed to segment and classify an acne object in human’s face by using region growing method and self-organizing map.
II. ACNE VULGARIS
Acne vulgaris is the most common type of acne found in humans, which generally grows in the face, back and neck [1]. Acne is very common and can be found in all demographics of gender and age. Acne vulgaris can be classified as:
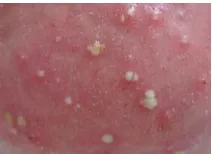
• Blackheads and whiteheads, are pores covered by oil, dead skin cells, and bacteria. This type of acne is not yet considered dangerous. Blackheads are usually very small so it is quite difficult to do segmentation. The picture of blackheads and whiteheads can be seen in Fig. 1.
(a) (b) Fig. 1. Blackheads (a) and Whiteheads (b) Acne [4]
• Papules are pores that are suffering from severe irritation causing the appearance of reddish pink skin bulge. Usually there is no fluid in this type of acne. The characteristics of this acne are round, small, and red. The papules can be seen in Fig. 2.
Fig. 2. Papules Acne [4]
Fig. 3. Pustules Acne [4]
• Nodules and cysts are acne that is inflamed too severe to cause a large bulge and cause pain. The difference between the two is that the nodules feel hard while the cysts have pus and are softer to the touch. Both types of acne should be treated by a doctor because if handled incorrectly it can cause a permanent scar. The characteristic of the nodule is a large acne form with a purplish red. The characteristics of the cyst resemble the nodule but the cyst has blood, pus, or wound marks. Nodules and cysts can be seen in Fig. 4.
(a) (b) Fig. 4. Nodules and cysts acne [4]
III. REGION GROWING METHOD
Region growing method is an image segmentation method that each adjacent pixel is examined one by one and fed into a region when no edge is detected [5]. This process is repeated for each pixel boundary in the region to find an edge. The first stage in the growing region is to determine a set of seed points. Seed points are determined based on user input criteria. Example of a seed point is a pixel with a certain grayscale range. The location of each region starts exactly at each seed point on the set. Each region is then developed from each seed point to each pixel next to it if the pixel meets the criteria for becoming a member of that region.
Some of the advantages of region growing with other segmentation methods are:
1. The regional growing method can separate precisely those regions that share the same traits.
2. The region growing method can display the original image with clear segmentation result limits.
3. The concept of the region growing method is simple, it only takes a number of seed points to represent the desired characteristics of the region to be developed.
4. The seed points and criteria can be specified by the user. 5. Can use multiple criteria at one time.
6. Excellent performance
There are also some deficiencies in the region growing method, such as large time and computation consumption and noise on the image can cause holes or over segmentation in the
region. But for noise problems can be solved using filters to blur the noise. In the process, the region growing will perform a recursive process for each image pixel adjacent to the seed points and pixels that have entered into the region. According to Haralick and Saphiro [6], the simplest way to determine whether pixels are the member of the same region is using thresholding.
In the thresholding method, to determine whether one pixel and its neighboring pixel is a region, the calculation of the color space distance between the two pixels. This calculation can use the euclidean distance equation (1):
(1) • d (p, q) is the pixel at p and q coordinates
• pk and qk are the k-attribute of p and q objects, where the
attribute is the RGB color
After getting the similarity distance between two pixels using Euclidean distance, then the user specifies a threshold. If the distance is smaller or equal to the threshold the user wants, then the pixel is in the same region as the seed point.
IV. SELF-ORGANIZING MAP
Self-organizing Map (SOM) is one type of artificial neural network with unsupervised learning training method that aims to map and analyze high-dimensional data into the form of low-dimensional map [7]. Data is generally mapped into one or two dimensional maps. Like other artificial neural networks, SOM has 2 stages of training and mapping. In SOM training stage create map using input sample. At the mapping stage, SOM automatically classifies new user input vectors.
A SOM contains components called nodes or neurons. Each node is paired with a vector weight with the same dimension as the input data vector and its position in the map space. SOM puts the data vector inside the map space by searching for the node with the closest vector weight distance to the vector data. SOM architecture can be seen in Fig. 5.
Y1 Yj Ym
The distance is calculated using the weighted euclidean distance in equation (2). • n is the number of dimensions or attributes. • pkand qkarethe k -attributes of p and q objects
• k is the weight of each dimension
1. Initiation of vector weight Wij with random value. The
range of weight vector is the same as the input vector. Next, the initiation of topological neighborhood parameter R and learning rate .
2. As long as the data have not convergen or have not reached the stop condition, do step 3-9.
3. For each input vector x, do step 4-6.
4. For each j, do the euclidean D(j) = i (wij – xi) 2
5. Find index j where D(j) is the smallest.
6. For every j in neighborhood and at each i do calculation
wij(new) = wij(old) + [xi– wij(old)]
7. Update the learning rate .
8. Reduce the radius of R at any given interval. Reduction of R does not have to be done on each iteration.
V. SYSTEM DESIGN
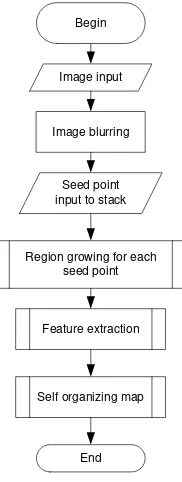
In developing a system to segment and classify acne, we performed several stages. These stages can be seen as follows in Fig. 6.
Begin
Image input
Image blurring
Seed point input to stack
Region growing for each seed point
Feature extraction
Self organizing map
End
Fig. 6. System Design
The first step is to insert a picture of faces that contain acne as an input. The picture will be blurred by using Gaussian Blur, to decrease the amount of noise, considering that one of the weaknesses of region growing method is noise. Furthermore, the seed point is entered in the picture. Seed points are placed on the pimples on the face by the user. Each seed point will be inserted into a stack. After all seed point is placed then the region growing method is done on each seed point that is in the stack. The output of the region growing process is the collection of pixels that each collection is called a region. To be able to classify each region into one category of acne, a feature that can distinguish each region is required. At this stage the feature extraction of each region to be used before self-organizing map is executed. After all regions have its features, all of these features are inserted in the normalized
vector form into self-organizing map. At this stage, each region is grouped into a category.
VI. EXPERIMENTAL RESULT
In this experiment carried out some such testing: tests on the thresholding parameters for the region growing process against different acne forms and testing of Self-organizing Map accuracy for acne images with several numbers of clusters and several numbers of training inputs.
In each experiment of the Region Growing method, the selected seed point is darkest pixel of the acne. The threshold value starts from 20 to 100. In Table 1 can be seen the result of region growing for pustules acne.
TABLE I. REGION GROWING RESULT FOR PUSTULES ACNE
No. Input Output Threshold
1. 20
2. 25
3. 30
4. 35
5. 40
6. 45
7. 50
8. 55
10. 65
11. 70
12. 75
13. 80
14. 100
15. 120
16. Failed to segment 150
From Table I, it can be concluded that the experiment result on the difference of threshold value is enough to influence the segmentation result from region growing. When the threshold value is small, the segmented area of the seed point is only a small part of the whole acne area. From the experiment, the ideal threshold value ranges from 60 to 70. Using threshold value above 80 can be seen that the results of segmentation come out of the acne area, and if using threshold value that is too large, the segmentation no longer find the tip so that no segmentation occurs.
The testing process on the results of the Self-organizing Map is done in 3x3, 4x4, and 5x5 cluster map. In this test will be sought whether the two-dimensional cluster of Self-organizing Map affect the accuracy of the results of training and testing Self-organizing Map. The test is done with a maximum epoch value of 100 and learning rate with a value of 0.8. Input samples were 10 samples of papules, 10 samples of pustules, 10 sample of nodules, and 10 samples of cyst. Total of all samples are 40 acne images. Due to the limitations of the sample images, the acne pictures are taken from facial photos with different lighting and color.
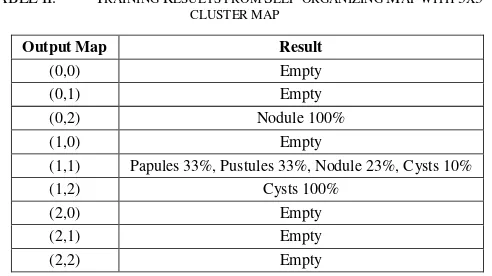
First experiment is training of Self-organizing Map using 3x3 cluster map. The result can be seen in Table II.
TABLE II. TRAINING RESULTS FROM SELF-ORGANIZING MAP WITH 3X3
CLUSTER MAP
Output Map Result
(0,0) Empty (0,1) Empty (0,2) Nodule 100% (1,0) Empty
(1,1) Papules 33%, Pustules 33%, Nodule 23%, Cysts 10% (1,2) Cysts 100%
(2,0) Empty (2,1) Empty (2,2) Empty
From training result in Table II, it shows the color similarities in pustules and cysts where pustules have red and yellow color, while cysts have red, purple and white. The resemblance of the color of each type of acne causes everything to collect in one place.
Furthermore, using the results of the training, it will try to classify samples consist of two samples for each acne types which are different from the training sample. Training sample is also taken from several different facial photos with variations of lighting and skin color. The test result can be seen in Table III.
TABLE III. TEST RESULTS OF SELF-ORGANIZING MAP WITH 3X3
CLUSTER MAP
Acne Image Acne Type
Output Map Result
Papules Map (1,1) Correct Papules Map (1,1) Correct Pustules Map (1,1) Correct Pustules Map (1,1) Correct
Nodule Map (0,2) Correct
Nodule Map (1,2) Wrong
Cysts Map (1,2) Correct
Cysts Map(1,2) Correct
Next, we try to train the same training sample using 4x4 cluster map. The training result can be seen in Table IV.
TABLE IV. TRAINING RESULTS OF SELF-ORGANIZING MAP WITH
4X4 CLUSTER MAP
Output Map Result
(0,0) Papules 33%, Pustules 33%, Nodule 23%, Cysts 10% (0,1) Empty
(0,2) Nodule 100% (0,3) Empty (1,1) Empty (1,2) Empty (1,3) Empty (2,0) Empty (2,1) Empty (2,2) Cyst 100% (2,3) Empty (3,0) Empty (3,1) Empty (3,2) Empty (3,3) Empty
Table IV shows that the result of the Self-organizing Map classification using 4x4 cluster map similar to result of 3x3 cluster map.
Using training result in Table IV, we try to test another samples and the test result can be seen in Table V.
TABLE V. TEST RESULTS OF SELF-ORGANIZING MAP WITH 4X4
CLUSTER MAP
Acne Image Acne Type Output Map Result
Papules Map (2,2) Correct Papules Map (2,2) Correct Pustules Map (0,0) Correct Pustules Map (2,2) Correct Nodule Map (0,2) Correct
Nodule Map (0,2) Wrong
Cysts Map (0,0) Correct
Cysts Map(2,2) Correct
In Table V, it was found that the test results from Self-organizing Map with 4x4 cluster map have the same result with testing result from Self-organizing Map with cluster 3x3.
Next experiment is using 6x6 cluster map to train the sample of acnes. Training result can be seen in Table VI.
TABLE VI. TRAINING RESULTS OF SELF-ORGANIZING MAP WITH
5X5 CLUSTER MAP
Output Map Result
(0,0) Empty (0,1) Empty (0,2) Empty (0,3) Empty (0,4) Pustules 50%, Cysts 50% (1,0) Empty (1,1) Empty (1,2) Empty (1,3) Empty (1,4) Empty (2,2) Empty (2,3) Nodule 100% (2,4) Empty (3,0) Empty (3,1) Empty (3,2) Empty (3,3) Papules 100% (3,4) Empty (4,0) Empty (4,1) Empty (4,2) Empty (4,3) Empty (4,4) Empty
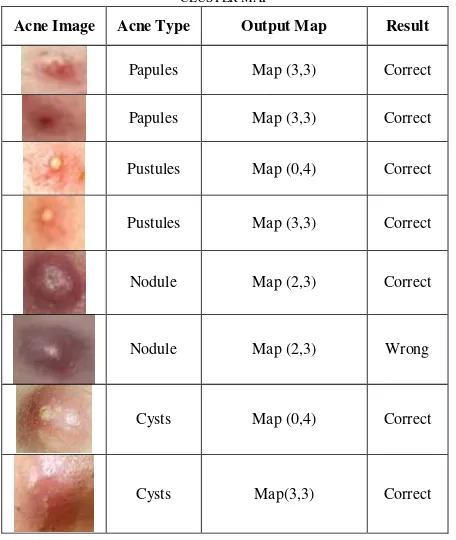
By using training result, we try to test using another sample and 5x5 cluster map Self-organizing Map. The test result can be seen in Table VII.
TABLE VII. TEST RESULTS OF SELF-ORGANIZING MAP WITH 5X5
CLUSTER MAP
Acne Image Acne Type Output Map Result
Papules Map (3,3) Correct Papules Map (3,3) Correct Pustules Map (0,4) Correct Pustules Map (3,3) Correct
Nodule Map (2,3) Correct
Nodule Map (2,3) Wrong
Cysts Map (0,4) Correct
From all the above tests it can be concluded that the Self-organizing Map method is able to classify acne, but because the color features of each acne are similar to each other, different acne type can be grouped into one category. Using 5x5 cluster map better than using 3x3 or 4x4 because in one output map, maximum there are only two acne types, compare with using 3x3 or 4x4, in one output map, there are three or four acne types.
VII. CONCLUSION
From experiments that have been done can be concluded that acne types such as papules, pustules, nodules, and cysts can be detected and segmented with satisfactory results using region growing method. The satisfactory results are obtained with a note, the seed point is the darkest pixels of the acne, and the threshold is adjusted. For most types of acne, the ideal threshold value ranges from 60 to 70. Self-organizing Map has been able to classify acne based on its color features, but because the color features of each acne are similar to each other, different acne type can be grouped into one category
REFERENCES
[1] Plewig, Gerd, dan Albert M. Kligman, “Acne and Rosacea, 3rd ed.” Springer-Verlag, 2011.
[2] Dawson, Annelise L., dan Robert P. Dellavalle, “Acne Vulgaris," The BMJ 2013;346:f2634, 2013.
[3] Redfern, Robert, “Improving Acne, Eczema and Psoriasis in 30 Days: Clear Acne, Eczema and Psoriasis in 30 Days: Healthy Skin Rehabilitation For The Long Term,” Naturally Healthy Publications, 2016.
[4] Kathri, Minesh, MD, "Acne Visual Dictionary: Pictures of Types of Acne and How to Treat Them," retrieved 10 June 2016 from www.webmd.com.
[5] Kamdi, Shilpa, dan R. K. Krishna, "Image Segmentation and Region Growing Algorithm," International Journal of Computer Technology and Electronics Engineering (IJCTEE) vol. 2, 2012.
[6] Haralick, Robert M., and Linda G. Shapiro, "Image Segmentation Techniques," Computer Vision, Graphics, and Image Processing vol. 9, issue 1 pp. 100-132, 1985
![Fig. 1. Blackheads (a) and Whiteheads (b) Acne [4]](https://thumb-ap.123doks.com/thumbv2/123dok/1587215.2055396/1.595.378.494.575.671/fig-blackheads-whiteheads-b-acne.webp)