Communications
in Computer and Information Science
516
Editorial Board
Simone Diniz Junqueira Barbosa
Pontifical Catholic University of Rio de Janeiro (PUC-Rio), Rio de Janeiro, Brazil
Phoebe Chen
La Trobe University, Melbourne, Australia Alfredo Cuzzocrea
ICAR-CNR and University of Calabria, Cosenza, Italy Xiaoyong Du
Renmin University of China, Beijing, China Joaquim Filipe
Polytechnic Institute of Setúbal, Setúbal, Portugal Orhun Kara
TÜB˙ITAK B˙ILGEM and Middle East Technical University, Ankara, Turkey Igor Kotenko
St. Petersburg Institute for Informatics and Automation of the Russian Academy of Sciences, St. Petersburg, Russia
Krishna M. Sivalingam
Indian Institute of Technology Madras, Chennai, India Dominik ´Sl˛ezak
University of Warsaw and Infobright, Warsaw, Poland Takashi Washio
Osaka University, Osaka, Japan Xiaokang Yang
Rolly Intan
·
Chi-Hung Chi
Henry N. Palit
·
Leo W. Santoso (Eds.)
Intelligence in the Era
of Big Data
4th International Conference
on Soft Computing, Intelligent Systems
and Information Technology, ICSIIT 2015
Bali, Indonesia, March 11–14, 2015
Proceedings
Editors
Rolly Intan Informatics
Petra Christian University Surabaya
Indonesia
Chi-Hung Chi CSIRO Hobart Tasmania Australia
Henry N. Palit Informatics
Petra Christian University Surabaya
Indonesia
Leo W. Santoso Informatics
Petra Christian University Surabaya
Indonesia
ISSN 1865-0929 ISSN 1865-0937 (electronic) Communications in Computer and Information Science
ISBN 978-3-662-46741-1 ISBN 978-3-662-46742-8 (eBook) DOI 10.1007/978-3-662-46742-8
Library of Congress Control Number: 2015934823 Springer Heidelberg New York Dordrecht London
c
Springer-Verlag Berlin Heidelberg 2015
This work is subject to copyright. All rights are reserved by the Publisher, whether the whole or part of the material is concerned, specifically the rights of translation, reprinting, reuse of illustrations, recitation, broad-casting, reproduction on microfilms or in any other physical way, and transmission or information storage and retrieval, electronic adaptation, computer software, or by similar or dissimilar methodology now known or hereafter developed.
The use of general descriptive names, registered names, trademarks, service marks, etc. in this publication does not imply, even in the absence of a specific statement, that such names are exempt from the relevant protective laws and regulations and therefore free for general use.
The publisher, the authors and the editors are safe to assume that the advice and information in this book are believed to be true and accurate at the date of publication. Neither the publisher nor the authors or the editors give a warranty, express or implied, with respect to the material contained herein or for any errors or omissions that may have been made.
Printed on acid-free paper
Preface
This proceedings volume contains papers presented at the fourth International Con-ference on Soft Computing, Intelligent System and Information Technology (the 4th ICSIIT) held in Bali, Indonesia, during March 11–14, 2015. The main theme of this in-ternational conference is “Intelligence in the Era of Big Data,” and it was organized and hosted by Informatics Engineering Department, Petra Christian University, Surabaya, Indonesia.
The Program Committee received 92 submissions for the conference from across Indonesia and around the world. After peer-review process by at least two reviewers per paper, 53 papers were accepted and included in the proceedings. The papers were divided into 14 groups: fuzzy logic and control system, genetic algorithm and heuris-tic approaches, artificial intelligence and machine learning, similarity-based models, classification and clustering techniques, intelligent data processing, feature extraction, image recognition, visualization technique, intelligent network, cloud and parallel com-puting, strategic planning, intelligent applications, and intelligent systems for enterprise government and society.
We would like to thank all Program Committee members for their effort in providing high-quality reviews in a timely manner. We thank all the authors of submitted papers and the authors of selected papers for their collaboration in preparation of the final copy. Compared to the previous ICSIIT conferences, the number of participants at the 4th ICSIIT 2015 is not only higher, but also the research papers presented at the conference are improved both in quantity and quality. On behalf of the Organizing Committee, once again, we would like to thank all the participants of this conference, who contributed enormously to the success of the conference.
We hope all of you enjoy reading this volume and that you will find it inspiring and stimulating for your research and future work.
February 2015 Rolly Intan
Organization
The International Conference on Soft Computing, Intelligent System and Information Technology (ICSIIT) 2015 (http://icsiit.petra.ac.id) took place in Bali, Indonesia, during March 11–14, 2015, hosted by Informatics Department, Petra Christian University.
General Chair
Leo Willyanto Santoso Petra Christian University, Indonesia
Program Chairs
Chen Ding Ryerson University, Canada
Justinus Andjarwirawan Petra Christian University, Indonesia
Wei Zhou CSIRO, Australia
Registration Chairs
Silvia Rostianingsih Petra Christian University, Indonesia
Local Arrangement Chairs
Agustinus Noertjahyana Petra Christian University, Indonesia
Financial Chairs
Alexander Setiawan Petra Christian University, Indonesia
Program Committee
A. Min Tjoa Vienna University of Technology, Austria
A.V. Senthil Kumar Hindusthan College of Arts and Science, India
Achmad Nizar Hidayanto University of Indonesia, Indonesia
Alexander Fridman Institute for Informatics and Mathematical
Modelling, Russia
Arif Anjum University of Pune, India
Ashraf Elnagar University of Sharjah, United Arab Emirates
Bruce Spencer University of New Brunswick, Canada
VIII Organization
Can Wang CSIRO, Australia
Chi-Hung Chi CSIRO, Australia
Dengwang Li Shandong Normal University, China
Eduard Babulak Maharishi University of Management in Fairfield,
USA
Enrique Dominguez University of Malaga, Spain
Erma Suryani Sepuluh Nopember Institute of Technology,
Indonesia
Felix Pasila Petra Christian University, Indonesia
Hans Dulimarta Grand Valley State University, USA
Henry N. Palit Petra Christian University, Indonesia
Hong Xie Murdoch University, Australia
Ibrahiem M. M. El Emary King Abdulaziz University, Saudi Arabia
Ilung Pranata The University of Newcastle, Australia
Julien Dubois Université de Bourgogne, France
Kassim S. Mwitondi Sheffield Hallam University, UK
Kelvin Cheng National University of Singapore, Singapore
Marian S. Stachowicz University of Minnesota, USA
Masashi Emoto Meiji University, Japan
Mehmed Kantardzic University of Louisville, USA
Moeljono Widjaja Agency for the Assessment and Application
of Technology, Indonesia
Mohd Yunus Bin Nayan Universiti Teknologi Petronas, Malaysia
Muhammad Aamir Cheema Monash University, Australia
Noboru Takagi Toyama Prefectural University, Japan
Nur Iriawan Sepuluh Nopember Institute of Technology,
Indonesia
P.S. Avadhani Andhra University, India
Pitoyo Hartono Chukyo University, Japan
Pujianto Yugopuspito Pelita Harapan University, Indonesia
Raymond Kosala Binus University, Indonesia
Raymond Wong University of New South Wales, Australia
Roberto Rojas-Cessa New Jersey Institute of Technology, USA
Rolly Intan Petra Christian University, Indonesia
Rudy Setiono National University of Singapore, Singapore
S. Thabasu Kannan Pannai College of Engineering and Technology,
India
Sankar Kumar Pal Indian Statistical Institute, India
Saurabh K. Garg University of Tasmania, Australia
Selpi Chalmers University of Technology, Sweden
Shafiq Alam Burki University of Auckland, New Zealand
Shan-Ling Pan University of New South Wales, Australia
Simon Fong University of Macau, Macau
Organization IX
Son Kuswadi Electronic Engineering Polytechnic Institute of
Surabaya, Indonesia
Suash Deb CV Raman College of Engineering, India
Suphamit Chittayasothorn King Mongkut’s Institute of Technology
Ladkrabang, Thailand
Taweesak Kijkanjanarat Thammasat University, Thailand
Vatcharaporn Esichaikul Asian Institute of Technology, Thailand
Vincent Vajnovszki Université de Bourgogne, France
Wen-June Wang National Central University, Taiwan
Wichian Chutimaskul King Mongkut’s University of Technology
Thonburi, Thailand
Xiaojun Ye Tsinghua University, China
Yung-Chen Hung Soochow University, Taiwan
Data Mining Model for Road Accident Prediction in
Developing Countries
Sanjay Misra
Covenant University, Canaanland, Ogun State, Ota, Nigeria [email protected]
Abstract. Human loss due to road traffic accident (RTA) in developing coun-tries is a big challenge. It becomes more serious in those developing councoun-tries where road conditions are not good and due to several reasons government is not able to maintain roads on regular basis. Additionally, increasing number of vehi-cles, inefficient driving and environmental conditions are also some of the factors which are responsible for RTA. In this work we present architecture of a data mining model. The proposed model is applied on real data set of RTAs from a developing country. The analysis of data gives several useful results, which can be used for future planning to reduce RTAs in developing countries. This paper also presents that how data mining model is better than other models.
Behaviour Informatics: Capturing Value Creation
in the Era of Big Data
Chi-Hung Chi
Digital Productivity Flagship, CSIRO, Australia [email protected]
Abstract. Under the era of Big Data, people have been exploring ways of real-izing value from data that are at their fingertips. However, it is found that while collecting data is not difficult, value creation is often a big challenge. This makes the approach of “collecting data first before knowing what to do with them” ques-tionable. In this presentation, we discuss the current challenges of big data ana-lytics and suggest how behaviour anaana-lytics on trajectory data can help to realize value creation from Big Data.
1
Background and Challenges
As we move to the fourth paradigm of computing – data intensive scientific discovery, numerous research efforts have been spent in building huge big data repositories. To-gether with data mining and machine learning research, it is hoped that better and more intelligent decisions can be made in real time.
This movement is accelerated by the advance in at least three areas. The first one is social network, where people share their views and opinions in public. The second one is cloud computing, which is an on-demand infrastructure that facilitates sharing of data, collaboration among multiple parties, and support for on-demand computational and storage infrastructure services at low cost. The third one is the internet-of-things. With the maturity of sensor technologies, trajectory movement of entities (including human and things) can now be monitored in real time at low cost. However, gaining access to big data is only the starting point. There are still open issues that need to be addressed in the value creation process when dealing with big data.
One result of the big data mega trend is the building of huge data repositories around the world. In Australia, the government has been pushing for sharing bureau data through spatial information platforms. It is true that data are collected and can be made available to users, but how to make sense out of these data practically and eco-nomically is still a mystery to be explored. Without value creation, the high maintenance cost of these repositories cannot be justified, and the motivation for data providers to update their data inside will also disappear.
Behaviour Informatics: Capturing Value Creation in the Era XV
animals, and even insects (e.g. honey bees) possible. However, without efficient and effective ways to integrate and transform these trajectory data and their context infor-mation into manageable knowledge, these data are actually burdens instead of potentials to their owners.
It is true that there have been numerous research efforts in data mining and ma-chine learning. However, most of them are focused on theoretical algorithmic study, and much less emphasis is put in the incorporation of semantic domain knowledge (in particular, the semantic definition of interdependence among various data sources) into the data mining and pattern discovery processes, and in the use of the behaviour inte-rior dimensions such as loyalty and purchase power of customers to support self service analytics.
Related to the analytics platform, internet-of-things, service and cloud computing techniques are quite mature, and lots of machine learning algorithms are also widely available in both commercial (e.g. MatLib) and open source (“Project R”) packages. However, how to put them together in a single service platform and how to compose them together automatically (this is called the vertical service composition) to provide “intelligence-as-a-service” for a given domain are still open for exploration.
2
Real Time Trajectory Data and Its Challenges in Value Creation
In the era of big data, one new important data source for analytics and value creation is the real-time behaviour trajectory data streams of entities (e.g. human) as well as their context dynamics (e.g. environmental such as air quality) that are captured through internet-of-things and sensors (in particular body sensors such as those from Android wears and location position sensors). Its value creation process is both complex and challenging because these data are in general heterogeneous and inter-dependent on each other. Furthermore, the potential number of data sources, each describing one mea-surement view of the behaviour dynamics of an entity/event, is in theory, infinite.
Traditional data mining and machine learning approaches from computer science often try to explore co-occurrence patterns and inter-relationship among trajectory data. However, this is usually done without making full use of the interdependence defined by their implicit semantic meaning and domain knowledge. Heterogeneity of data adds another level of complication because quantification measures such as distance are not uniformly and consistently defined across different data types. On the other hand, al-though domain experts have full knowledge on the semantics of data, they are often not as knowledgeable as computer scientists when dealing with the real time computation on trajectory data streams. This result in the first challenge, how to use data mining / machine learning techniques and domain knowledge together to effectively define and discover the inter-relationships among different trajectory data sources and to perform effective behaviour analysis.
XVI C.-H. Chi
knowledge dimensions of entities, by incorporating domain knowledge into the knowl-edge discovery processes. As an example, the owner of an online shop wants to know not only the “bestselling products of the week”, but also the “loyalty”, “purchase power”, “experience”, and “satisfaction” of customers. This results in the second challenge, how to quantify behaviour interior dimensions from exterior transactional (or phys-ically measured) trajectory data and to discover their inter-relationships and relative importance for effective and efficient behaviour analysis.
3
Research Topics in Behaviour Analytics
To achieve this goal, the following is a list of sample research topics for behaviour analytics:
• Effective and efficient deployment of high resolution location tracking network
(us-ing Blue-Tooth LE, WiFi-RFIDs, UWB, and Electromagnetic Field) for entities in both indoor and outdoor environment. This forms the basis for behaviour trajectory data tracking and capturing.
• Semantic enrichment of behaviour trajectory data of entities through aggregation
of raw trajectory data with their contextual data dynamics, followed by domain knowledge-driven transformation to form behaviour interior dimensions knowl-edge. This is the data aggregation, integration, and transformation aspects of be-haviour analytics; it incorporates domain knowledge into the bebe-haviour trajectory data to create behaviour interior dimensions knowledge as well as to define the interdependence relationship among them.
• Discovery of interdependence relationship among trajectory-driven behaviour data
(exterior) and knowledge streams (interior) using data mining techniques. This ad-dresses the interdependence relationships of trajectory data and knowledge streams from the run-time dynamics aspect.
• Coupling interdependence relationships of behaviour trajectory data and
knowl-edge streams into data mining and pattern discovery processes for deep behaviour understanding and prediction. This gives a much better understanding on why things occur; it also gives potentials for future behaviour prediction.
• Design and implementation of a behaviour analytics service system that serves as a
On the Relation of Probability, Fuzziness,
Rough and Evidence Theory
Rolly Intan
Petra Christian University Department of Informatics Engineering
Surabaya, Indonesia [email protected]
Abstract. Since the appearance of the first paper on fuzzy sets proposed by Zadeh in 1965, the relationship between probability and fuzziness in the rep-resentation of uncertainty has been discussed among many people. The question is whether probability theory itself is sufficient to deal with uncertainty. In this paper the relationship between probability and fuzziness is analyzed by the pro-cess of perception to simply understand the relationship between them. It is clear that probability and fuzziness work in different areas of uncertainty. Here, fuzzy event in the presence of probability theory providesprobability of fuzzy eventin which fuzzy event could be regarded as a generalization of crisp event. More-over, in rough set theory, a rough event is proposed representing two approximate events, namely lower approximate event and upper approximate event. Similarly, in the presence of probability theory, rough event can be extended to be probabil-ity of rough event. Finally, the paper shows and discusses relation among lower-upper approximate probability (probability of rough events), belief-plausibility measures (evidence theory), classical probability measures, probability of gener-alized fuzzy-rough events and probability of fuzzy events.
Contents
Invited Paper
On the Relation of Probability, Fuzziness, Rough and Evidence
Theory . . . 3
Rolly Intan
Fuzzy Logic and Control System
A Study of Laundry Tidiness: Laundry State Determination Using
Video and 3D Sensors . . . 19
Daiki Hirose, Tsutomu Miyoshi, and Kazuki Maiya
Direction Control System on a Carrier Robot Using Fuzzy Logic
Controller. . . 27
Kevin Ananta Kurniawan, Darmawan Utomo, and Saptadi Nugroho
Multidimensional Fuzzy Association Rules for Developing Decision
Support System at Petra Christian University . . . 37
Yulia, Siget Wibisono, and Rolly Intan
Genetic Algorithm and Heuristic Approaches
Genetic Algorithm for Scheduling Courses. . . 51
Gregorius Satia Budhi, Kartika Gunadi, and Denny Alexander Wibowo
Optimization of Auto Equip Function in Role-Playing Game Based on
Standard Deviation of Character’s Stats Using Genetic Algorithm. . . 64
Kristo Radion Purba
The Design of Net Energy Balance Optimization Model for Crude Palm
Oil Production . . . 76
Jaizuluddin Mahmud, Marimin, Erliza Hambali, Yandra Arkeman, and Agus R. Hoetman
ACO-LS Algorithm for Solving No-wait Flow Shop Scheduling
Problem . . . 89
Ong Andre Wahyu Riyanto and Budi Santosa
A New Ant-Based Approach for Optimal Service Selection with E2E
QoS Constraints. . . 98
XX Contents
Artificial Intelligence and Machine Learning
Implementation Discrete Cosine Transform and Radial Basis Function
Neural Network in Facial Image Recognition. . . 113
Marprin H. Muchri, Samuel Lukas, and David Habsara Hareva
Implementation of Artificial Intelligence with 3 Different Characters of
AI Player on “Monopoly Deal” Computer Game. . . 119
Irene A. Lazarusli, Samuel Lukas, and Patrick Widjaja
Optimizing Instruction for Learning Computer Programming – A Novel
Approach. . . 128
Muhammed Yousoof and Mohd Sapiyan
Sequential Pattern Mining Application to Support Customer Care “X”
Clinic . . . 140
Alexander Setiawan, Adi Wibowo, and Samuel Kurniawan
Similarity-Based Models
The Comparation of Distance-Based Similarity Measure to Detection
of Plagiarism in Indonesian Text. . . 155
Tari Mardiana, Teguh Bharata Adji, and Indriana Hidayah
Document Searching Engine Using Term Similarity Vector Space Model
on English and Indonesian Document. . . 165
Andreas Handojo, Adi Wibowo, and Yovita Ria
Knowledge Representation for Image Feature Extraction. . . 174
Nyoman Karna, Iping Suwardi, and Nur Maulidevi
Using Semantic Similarity for Identifying Relevant Page Numbers for
Indexed Term of Textual Book. . . 183
Daniel Siahaan and Sherly Christina
Classification and Clustering Techniques
The Data Analysis of Stock Market Using a Frequency Integrated
Spherical Hidden Markov Self Organizing Map. . . 195
Gen Niina, Tatsuya Chuuto, Hiroshi Dozono, and Kazuhiro Muramatsu
Attribute Selection Based on Information Gain for Automatic Grouping
Student System. . . 205
Contents XXI
Data Clustering through Particle Swarm Optimization Driven
Self-Organizing Maps. . . 212
Tad Gonsalves and Yasuaki Nishimoto
Intelligent Data Processing
A Search Engine Development Utilizing Unsupervised Learning
Approach. . . 223
Mohd Noah Abdul Rahman, Afzaal H. Seyal, Mohd Saiful Omar, and Siti Aminah Maidin
Handling Uncertainty in Ontology Construction Based on Bayesian
Approaches: A Comparative Study. . . 234
Foni Agus Setiawan, Wahyu Catur Wibowo, and Novita Br Ginting
Applicability of Cyclomatic Complexity on WSDL . . . 247
Sanjay Misra, Luis Fernandez-Sanz, Adewole Adewumi, Broderick Crawford, and Ricardo Soto
Feature Extraction
Multiclass Fruit Classification of RGB-D Images Using Color and
Texture Feature . . . 257
Ema Rachmawati, Iping Supriana, and Masayu Leylia Khodra
Content-Based Image Retrieval Using Features in Spatial and
Frequency Domains . . . 269
Kazuhiro Kobayashi and Qiu Chen
Feature Extraction for Java Character Recognition. . . 278
Rudy Adipranata, Liliana, Meiliana Indrawijaya, and Gregorius Satia Budhi
Fast Performance Indonesian Automated License Plate Recognition
Algorithm Using Interconnected Image Segmentation. . . 289
Samuel Mahatmaputra Tedjojuwono
Image Recognition
A Study of Laundry Tidiness: Socks Pairing Using Video and
3D Sensors. . . 303
Kazuki Maiya, Tsutomu Miyoshi, and Daiki Hirose
Design and Implementation of Skeletonization . . . 314
XXII Contents
A Computer-Aided Diagnosis System for Vitiligo Assessment:
A Segmentation Algorithm. . . 323
Arfika Nurhudatiana
Face Recognition for Additional Security at Parking Place . . . 332
Semuil Tjiharjadi and William Setiadarma
Optic Disc Segmentation Based on Red Channel Retinal Fundus
Images . . . 348
K.Z. Widhia Oktoeberza, Hanung Adi Nugroho, and Teguh Bharata Adji
Visualization Techniques
Multimedia Design for Learning Media of Majapahit . . . 363
Silvia Rostianingsih, Michael Chang, and Liliana
Adding a Transparent Object on Image. . . 372
Liliana, Meliana Luwuk, and Djoni Haryadi Setiabudi
3D-Building Reconstruction Approach Using Semi-global Matching
Classified . . . 382
Iqbal Rahmadhian Pamungkas and Iping Supriana Suwardi
Intelligent Network
Spanning Tree Protocol Simulation Based on Software Defined Network
Using Mininet Emulator . . . 395
Indrarini Dyah Irawati and Mohammad Nuruzzamanirridha
Varnish Web Cache Application Evaluation . . . 404
Justinus Andjarwirawan, Ibnu Gunawan, and Eko Bayu Kusumo
DACK-XOR: An Opportunistic Network Coding Scheme to Address
Intra-flow Contention over Ad Hoc Networks . . . 411
Radha Ranganathan, Kathiravan Kannan, P. Aarthi, and S. LakshmiPriya
Network Security Situation Prediction: A Review and Discussion. . . 424
Yu-Beng Leau and Selvakumar Manickam
Cloud and Parallel Computing
Lightweight Virtualization in Cloud Computing for Research . . . 439
Muhamad Fitra Kacamarga, Bens Pardamean, and Hari Wijaya
A Cloud-Based Retail Management System . . . 446
Contents XXIII
Towards a Cloud-Based Data Storage Medium for E-learning Systems
in Developing Countries . . . 457
Temitope Olokunde and Sanjay Misra
Fast and Efficient Parallel Computations Using a Cluster of
Workstations to Simulate Flood Flows. . . 469
Sudi Mungkasi and J.B. Budi Darmawan
Strategic Planning
A Simulation Model for Strategic Planning in Asset Management of
Electricity Distribution Network . . . 481
Erma Suryani, Rully Agus Hendrawan, Eka Adipraja Philip Faster, and Lily Puspa Dewi
Enhancing the Student Engagement in an Introductory Programming: A Holistic Approach in Improving the Student Grade in the Informatics
Department of the University of Surabaya. . . 493
Budi Hartanto
Business Process Maturity at Agricultural Commodities Company . . . 505
Lily Puspa Dewi, Adi Wibowo, and Andre Leander
Innovation Strategy Services Delivery: An Empirical Case Study of
Academic Information Systems in Higher Education Institution. . . 514
John Tampil Purba and Rorim Panday
Intelligent Applications
Public Transport Information System Using Android . . . 529
Agustinus Noertjahyana, Gregorius Satia Budhi, and Agustinus Darmawan Andilolo
Lecturers and Students Technology Readiness in Implementing Services Delivery of Academic Information System in Higher Education
Institution: A Case Study. . . 539
Rorim Panday and John Tampil Purba
Tool Support for Cascading Style Sheets’ Complexity Metrics. . . 551
Adewole Adewumi, Onyeka Emebo, Sanjay Misra, and Luis Fernandez
Intelligent Systems for Enterprise, Government and
Society
Generic Quantitative Assessment Model for Enterprise Resource
Planning (ERP) System . . . 563
XXIV Contents
The Implementation of Customer Relationship Management:
Case Study from the Indonesia Retail Industry . . . 572
Leo Willyanto Santoso, Yusak Kurniawan, and Ibnu Gunawan
The Implementation of Customer Relationship Management and Its Impact on Customer Satisfaction, Case Study on General Trading and
Contractor Company. . . 579
Djoni Haryadi Setiabudi, Vennytha Lengkong, and Silvia Rostianingsih
Towards e-Healthcare Deployment in Nigeria: The Open Issues . . . 588
Jumoke Soyemi, Sanjay Misra, and Omoregbe Nicholas
Author Index
Multidimensional Fuzzy Association Rules for Developing
Decision Support System at Petra Christian University
Yulia1, Siget Wibisono2, Rolly Intan3
Petra Christian University
[email protected], [email protected], [email protected]
Abstract. Academic records of student candidates and students of Petra Chris-tian University (PCU) which have been stored so far have not been used to
gen-erate information. PCU’s top-level management needs a way to generate infor-mation from the records. The generated inforinfor-mation is expected to support the decision-making process of top-level management.
Before starting the application development, analysis and design of the student academic records and the needs of top-level management are done. The design stage produces a number of modeling that will be used to create the application. The final result of the development is an application that can generate infor-mation using multidimensional fuzzy association rules.
Keywords. Application, Data Mining, Decision Support System, Multidimen-sional Fuzzy Association Rules
1
Introduction
During this time, PCU has stored academic records of student candidates who enroll in PCU, such as math and english grades at their schools. In addition, after entering the university, PCU will save GPA of all students.
Academic records of student candidates and students that have been kept, have not been used to produce valuable information. PCU’s top-level management needs a way to generate information from the records. The generated information is expected to support the decision-making process of top-level management.
With academic records of student candidates and students, information can be generated in the form of relationship between students’ data using multidimensional fuzzy association rules. The students’ data that can be used are schools, math, and english grade in their schools, specialization (science, social, literature, etc.), GPA, faculty, majors, gender, religion, and batch. Therefore, PCU need a software that can generate information needed by top-level management related to academic records of student candidates and students.
2
Data Mining
Data mining is one of the most important steps of the knowledge discovery in da-tabases process. It is considered as significant subfield in knowledge management. Research in data mining continues growing in business and in learning organization
over coming decades[8]. Data mining is a process of extraction of useful information and patterns from huge data. It is also known as knowledge discovery process, knowledge mining from data, knowledge extraction or data /pattern analysis[9].
The development of Information Technology has generated great amount of data-bases and huge data in various areas. The research in datadata-bases and information tech-nology has resulted in approach to store and manipulate this precious data for further decision making. The important reason that attracted many attentions in information technology and the discovery of meaningful information from large collections of data industry towards field of “Data mining” is due to the perception of “we are data rich but information poor”. There is huge volume of data but we hardly able to gener-ate them in to meaningful information and knowledge for decision making process in business[10].
Data mining derives its name from the similarities between finding valuable busi-ness information in a large database for example, finding linked products in gigabytes of store scanner data and mining a mountain for valuable ore. Both processes require either sifting through a great amount of material, and intelligently probing it to find exactly where the value resides. Given databases of sufficient size and quality, data mining technology can generate new business advantages and opportunities[10].
3
Multidimensional Association Rules
Association rule finds interesting association or correlation relationship among a large data set of items [1,2]. The discovery of interesting association rules can support decision making process.
Multidimensional association rules are association rules that involve two or more dimensions or predicates. Conceptually, a multidimensional association rule,A B
consists of A and B as two datasets, called premise and conclusion, respectively. Formally, A is a dataset consisting of several distinct data, where each data value in A is taken from a distinct domain attribute in D as given by
}
N
some
for
,
|
{
a
ja
jD
jj
nA
,
where,
D
AD
is a set of domain attributes in which all data values of A come from.Similarly,
}
N
some
for
,
|
{
b
jb
jD
jj
nB
,
where,
D
BD
is a set of domain attributes in which all data values of B come from.For example, database of medical track record patients is analyzed for finding association (correlation) among diseases taken from the data of complicated several diseases suffered by patients in a certain time. Additional related information regarding the identity of patients, such as age, occupation, sex, address, blood type, etc., may have a correlation to the illness of patients. Considering each data attribute
as a predicate, it can therefore be interesting to mine association rules containing multiple predicates, such as:
Rule-1: ), Cancer" Lung " , ( ) yes" " , ( ) "60" ,
(X Smk X DisX
Age
where there are three predicates, namely Age, Smk (smoking) and Dis (disease). Association rules that involve two or more dimensions or predicates can be referred to as multidimensional association rules.
From Rule-1, it can be found that A={60, yes}, B={Lung Cancer}, DA={age, smoking} and DB={disease}.
Considering
A
B
is an interdimension association rule, it can be proved that || |
|DA A , |DB| |B| and DA DB . Support of A is then defined by:
r
A
a
a
d
t
A
)
|
{
i|
ij j,
j}
|
supp(
(1)where r is the number of records or tuples (see Table 1, r=12).
Alternatively, r in (1) may be changed to |Q(DA)| by assuming that records or tuples, involved in the process of mining association rules are records in which data values of a certain set of domain attributes, DA, are not null data. Hence, (1) can be also defined by:
|
)
(
|
|
}
,
|
{
|
)
supp(
A j j ij iD
Q
A
a
a
d
t
A
(2)where Q(DA), simply called qualified data of DA, is defined as a set of record numbers (ti) in which all data values of domain attributes in DA are not null data. Formally, Q(DA) is defined as follows.
}
,
|
{
)
(
D
At
id
ijnull
D
jD
AQ
(3)Similarly,
|
)
(
|
|
}
,
|
{
|
)
supp(
B j j ij iD
Q
B
b
b
d
t
B
. (4)Similarly, support(A B) is given by
|
)
(
|
|
}
,
|
{
|
)
supp(
)
supp(
B A j j ij iD
D
Q
B
A
c
c
d
t
B
A
B
A
, (5)
where
Q
(
D
AD
B)
{
t
i|
d
ijnull
,
D
jD
AD
B}
conf(A B)as a measure of certainty to assess the validity of A Bis calculated by|
}
,
|
{
|
|
}
,
|
{
|
)
(
conf
A
a
a
d
t
B
A
c
c
d
t
B
A
j j ij i j j ij i (6)A and B in the previous discussion are datasets in which each element of A and B is an atomic crisp value. To provide a generalized multidimensional association rules, instead of an atomic crisp value, we may consider each element of the datasets to be a
dataset of a certain domain attribute. Hence, A and B are sets of set of data values or sets of datasets. For example, the rule may be represented by
Rule-2: ), cancer" lung , bronchitis " , ( ) yes" " , ( ) "20...60" , ( X disease X smoking X age
where A={{20…60}, {yes}} and B={{bronchitis, lung cancer}}. Simply, let A be a generalized dataset. Formally, A is given by
A
{
A
j|
A
jD
j,
for
some
j
N
n}
. Corresponding to (2), support of A is then defined by:|
)
(
|
|
}
,
|
{
|
)
supp(
A j j ij iD
Q
A
A
A
d
t
A
. (7)Similar to (5),
| ) ( | | } , | { | ) supp( ) supp( B A j j ij i D D Q B A C C d t B A B A (8)
Finally, conf(A B) is defined by
| } , | { | | } , | { | ) ( conf A A A d t B A C C d t B A j j ij i j j ij i (9)
To provide a more meaningful association rule, it is necessary to utilize fuzzy sets over a given database attribute called fuzzy association rule as discussed in [4,5]. Formally, given a crisp domain D, any arbitrary fuzzy set (say, fuzzy set A) is defined by a membership function of the form [2,3]:
A : D
→
[0,1]. (10)To provide a more generalized multidimensional association rules, we may consider A and B as sets of fuzzy labels[6]. Simply, A and B are called fuzzy datasets. Rule-2 is an example of such rules, where A={young, yes} and B={bronchitis}. Here young, yes and bronchitis are considered as fuzzy lables. A fuzzy dataset is a set of fuzzy lables/ data consisting of several distinct fuzzy labels, where each fuzzy label is represented by a fuzzy set on a certain domain attribute. Let A be a fuzzy dataset. Formally, A is given by
A
{
A
j|
A
jF(
D
j),
for
some
j
N
n}
,where
F(
D
j)
is a fuzzy power set of Dj, or in other words, Aj is a fuzzy set on Dj. Corresponding to (7), support of A is then defined by:|
)
(
|
)}
(
{
inf
)
supp(
1 A r i ij A A AD
Q
d
A
j j. (11)
Similar to (5),
|
)
(
|
)}
(
{
inf
)
supp(
)
supp(
1 B A r i ij C B A CD
D
Q
d
B
A
B
A
j j (12) ) (conf A B is defined by
r i ij A A A r i ij C B A C
d
d
B
A
j j j j 1 1)}
(
{
inf
)}
(
{
inf
)
(
conf
(13)The correlation betwen two fuzzy datasets can be defined by the following definition. r i ik B B B ij A A A r i ij C B A C d d d B A k k j j j j 1 1 )} ( { inf )} ( { inf )} ( { inf ) ( corr (14)
4
Research Methodology
4.1 Problems Analysis
There are several problems faced by PCU, such as:
1. PCU’s top-level management takes decisions for the promotion or cooperation purpose based solely on estimates and habits, has not taken advantage of the exist-ing academic records.
2. PCU’s Faculties/Majors Promotion Team has not equipped with information or facts about the academic condition of PCU’s students while promoting facul-ties/majors to high schools.
3. There is no feature in the current academic information system that can show the relationship between students’ data.
4.2 Requirements Analysis
From the problems listed above, it can be concluded that the PCU’s top-level management requires a computer-based system to assist in generating PCU’s students academic records, that is a data mining-based information systems that can produce association rules of students’ attributes. This system obtains data from the ETL pro-cess and has a multidimensional concept that shows the relationships between stu-dents’ attributes. The dimensions used are schools, math and english grade in their schools, specialization (science, social, literature, etc.), GPA, faculty, majors, gender, religion, and batch.
4.3 Extract, Transform, and Load
Extract, Transform, and Load (ETL) is a function that integrates data and involves extracting data from sources, transforming it to be more valid, and loading it into a data warehouse[7]. This process begins by importing the data from the database. The imported data is religions, majors, schools, specializations, student candidates, stu-dents, and student admissions. Next, the imported data is transformed into more valid data and loaded into data warehouse.
4.4 Determination of Fuzzy Values
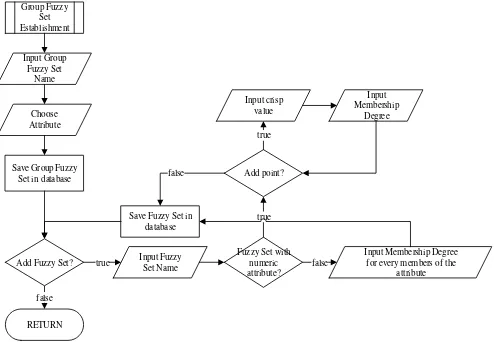
Determination of fuzzy values is done by establishing a group fuzzy set. First, user must input the name and choose the attribute, such as religions, majors, schools, GPA, math grade, etc. Next, user can make as many fuzzy sets as he/she wants inside the group fuzzy set made. User need to fill the name and the description of the fuzzy set. There are two types of fuzzy set based on the attribute of the group fuzzy set, numeri-cal and non-numerinumeri-cal. For numerinumeri-cal, user can input as many points as he/she wants to form fuzzy membership function. A point includes crisp value and the membership degree of the crisp value to the fuzzy set. For non-numerical, user must input mem-bership degree for every members of the attribute. Flowchart for determination of fuzzy values can be seen on Figure 1.
Group Fuzzy Set Establishment
Input Group Fuzzy Set
Name
Choose Attribute
Save Group Fuzzy Set in database
RETURN false
Add Fuzzy Set? true Input Fuzzy Set Name
Fuzzy Set with numeric attribute?
Input Membership Degree for every members of the
attribute false
Add point?
true Save Fuzzy Set in
database false
Input crisp value
Input Membership
Degree true
Fig. 1. Flowchart for Determination of Fuzzy Values
4.5 Customization of Fuzzy Association Rules
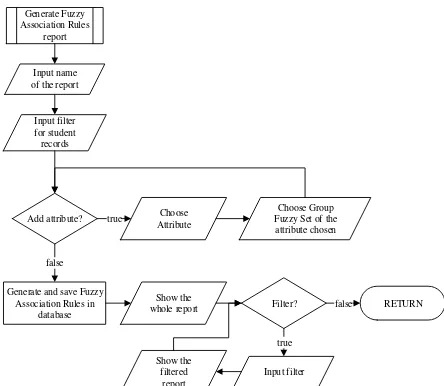
Customization of fuzzy association rules is done to generate fuzzy association rules report to support the decision-making process of top-level management. First, user must input the name and choose the attributes that will be used to generate the rules. After choosing the attributes, user must choose the group fuzzy set(s) of the attributes. Next, the application will generate the rules and save them in database. The
user can see the whole report and filter the rules based on the support, confidence, and correlation value of the rules. Flowchart for customization of fuzzy association rules can be seen on Figure 2.
Generate Fuzzy Association Rules
report
Add attribute? AttributeChoose
Choose Group Fuzzy Set of the attribute chosen true
Generate and save Fuzzy Association Rules in
database false
Input filter Show the
whole report RETURN Input name
of the report Input filter for student records
Show the filtered
report
Filter? true
false
Fig. 2. Flowchart for Fuzzy Association Rules
5
Results
A test is conducted to prove the accuracy of the developed application to calculate support, confidence, and correlation of the multidimensional fuzzy association rules generated. The test is started from a given simple academic records of students with three attributes, such as major, math grade, Grade Point Average (GPA) as shown in Table 1.
Table 1. Academic Records of Students
Student Major Math grade GPA
1 English Literature 74 3.34
2 Civil Engineering 75 3.41
3 Civil Engineering 90 3.9
4 Interior Design 86 3.75
5 Interior Design 78 3.45
6 Business Management 76 3.23
7 Business Management 68 3.35
8 Business Management 89 3.56
9 Informatics Engineering 91 3.84
10 Informatics Engineering 71 3.01
11 Science Communication 79 2.71
12 Science Communication 76 3.03
The test is conducted using three attributes, such as major, math grade, and GPA. First, we must determine how to convert each crisp value into fuzzy value for every attributes. Major is a non-numerical attribute, so we must determine the fuzzy value for each major. For example, we make a group fuzzy set for major named 2014 which has a fuzzy set named Engineering. Inside this fuzzy set, we determine business man-agement has a membership degree of 0.2, civil engineering has a membership degree of 1, and so on as shown on Figure 3.
Fig. 3. Input for Major Fuzzy Values
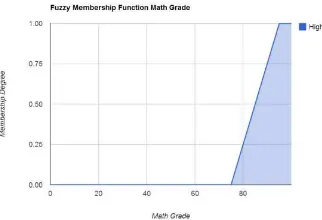
Math grade is a numerical attribute, so that the fuzzy value of math grade will be calculated through a fuzzy membership function which is formed from the points stored in the fuzzy set. For example, we make a group fuzzy set for math grade named 2014 which has a fuzzy set named High. Inside this fuzzy set, we determine math grade of 0 has a membership degree of 0, math grade of 75 has a membership degree of 0, math grade of 95 has a membership degree of 1, and math grade of 100 has a membership degree of 1 as shown on Figure 4.
Fig. 4. Input for Math Grade Fuzzy Membership Function
These four points will form fuzzy membership function as shown on Figure 5.
Fig. 5. Visualization of Math Grade Fuzzy Membership Function
For example, if a student has math grade of 90, then the application will look for its membership degree through the equation of the line that formed the point (75, 0) and (95, 1), as given by y = { x | 0.05x - 3.75, for 75≤ x ≤95}. Thus, membership degree of 90 is 0.05 * 90 - 3.75 = 0.75.
GPA is a numerical attribute like the math grade, so that the fuzzy value of GPA will also be calculated through a fuzzy membership function. For example, we make a group fuzzy set for GPA named 2014 which has a fuzzy set named High. Inside this fuzzy set, we determine points, such as (0, 0), (3.2, 0), (3.4, 0.6), (3.7, 1), and (4, 1) as shown on Figure 6.
Fig. 6. Input for GPA Fuzzy Membership Function
This example of engineering fuzzy set for major attribute, high math grade fuzzy membership function, and high GPA fuzzy membership function are determined by interviewing one of PCU’s structural officers. Next, we choose the attributes that are used during this test and each attribute’s group fuzzy set that we just made before as shown on Figure 7.
Fig. 7. Input Attributes for Fuzzy Association Rules
This test will generate all combinations of fuzzy association rules using every fuzzy sets of the attributes chosen. For example, one of the rules may be represented by:
Rule-3:
Major(X, ”Engineering”) ˄ Math(X, ”high”) ⇒GPA(X, ”high”)
Rule-3 is a fuzzy rule, where A={Engineering, high} and B={high}. Next, each academic records of students shown in Table 1 will be converted using the fuzzy sets to fuzzy values as shown in Table 2.
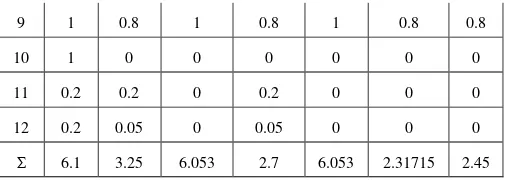
Table 2. Calculation of Fuzzy Values
α β ɣ X Y X*Y Z
1 0.1 0 0.42 0 0.42 0 0
2 1 0 0.613 0 0.613 0 0
3 1 0.75 1 0.75 1 0.75 0.75
4 0.5 0.55 1 0.5 1 0.5 0.5
5 0.5 0.15 0.667 0.15 0.667 0.10005 0.15
6 0.2 0.05 0.09 0.05 0.09 0.0045 0.05
7 0.2 0 0.45 0 0.45 0 0
8 0.2 0.7 0.813 0.2 0.813 0.1626 0.2
Note:
α = µengineering (major) β = µhigh (math)
ɣ = µhigh (GPA) X = min(α,β) Y = min(ɣ) Z = min(α,β,ɣ)
9 1 0.8 1 0.8 1 0.8 0.8
10 1 0 0 0 0 0 0
11 0.2 0.2 0 0.2 0 0 0
12 0.2 0.05 0 0.05 0 0 0
Σ 6.1 3.25 6.053 2.7 6.053 2.31715 2.45
Therefore, support of Rule-3 can be calculated by (12), supp(Rule-3) = 2.45 / 12 = 0.20417
On the other hand, confidence of Rule-3 can be calculated by (13), conf(Rule-3) = 2.45 / 2.7 = 0.90741
On the other hand, correlation of Rule-3 can be calculated by (14), corr(Rule-3) = 2.45 / 2.31715 = 1.05733
The manually calculated support, confidence, and correlation of Rule-3 are match with the output of the fuzzy association rules generated by this test as shown on Fig-ure 8.
Fig. 8. Example Output of Fuzzy Association Rules
To evaluate this application, research on the use of this application is conducted. Samples of this research is five structural officers of PCU. To collect the data, distrib-uted a questionnaire containing indicators to evaluate the use of the application. The indicators include display of application, determination of fuzzy values, customization of fuzzy association rules, ease of use, the ability to address the needs of users, and overall. From the data collected, the calculation of the percentage of user satisfaction in using this application is done.
Assessment of the feasibility of the application: 1. Display of application is 100% good 2. Determination of fuzzy values is 80% good
3. Customization of fuzzy association rules is 80% good 4. Ease of use is 100% good
5. The ability to address the needs of users is 60% good 6. Overall is 100% good
6
Conclusion
The generated fuzzy association rules have been tested and matched with the Multidimensional Fuzzy Association Rules algorithm and the reality of academic situation of PCU’s students. From the assessment, obtained that overall application is 100% good. This suggests that the application developed has benefits for PCU and
can be continued for the purpose of decision-making process by top-level manage-ment.
References
1. Han, J., Kamber, M., Pei, J.: Data mining: Concepts and Techniques (3rd ed.). Morgan
Kaufmann, San Fransisco (2012)
2. Klir, G. J., Yuan, B.: Fuzzy Sets and Fuzzy Logic: Theory and Applications. Prentice Hall, New Jersey (1995)
3. Zadeh, L. A.: Fuzzy Sets and Systems. In: International Journal of General Systems, Vol. 17, pp. 129-138 (1990)
4. Intan, R.: A Proposal of Fuzzy Multidimensional Association Rules, Jurnal Informatika Vol. 7 No. 2 (2006)
5. Intan, R.: A Proposal of an Algorithm for Generating Fuzzy Association Rule Mining in Market Basket Analysis. In: Proceeding of CIRAS (IEEE). Singapore (2005)
6. Intan, R.: Hybrid-Multidimensional Fuzzy Association Rules from a Normalized Database. In: Proceedings of International Conference on Convergence and Hybrid Information Technology. IEEE Computer Society, Daejeon, Korea (2008)
7. Gour, V., Sarangdevot, S. S., Tanwar, G. S., Sharma, A.: Improve Performance of Extract, Transform and Load (ETL) in Data Warehouse. In: International Journal on Computer Sci-ence and Engineering, 2(3), 786-789 (2010)
8. Silwattananusarn, T., Tuamsuk, K.: Data Mining and Its Applications for Knowledge Man-agement: A Literature Review from 2007 to 2012. In: International Journal of Data Mining & Knowledge Management Process (IJDKP), 2(5), 13-24 (2012)
9. Ramageri, B. M.: Data Mining Techniques and Applications. In: Indian Journal of Comput-er Science and EngineComput-ering, 1(4), 301-305 (2010)
10.Padhy, N., Mishra, P., Panigrahi R.: The Survey of Data Mining Applications and Feature Scope. In: International Journal of Computer Science, Engineering and Information Tech-nology (IJCSEIT), 2(3), 43-58 (2012)