347
Ag
+ION IMPLANTATION ON GLASSY ELECTROLYTE AgPO
3W. Honggowiranto, E. Kartini, E. Panjaitan, T. Nugraha, M. Ihsan
Center for Technology of Nuclear Industry Materials (PTBIN) National Nuclear Energy Agency (BATAN)
Kawasan PUSPIPTEK Gd 71, Serpong Tangerang - Indonesia e-mail: [email protected]
ABSTRACT
Ion implantation can be utilized to improve the performance of solid electrolyte for battery. The glassy solid electrolyte AgPO3 substrates were implanted with Ag+ ions at 100 keV with a current of 15 μA. The durations of implantation were varied at 1, 2, 3, 4, and 5 hours which were equivalent with doses of 2.68×10¹⁶, 5.36×10¹⁶, 8.05×10¹⁶, 1.07×10¹⁷ and 1.34×10¹⁷ ions/cm2 respectively. The changes in the microstructures of the AgPO3 were studied using Scanning Electron Microscopy (SEM), while the elemental compositions were investigated by using Energy Dispersive X-ray Spectrometry (EDS). The microstructures before the implant showed relatively homogeneous structure, although there appeared to be two different main structures that composed the
AgPO3 solid electrolyte. The size of the granules was found to be in the region of 35
μm. After the implant processes at 1, 2 and 3 hours, the general appearance seemed to be the same but with an increase in porosity at longer implantation time. For time of implantation of 4 and 5 hours, the grain size decrease dramatically with substantial increase in porosity. The grain size decreased to approximately 5 μm. The EDS analysis also showed that there were variations in the elemental composition before and after the implantation process. Moreover, the composition also found to be inhomogeneous, following 3 hours or more of implantation time, XRD results show the appearance of new crystalline peaks. More ever, after 5 hours of implantation, the conductivity appeared to have increased substantially
Keywords: Ion Implantation, AgPO3, SEM, EDS, XRD
INTRODUCTION
Superionic conducting glasses are interesting for both scientific and applications point of view. The superionic properties which include high ionic conductivity at low temperature, has strong potential application for various solid electrolyte applications including batteries, sensors, fuel cell, displays, etc. The silver phosphate glass, AgPO3, is one of the most well studied superionic-based glass. Doping of silver phosphate (AgPO3) glasses with metal halides, alkali-oxy salt and other glass formers strongly enhances ionic conductivity [1,2].
348
increasing its conductivity. This research aimed to obtain the optimal parameters of implantation process Ag+ ion on the AgPO3 solid electrolyte to improve its ionic conductivity .
EXPERIMENTAL
Silver ion implantation process was performed with ion implantation device located at the Center for Technology Accelerator and Material Process (PTAPB) - BATAN Yogyakarta, Indonesia. The experiment was carried out under vacuum that was be stable at, at least, 2.710-5 Torr. In this experiment Ag + ions were implanted in the target of AgPO3 at energy and ion current that were fixed at 100 keV and 15 μA. Time of implantation was varied in a row, 1 hour, 2 hour, 3 hour, 41 hour and 5 hour or equivalent with ion dose of 2.68 ×10 16 ions/ cm2 , 5.36×10 16 ions/ cm2, 8.04 ×10 16 ions/ cm2, 1.07 ×10 17 ions/ cm2, and 1.37 ×10 17 ions/ cm2.
The untreated and implanted samples were analyzed by Scanning Electron Microscopy technique,coupled with Energy Dispersive X-Ray Spectroscopy (SEM/EDS JEOL type JSM-6510 LA) at an accelerating voltage of 20 keV, and X-ray diffraction and Multimeter Keithey type 2001.
RESULTS AND DISCUSION
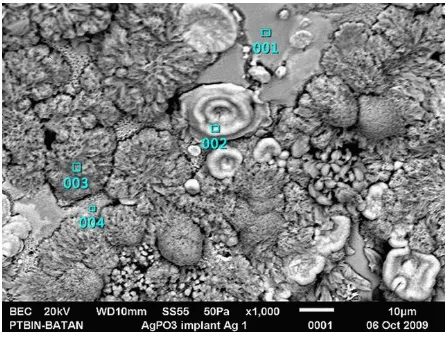
Pellet of AgPO3 as compaction result, that was characterized by SEM is shown in Figure 1. The microstructures before the implant showed relatively homogeneous structure, although there appeared to be two different main structures that was composed of the AgPO3 solid electrolyte. The size of the granules was found to be in the region of 35 μm.
Figure1: Microstructural of electrolyte AgPO3 non implant (untreated)
349 Figure 2 shows Pellet of AgPO3 after implantation of Ag+ ions for 1 hour at equivalent dose of 2.6 × 10¹⁶ ions /cm2 . The results shows the grain size reduction to implantation for 2 hours, 3 hours and 4 hours (Figure 3, 4 and 5). This is possible because of too high energy implantation of 100 keV, resulting in heating (remelting) of the material and, hence, newly grown grains are smaller. However, Ag content results were also not uniform because of the initial sample that was also not uniform.
Figure 2: Microstructural of electrolyte AgPO3 after implantation of Ag+ ion at dose 2.6×10¹⁶ ions/ cm2
Figure 3: Microstructural of electrolyte AgPO3 after implantation of Ag+ ion at dose 5.36 ×10¹⁶ ions/ cm2
350
Figure 5: Microstructural of electrolyte AgPO3after implantation of Ag+ ion at dose 1.07 ×10¹⁷ ions/ cm2
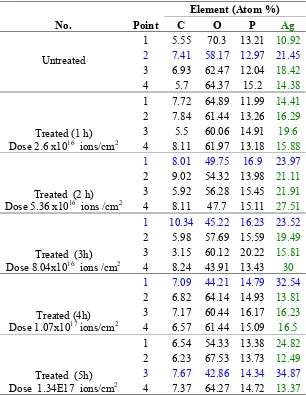
Tabel 1: Composition of Untreated and Treated Samples
No. Point
351 scattered more. Ag content after implantation for 1 hour, 2hours, 3 hours and 4 hours, were 16.54% atom, 23.62% atom, 22.2% atom and 15.57% atom. This content showed the inhomogeneous nature similar to untreated sample.
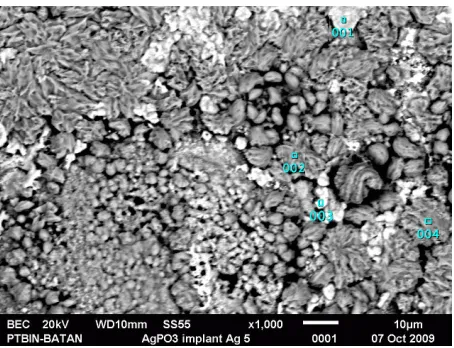
Pellet of AgPO3 after implantation of Ag + ions for 5 hours at equivalent dose of 1.34 × 10¹⁷ ions /cm2 is shown in Figure 6. The grain size decreased to approximately 5 μm. This was possible due to higher temperature of the samples that occurred during the 5 hours implantation compared to 4 hours or less time of implantation. Hence, after the implantation, the samples that was 1 cm diameter and 0.2 cm thick, might have suffered rapid cooling effects similar to the quenching effects due the severe temperature difference between the surface and the surrounding temperature. The chemical composition at point (3) with white grain showed the greatest content of Ag that was 34.87% atomic, although the average based on 4 points observation, showed content of Ag at 18.05% atom. The low content of Ag is due to Ag atoms that have diffused deeper due to the results of remelting.
Figure 6: Microstructural of electrolyte AgPO3 after implantation of Ag+ ion at dose 1.34 ×10¹⁷ ions/cm2
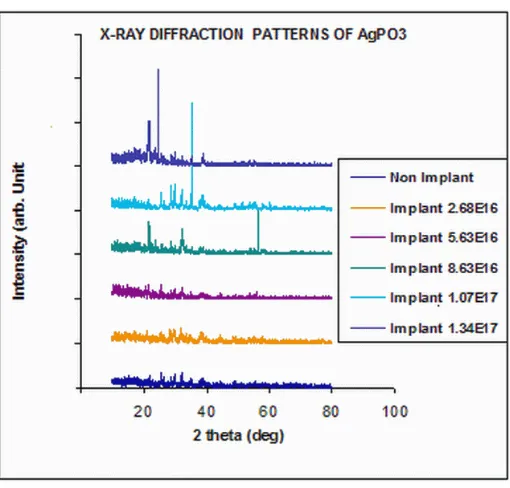
Figure 7 shows the diffraction patterns of AgPO3 electrolyte before and after Ag+ ion implantation for 1 hour, 2 hours, 3 hours, 4 hours and 5 hours. The figures showed that at longer time of implantation (high dose implantation), the materials tend to become more crystalline. This was shown by the higher and sharper peaks, despite the tendency of changes towards the crystalline direction, although it still showed a pattern of AgPO3. For untreated sample, the diffraction peak occurs at 2 theta angle and the plane (hkl) of 26.28(301); 29.13 (112) and 34.35 (411). For 1hour (dose 2.6 × 10¹⁶ ions /cm2) the diffraction peak occurs at 2 theta angle and the plane (hkl) of 26.11(301); 29.12 (112), 30.19 (400) and 32.22 (121). For 2 hour (dose 5.36 × 10¹⁶ ions / cm2) the diffraction peak occurs at 2 theta angle and the plane (hkl) of 20.22(111); 21.22 (210), 29.21 (321), 30.19 (400) and 32.22 (121). For 3 hour (dose 8.04 ×10¹⁶ ions/ cm2) the diffraction peak occurs at 2 theta angle and the plane (hkl) of 24.32 (002); 26, 31 (310); and 29.21 (321). For 4 hour (dose 1.07 ×10¹⁷ ions/ cm2) the diffraction peak occurs at 2 theta angle and the plane (hkl) of 24.41 (210); 26. 44 (301); 29.45 (020); 30.45 (311) dan 35.64 (221). For 5 hour (dose 1.34 ×10¹⁷ ions/ cm2) the diffraction peak occurs at 2 theta angle and the plane (hkl) of 24.72 (002); 24.72 (211); 26.52 (301); and 29.51 (311).
352
Figure 7: Diffraction patterns of electrolyte AgPO3 before and after implantation Ag+ ion
Figure 8 shows the untreated and treated AgPO3 conductivity that was measured using a DC Multimeter merk Keithley, series 2001. Each sample was measured on two sides of the implant and the unimplanted sides. The results are shown in Fig.1. The significant conductivity increase was observed at doses of 1.34 ×10¹⁷ ions /cm2, i.e. from 2.4 μS/cm to 3.2μS/cm. This increase was not high enough, and would be better if implantation was performed on a thin layer, and with lower energy, considering the penetrating power of the implanted atoms is typically only below 1 μm.
Figure 8: Conductivity curve of electrolyte AgPO3 before and after implantation Ag+ ion.
CONCLUSION
353 The conductivity was increased dramatically after implantation of 5 hours, and the phase changes from amorphous to crystalline structure was also observed
REFERENCES
[1]. M. Nakamura, M. Arai, Y. Inamura and E. Kartini, Novel Dynamics of Superionic Conducting Glasses Proved by Inelastic Neutron Scattering, J. Phys. Soc. Jpn. 79 (2010) Suppl.A, pp. 122-124.
[2]. S. Kennedy, R. Magaraggia, E. Kartini, Structural Model of Model Conducting Glasses by a Reverse Monte Carlo Analysis, International Conference on Advances in Nuclear Science and Engineering in Conjunction with LKSTN 2007 (339-344)
[3]. M. Ghorannevss, A.H. SaRI, D.Dorranian, P. Khorshid, G.H. Hajihosseni, A. Shokouhy and M.Hesabi, J.Plasma Fusion Res.Series, Vol.7 (2006) 303-306
[4]. Wagiyo H., , E. Kartini, E. Panjaitan, M. Ihsan, T.Nugraha, Microstructural Analysis of Solid Electrolyte Battery AgPO3 by Ion Implantation, 7th Asean Microscopy Conference, Bali-Indonesia (2009).
[5]. Wagiyo H., E. Kartini, Elman P., M. Ihsan, Tutun N., Tjipto S., Implantasi Ion Ag pada Bahan Elektrolit Padat LiPO3, ” Jurnal Sains Materi Indonesia, Edisi Khusus Desember 2009, hal.167-171, ISSN : 1411 – 1098.
[6]. E. Kartini, Superionic Glasses:Research and Development of New Solid Electrolyte for Rechargeable Battery, Proceedings The 2007 Conference on Solid State Ionics, 2007.
[7]. Elman Panjaitan, Evvy Kartini, Wagiyo, Tutun Nugraha, Microstructure Analysis of LiCoO2 Thin Film for Li Battery Cathode Developed Using DC Sputtering Technique, 7th Asean Microscopy Conference, Bali-Indonesia (2009)