Lampiran 1. Kuesioner Penelitian
No. Responden :……..
KUESIONER PENELITIAN
Selamat pagi/siang/sore , sebelumnya saya ucapkan terima kasih atas partisipasi saudara dalam membantu mengisi kuisioner ini dengan baik dan benar. Kuesioner ini digunakan sebagai bahan untuk penyusunan skripsi mengenai : ANALISIS PENGARUH BAURAN
PEMASARAN JASA TERHADAP
BRAND IMAGE
PADA LEMBAGA
PENDIDIKAN BAHASA INGGRIS ILP (INTERNATIONAL LANGUAGE
PROGRAMS) CABANG BOGOR
Oleh Didit Setiadi Departemen Manajemen Fakultas Ekonomi dan Manajemen
Institut Pertanian Bogor
Petunjuk : Isilah/ berilah tanda silang (X) pada jawaban yang anda pilih dan pada tempat yang anda sediakan.
Bagian I Screening
1. Apakah anda pernah kursus bahasa Inggris di ILP Bogor?
a. Ya b. Tidak (STOP, terima kasih atas partisipasi anda) 2. Apakah anda berusia 17 tahun atau lebih?
a. Ya b. Tidak (STOP, terima kasih atas partisipasi anda) 3. Apakah anda atau salah satu anggota keluarga anda ada yang bekerja di ILP?
a. Ya (STOP, terima kasih atas partisipasi anda) b. Tidak
3. Apakah anda telah kursus di ILP selam 1 term (3 bulan)?
a. Ya, b. Tidak (STOP, terima kasih atas partisipasi anda) Bagian II Demografi
IDENTITAS KONSUMEN
Nama : ………..
Alamat : ………... Umur dan Jenis Kelamin : ………. Tahun (L/P)
Pendidikan terakhir : a. SMA / sederajat b. Diploma / sederajat c. Sarjana / sederajat d. Pascasarjana / sederajat Jenis Pekerjaan :
a. Pelajar b. Mahasiswa c. PNS d. Pegawai swasta / BUMN e. lainnya :…….. Jumlah pengeluaran rata - rata Anda setiap bulannya :
a. < Rp 300.000 d. > Rp 1.500.000 b. Rp 300.000 – Rp 800.000
c. Rp 800.000 – Rp 1.500.000 ASPEK PENGALAMAN KONSUMEN 1. Berapa lama anda telah mengikuti kursus di ILP :
Lanjutan Lampiran 1
2. Saat ini anda berada pada level :a. foundation b. Basic c. intermediate d. PIES e. AES
f. FCE g. CAE h. TP i. TE
3. Menurut anda, apa aspek yang paling penting dari lembaga kursus bahasa Inggris? a. Materi yang up to date
b. Biaya kursus yang terjangkau c. Lokasi yang strategis d. Iklan/ promosinya e. Tempat yang nyaman f. Pengajar yang berkualitas g. Metode Pengajaran
4. Siapa yang membiayai kursus anda di ILP: a. orang tua / wali
b. perusahaan c. sendiri d. pihak lainnya
Petunjuk : Berilah tanda (√) pada jawaban yang paling sesuai menurut anda SS = Sangat Setuju S = Setuju BS = Biasa Saja
TS = Tidak Setuju STS = Sangat Tidak Setuju Produk
No Pernyataan SS S BS TS STS
A1 program pendidikan bahasa Inggris yang ada di ILP berkualitas A2 ILP adalah nama merek yang bagus
serta mudah diingat
A3 semua jasa yang diberikan oleh ILP dapat menjamin bahwa murid ILP dapat berbahasa Inggris dengan baik A4 fasilitas belajar di ILP sudah
lengkap
Harga
No Pernyataan SS S BS TS STS
B1 Biaya kursus bahasa Inggris di ILP sudah sesuai dengan kualitas yang diberikan
B2 ILP sering memberikan Diskon dan penawaran khusus
Citra tempat
No Pernyataan SS S BS TS STS
C1 Lokasi ILP sudah strategis C2 Lokasi ILP mudah di akses
Lanjutan Lampiran 1
Intensitas IklanNo Pernyataan SS S BS TS STS
D1 D11 - Saya sering melihat iklan ILP di TV D12 - Saya sering mendengar iklan ILP di Radio
D13 - Saya sering melihat iklan ILP di iklan media cetak
D14 - Saya sering melihat iklan ILP di Billboard (papan reklame)
D2 D21 - ILP sering mengadakan tes TOEFL secara gratis
D22 - ILP mengadakan promosi dengan menjadi sponsor kegiatan tertentu
D23 - ILP sering mengadakan event/ kegiatan menarik
Proses
No Pernyataan SS S BS TS STS
E1 Prosedur pengajaran di ILP sudah baik E2 Keterlibatan murid dalam pelajaran di kelas
sangat diutamakan
E3 Urutan aktivitas proses pelayanan selama kursus telah tepat waktu
Lingkungan Fisik
No Pernyataan SS S BS TS STS
F1 F11 - Tata ruang ILP secara keseluruhan sudah baik F12 – tempat menunggu di ILP sudah nyaman
F13 – parkiran untuk kendaraan yang luas
F14 – toilet di ILP selalu bersih dan terawatt
F2 F21 – pencahayaan ketika sedang belajar di kelas sudah baik F22 – pengharum ruangan selalu disemprotkan ketika pelajaran akan dimulai
F23 – tata letak tempat duduk dan meja selalu rapih ketika pelajaran akan dimulai
F24 – kebersihan kelas selalu terjaga ketika pelajaran akan dimulai
F25 – penyejuk ruangan (AC) selalu berfungsi dengan baik
Lanjutan Lampiran 1
F3 Perabotan serta peralatan di ILP selalu tertata rapih dan teratur F4 Tingkat kebisingan ketika belajar
sangat rendah
F5 Toilet di ILP selalu bersih dan terawatt
Karyawan dan Staf Pengajar
No Pernyataan SS S BS TS STS
G1 Penampilan karyawan ILP sudah baik dan rapih
G2 Karyawan ILP dapat merespon dengan cepat dan tepat ketika ada pertanyaan dan keluhan
G3 Karyawan ILP memiliki sikap yang baik
G4 Kemampuan Staf pengajar di ILP sudah berkualitas
G5 Karyawan ILP memiliki perhatian tinggi apabila ada pertanyaan dan keluhan
Citra Merek
No Pernyataan SS S BS TS STS
H1 ILP merupaka tempat kursus yang lebih terkenal dibandingkan tempat kursus lainnya
H2 ILP memberikan pelayanan yang menyenangkan dan menarik H3 ILP sangat memberikan manfaat
Lampiran 2. Output SPSS Uji Validitas dan Reliabilitas
Produk Correlations A1 A2 A3 A4 Jumlah A1 Pearson Correlation 1 .478** .494** .337* .645** Sig. (1-tailed) .004 .003 .034 .000 N 30 30 30 30 30 A2 Pearson Correlation .478** 1 .760**.617** .890** Sig. (1-tailed) .004 .000 .000 .000 N 30 30 30 30 30 A3 Pearson Correlation .494** .760** 1 .663** .910** Sig. (1-tailed) .003 .000 .000 .000 N 30 30 30 30 30 A4 Pearson Correlation .337* .617** .663** 1 .814** Sig. (1-tailed) .034 .000 .000 .000 N 30 30 30 30 30Jumlah Pearson Correlation .645** .890** .910**.814** 1 Sig. (1-tailed) .000 .000 .000 .000
N 30 30 30 30 30
**. Correlation is significant at the 0.01 level (1-tailed). *. Correlation is significant at the 0.05 level (1-tailed).
Reliability Statistics Cronbach's Alpha N of Items
.838 4 HARGA Correlations B1 B2 jumlah B1 Pearson Correlation 1 .877** .967** Sig. (1-tailed) .000 .000 N 30 30 30 B2 Pearson Correlation .877** 1 .971** Sig. (1-tailed) .000 .000 N 30 30 30
Jumlah Pearson Correlation .967** .971** 1 Sig. (1-tailed) .000 .000
N 30 30 30
**. Correlation is significant at the 0.01 level (1-tailed).
Reliability Statistics Cronbach's Alpha N of Items
Lanjutan Lampiran 2
TEMPAT Correlations C1 C2 Jumlah C1 Pearson Correlation 1 .587** .870** Sig. (1-tailed) .000 .000 N 30 30 30 C2 Pearson Correlation .587** 1 .910** Sig. (1-tailed) .000 .000 N 30 30 30Jumlah Pearson Correlation .870** .910** 1 Sig. (1-tailed) .000 .000
N 30 30 30
**. Correlation is significant at the 0.01 level (1-tailed).
Reliability Statistics Cronbach's Alpha N of Items
.733 2 Iklan tahap 1 Correlations D11 D12 D13 D14 D21 D22 D23 Jumlah D11 Pearson Correlation 1 .500** .406*-.014 .551** .415* .292 .562** Sig. (2-tailed) .005 .026 .943 .002 .023 .118 .001 N 30 30 30 30 30 30 30 30 D12 Pearson Correlation .500** 1 .671** .125 .896**.665**.642** .842** Sig. (2-tailed) .005 .000 .509 .000 .000 .000 .000 N 30 30 30 30 30 30 30 30 D13 Pearson Correlation .406* .671** 1 .203 .667**.936**.899** .927** Sig. (2-tailed) .026 .000 .283 .000 .000 .000 .000 N 30 30 30 30 30 30 30 30 D14 Pearson Correlation -.014 .125 .203 1 .157 .054 .050 .278 Sig. (2-tailed) .943 .509 .283 .408 .775 .795 .136 N 30 30 30 30 30 30 30 30 D21 Pearson Correlation .551** .896** .667** .157 1 .698**.646** .862** Sig. (2-tailed) .002 .000 .000 .408 .000 .000 .000 N 30 30 30 30 30 30 30 30 D22 Pearson Correlation .415* .665** .936** .054 .698** 1 .939** .915** Sig. (2-tailed) .023 .000 .000 .775 .000 .000 .000 N 30 30 30 30 30 30 30 30 D23 Pearson Correlation .292 .642** .899** .050 .646**.939** 1 .875** Sig. (2-tailed) .118 .000 .000 .795 .000 .000 .000 N 30 30 30 30 30 30 30 30
Jumlah Pearson Correlation .562** .842** .927** .278 .862**.915**.875** 1 Sig. (2-tailed) .001 .000 .000 .136 .000 .000 .000
N 30 30 30 30 30 30 30 30
Correlations D11 D12 D13 D14 D21 D22 D23 Jumlah D11 Pearson Correlation 1 .500** .406*-.014 .551** .415* .292 .562** Sig. (2-tailed) .005 .026 .943 .002 .023 .118 .001 N 30 30 30 30 30 30 30 30 D12 Pearson Correlation .500** 1 .671** .125 .896**.665**.642** .842** Sig. (2-tailed) .005 .000 .509 .000 .000 .000 .000 N 30 30 30 30 30 30 30 30 D13 Pearson Correlation .406* .671** 1 .203 .667**.936**.899** .927** Sig. (2-tailed) .026 .000 .283 .000 .000 .000 .000 N 30 30 30 30 30 30 30 30 D14 Pearson Correlation -.014 .125 .203 1 .157 .054 .050 .278 Sig. (2-tailed) .943 .509 .283 .408 .775 .795 .136 N 30 30 30 30 30 30 30 30 D21 Pearson Correlation .551** .896** .667** .157 1 .698**.646** .862** Sig. (2-tailed) .002 .000 .000 .408 .000 .000 .000 N 30 30 30 30 30 30 30 30 D22 Pearson Correlation .415* .665** .936** .054 .698** 1 .939** .915** Sig. (2-tailed) .023 .000 .000 .775 .000 .000 .000 N 30 30 30 30 30 30 30 30 D23 Pearson Correlation .292 .642** .899** .050 .646**.939** 1 .875** Sig. (2-tailed) .118 .000 .000 .795 .000 .000 .000 N 30 30 30 30 30 30 30 30
Jumlah Pearson Correlation .562** .842** .927** .278 .862**.915**.875** 1 Sig. (2-tailed) .001 .000 .000 .136 .000 .000 .000
N 30 30 30 30 30 30 30 30
*. Correlation is significant at the 0.05 level (2-tailed).
Reliability Statistics Cronbach's Alpha N of Items
.882 7 Iklan Tahan 2 Correlations D11 D12 D13 D21 D22 D23 JUMLAH D11 Pearson Correlation 1 .500** .406*.551** .415* .292 .584** Sig. (2-tailed) .005 .026 .002 .023 .118 .001 N 30 30 30 30 30 30 30 D12 Pearson Correlation .500** 1 .671**.896**.665**.642** .849** Sig. (2-tailed) .005 .000 .000 .000 .000 .000 N 30 30 30 30 30 30 30 D13 Pearson Correlation .406* .671** 1 .667**.936**.899** .924** Sig. (2-tailed) .026 .000 .000 .000 .000 .000 N 30 30 30 30 30 30 30 D21 Pearson Correlation .551** .896**.667** 1 .698**.646** .864** Sig. (2-tailed) .002 .000 .000 .000 .000 .000 N 30 30 30 30 30 30 30
Lanjutan Lampiran 2
D22 Pearson Correlation .415* .665** .936**.698** 1 .939**.937** Sig. (2-tailed) .023 .000 .000 .000 .000 .000 N 30 30 30 30 30 30 30 D23 Pearson Correlation .292 .642** .899**.646**.939** 1 .896** Sig. (2-tailed) .118 .000 .000 .000 .000 .000 N 30 30 30 30 30 30 30JUMLAH Pearson Correlation .584** .849** .924**.864**.937**.896** 1 Sig. (2-tailed) .001 .000 .000 .000 .000 .000
N 30 30 30 30 30 30 30
**. Correlation is significant at the 0.01 level (2-tailed). *. Correlation is significant at the 0.05 level (2-tailed).
Reliability Statistics Cronbach's Alpha N of Items
.922 6 PROSES Correlations E1 E2 E3 jumlah E1 Pearson Correlation 1 .416* .412* .641** Sig. (2-tailed) .022 .024 .000 N 30 30 30 30 E2 Pearson Correlation .416* 1 .971** .958** Sig. (2-tailed) .022 .000 .000 N 30 30 30 30 E3 Pearson Correlation .412* .971** 1 .957** Sig. (2-tailed) .024 .000 .000 N 30 30 30 30
Jumlah Pearson Correlation .641** .958** .957** 1 Sig. (2-tailed) .000 .000 .000
N 30 30 30 30
*. Correlation is significant at the 0.05 level (2-tailed). **. Correlation is significant at the 0.01 level (2-tailed).
Reliability Statistics Cronbach's Alpha N of Items
Lanjutan Lampiran 2
Lingkungan Fisik tahap 1Correlations F11 F12 F13 F21 F22 F23 F24 F25 F3 F4 F5 JUMLAH F11 Pearson Correlation 1 .769** .449* .163 .398* .116 .204 .010 .449* .451* .284 .699** Sig. (2-tailed) .000 .013 .388 .029 .543 .278 .959 .013 .012 .129 .000 N 30 30 30 30 30 30 30 30 30 30 30 30 F12 Pearson Correlation .769** 1 .411* .275 .347 .371* .452*-.083 .411*.602** .406* .800** Sig. (2-tailed) .000 .024 .142 .060 .043 .012 .661 .024 .000 .026 .000 N 30 30 30 30 30 30 30 30 30 30 30 30 F13 Pearson Correlation .449* .411* 1 .022 .355 .213 .166 .298 1.000** .462* .463* .801** Sig. (2-tailed) .013 .024 .907 .054 .259 .381 .110 .000 .010 .010 .000 N 30 30 30 30 30 30 30 30 30 30 30 30 F21 Pearson Correlation .163 .275 .022 1 .266 .356 .443* .247 .022 -.046 -.254 .312 Sig. (2-tailed) .388 .142 .907 .155 .054 .014 .189 .907 .808 .176 .093 N 30 30 30 30 30 30 30 30 30 30 30 30 F22 Pearson Correlation .398* .347 .355 .266 1 .189 .189 .213 .355 .064 -.036 .538** Sig. (2-tailed) .029 .060 .054 .155 .318 .317 .258 .054 .738 .852 .002 N 30 30 30 30 30 30 30 30 30 30 30 30 F23 Pearson Correlation .116 .371* .213 .356 .189 1 .695** .306 .213 -.119 -.237 .424* Sig. (2-tailed) .543 .043 .259 .054 .318 .000 .100 .259 .531 .207 .019 N 30 30 30 30 30 30 30 30 30 30 30 30 F24 Pearson Correlation .204 .452* .166 .443* .189 .695** 1 .218 .166 -.010 -.174 .459* Sig. (2-tailed) .278 .012 .381 .014 .317 .000 .248 .381 .957 .358 .011 N 30 30 30 30 30 30 30 30 30 30 30 30 F25 Pearson Correlation .010 -.083 .298 .247 .213 .306 .218 1 .298 -.168 -.109 .282 Sig. (2-tailed) .959 .661 .110 .189 .258 .100 .248 .110 .375 .565 .131 N 30 30 30 30 30 30 30 30 30 30 30 30 F3 Pearson Correlation .449* .411*1.000** .022 .355 .213 .166 .298 1 .462* .463* .801** Sig. (2-tailed) .013 .024 .000 .907 .054 .259 .381 .110 .010 .010 .000 N 30 30 30 30 30 30 30 30 30 30 30 30 F4 Pearson Correlation .451*.602** .462*-.046 .064 -.119 -.010 -.168 .462* 1 .789** .625** Sig. (2-tailed) .012 .000 .010 .808 .738 .531 .957 .375 .010 .000 .000 N 30 30 30 30 30 30 30 30 30 30 30 30 F5 Pearson Correlation .284 .406* .463*-.254 -.036 -.237 -.174 -.109 .463*.789** 1 .493** Sig. (2-tailed) .129 .026 .010 .176 .852 .207 .358 .565 .010 .000 .006 N 30 30 30 30 30 30 30 30 30 30 30 30
JUMLAH Pearson Correlation .699** .800** .801** .312 .538** .424* .459* .282 .801**.625** .493** 1 Sig. (2-tailed) .000 .000 .000 .093 .002 .019 .011 .131 .000 .000 .006
N 30 30 30 30 30 30 30 30 30 30 30 30
**. Correlation is significant at the 0.01 level (2-tailed). *. Correlation is significant at the 0.05 level (2-tailed).
Reliability Statistics Cronbach's Alpha N of Items
Lanjutan Lampiran 2
Lingkungan Fisik tahap 2Correlations F11 F12 F13 F22 F23 F24 F3 F4 F5 JUMLAH F11 Pearson Correlation 1 .769** .449* .398* .116 .204 .449* .451* .284 .717** Sig. (2-tailed) .000 .013 .029 .543 .278 .013 .012 .129 .000 N 30 30 30 30 30 30 30 30 30 30 F12 Pearson Correlation .769** 1 .411* .347 .371* .452* .411*.602** .406* .820** Sig. (2-tailed) .000 .024 .060 .043 .012 .024 .000 .026 .000 N 30 30 30 30 30 30 30 30 30 30 F13 Pearson Correlation .449* .411* 1 .355 .213 .166 1.000** .462* .463* .809** Sig. (2-tailed) .013 .024 .054 .259 .381 .000 .010 .010 .000 N 30 30 30 30 30 30 30 30 30 30 F22 Pearson Correlation .398* .347 .355 1 .189 .189 .355 .064 -.036 .513** Sig. (2-tailed) .029 .060 .054 .318 .317 .054 .738 .852 .004 N 30 30 30 30 30 30 30 30 30 30 F23 Pearson Correlation .116 .371* .213 .189 1 .695** .213 -.119 -.237 .374* Sig. (2-tailed) .543 .043 .259 .318 .000 .259 .531 .207 .042 N 30 30 30 30 30 30 30 30 30 30 F24 Pearson Correlation .204 .452* .166 .189 .695** 1 .166 -.010 -.174 .410* Sig. (2-tailed) .278 .012 .381 .317 .000 .381 .957 .358 .024 N 30 30 30 30 30 30 30 30 30 30 F3 Pearson Correlation .449* .411*1.000** .355 .213 .166 1 .462* .463* .809** Sig. (2-tailed) .013 .024 .000 .054 .259 .381 .010 .010 .000 N 30 30 30 30 30 30 30 30 30 30 F4 Pearson Correlation .451*.602** .462* .064 -.119 -.010 .462* 1 .789** .681** Sig. (2-tailed) .012 .000 .010 .738 .531 .957 .010 .000 .000 N 30 30 30 30 30 30 30 30 30 30 F5 Pearson Correlation .284 .406* .463* -.036 -.237 -.174 .463*.789** 1 .559** Sig. (2-tailed) .129 .026 .010 .852 .207 .358 .010 .000 .001 N 30 30 30 30 30 30 30 30 30 30
JUMLAH Pearson Correlation .717** .820** .809**.513** .374* .410* .809**.681**.559** 1 Sig. (2-tailed) .000 .000 .000 .004 .042 .024 .000 .000 .001
N 30 30 30 30 30 30 30 30 30 30
**. Correlation is significant at the 0.01 level (2-tailed). *. Correlation is significant at the 0.05 level (2-tailed).
Reliability Statistics Cronbach's Alpha N of Items
.813 9 PEOPLE Correlations G1 G2 G3 G4 G5 JUMLAH G1 Pearson Correlation 1 .418* .439*.737**.218 .821** Sig. (2-tailed) .022 .015 .000 .248 .000 N 30 30 30 30 30 30
Lanjutan Lampiran 2
G2 Pearson Correlation .418* 1 .422* .335 .757**.711** Sig. (2-tailed) .022 .020 .070 .000 .000 N 30 30 30 30 30 30 G3 Pearson Correlation .439* .422* 1 .350 .317 .701** Sig. (2-tailed) .015 .020 .058 .088 .000 N 30 30 30 30 30 30 G4 Pearson Correlation .737** .335 .350 1 .375*.809** Sig. (2-tailed) .000 .070 .058 .041 .000 N 30 30 30 30 30 30 G5 Pearson Correlation .218 .757** .317 .375* 1 .626** Sig. (2-tailed) .248 .000 .088 .041 .000 N 30 30 30 30 30 30JUMLAH Pearson Correlation .821** .711** .701**.809**.626** 1 Sig. (2-tailed) .000 .000 .000 .000 .000
N 30 30 30 30 30 30
*. Correlation is significant at the 0.05 level (2-tailed). **. Correlation is significant at the 0.01 level (2-tailed).
Reliability Statistics Cronbach's Alpha N of Items
.778 5 CITRA MEREK Correlations H1 H2 H3 JUMLAH H1 Pearson Correlation 1 .634** .495** .804** Sig. (2-tailed) .000 .005 .000 N 30 30 30 30 H2 Pearson Correlation .634** 1 .801** .923** Sig. (2-tailed) .000 .000 .000 N 30 30 30 30 H3 Pearson Correlation .495** .801** 1 .890** Sig. (2-tailed) .005 .000 .000 N 30 30 30 30
JUMLAH Pearson Correlation .804** .923** .890** 1 Sig. (2-tailed) .000 .000 .000
N 30 30 30 30
**. Correlation is significant at the 0.01 level (2-tailed).
Reliability Statistics Cronbach's Alpha N of Items
Lampiran 3. Perhitungan Uji Reliabilitas Alat Ukur
Hasil standar loading dan
measurement error
CFA
PRODUK
dapat dilihat
pada Tabel
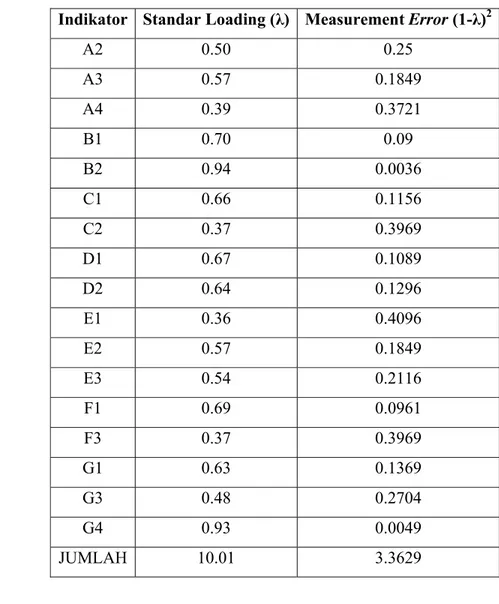
Tabel Reliabilitas Konstruk
Eksogen
Indikator Standar Loading (λ) Measurement
Error
(1-λ)
2A2 0.50
0.25
A3 0.57
0.1849
A4 0.39
0.3721
B1 0.70
0.09
B2 0.94
0.0036
C1 0.66
0.1156
C2 0.37
0.3969
D1 0.67
0.1089
D2 0.64
0.1296
E1 0.36
0.4096
E2 0.57
0.1849
E3 0.54
0.2116
F1 0.69
0.0961
F3 0.37
0.3969
G1 0.63
0.1369
G3 0.48
0.2704
G4 0.93
0.0049
JUMLAH 10.01
3.3629
Nilai reliabilitas konstruk sebagai berikut :
10.01
10.01
3.3629
0.9675
Karena nilai reliabilitas konstruk eksogen sebesar 0.9675
≥
0,70 maka dapat
Lanjutan Lampiran 3. Perhitungan Uji Reliabilitas Alat Ukur
Tabel Reliabilitas Konstruk
Endogen
Indikator Standar Loading (λ) Measurement
Error
(1-λ)
2H1 0.47
0.2809
H2 0.63
0.1369
H3 0.44
0.3136
JUMLAH 1.57
0.7314
Nilai reliabilitas konstruk sebagai berikut :
1.57
1.57
0.7314
0.7711
Karena nilai reliabilitas konstruk eksogen sebesar 0.7711
≥
0,70 maka dapat
dikatakan bahwa variabel - variabel tersebut sudah reliabel.
Lampiran 4. Syntax Lisrel Uji CFA Eksogen Tahap Akhir
CFA EKSOGEN
Raw Data from file 'D:\a\DATA.psf'
Latent Variables PRODUK HARGA TEMPAT IKLAN PROSES LINGFIS
PEOPLE
Relationships
A2-A4 = PRODUK
B1-B2 = HARGA
C1-C2 = TEMPAT
D1-D2 = IKLAN
E1-E3 = PROSES
F1 F3 = LINGFIS
G1 G3-G4= PEOPLE
set
error
variance of B2 equal to free
set
error
covariance of D1 and B1 free
set
error
covariance of D2 and B2 free
Path Diagram
Iterations = 250
Method of Estimation: MAXIMUM LIKELIHOOD
End of Problem
Lampiran 5. Output Lisrel Uji CFA Eksogen Tahap Akhir
DATE: 8/10/2010
TIME: 9:41
L I S R E L 8.50 BY
Karl G. Jöreskog & Dag Sörbom
This program is published exclusively by Scientific Software International, Inc. 7383 N. Lincoln Avenue, Suite 100 Lincolnwood, IL 60712, U.S.A.
Phone: (800)247-6113, (847)675-0720, Fax: (847)675-2140 Copyright by Scientific Software International, Inc., 1981-2001 Use of this program is subject to the terms specified in the
Universal Copyright Convention. Website: www.ssicentral.com
The following lines were read from file D:\a\CFA EKSOGEN.spj: CFA EKSOGEN
Raw Data from file 'D:\a\DATA.psf'
Latent Variables PRODUK HARGA TEMPAT IKLAN PROSES LINGFIS PEOPLE Relationships A2-A4 = PRODUK B1-B2 = HARGA C1-C2 = TEMPAT D1-D2 = IKLAN E1-E3 = PROSES F1 F3 = LINGFIS G1 G3-G4= PEOPLE
set error variance of B2 equal to free set error covariance of D1 and B1 free
set error covariance of D2 and B2 free
Path Diagram
Iterations = 250
Method of Estimation: MAXIMUM LIKELIHOOD End of Problem
Sample Size = 120
Lanjutan Lampiran 5
CFA EKSOGEN Covariance Matrix A2 A3 A4 B1 B2 C1 --- --- --- --- --- --- A2 0.45 A3 0.29 0.42 A4 0.17 0.22 0.39 B1 0.06 0.03 -0.02 0.74 B2 0.03 0.03 0.02 0.65 0.86 C1 0.05 0.08 0.07 0.13 0.16 0.51 C2 0.08 0.11 0.02 0.07 0.07 0.24 D1 0.11 0.06 0.02 0.20 0.16 0.13 D2 0.10 0.09 0.07 0.18 0.34 0.10 E1 0.13 0.10 0.13 0.09 0.10 0.06 E2 0.01 -0.03 0.05 0.13 0.11 0.06 E3 0.08 0.02 0.06 0.20 0.16 0.07 F1 0.26 0.29 0.22 0.04 0.04 0.09 F3 0.09 0.15 0.18 0.03 0.02 0.06 G1 0.07 0.03 0.04 0.15 0.10 0.05 G3 0.07 0.11 0.07 0.16 0.13 0.07 G4 0.05 0.02 0.04 0.15 0.15 0.19 Covariance Matrix C2 D1 D2 E1 E2 E3 --- --- --- --- --- --- C2 0.50 D1 0.04 0.55 D2 0.04 0.43 0.65 E1 0.03 0.13 0.15 0.32 E2 0.01 0.09 0.04 0.20 0.39 E3 0.05 0.12 0.07 0.18 0.31 0.48 F1 0.09 0.10 0.11 0.11 0.01 0.06 F3 -0.02 0.13 0.09 0.05 0.03 0.08 G1 0.04 0.10 0.07 0.07 0.10 0.09 G3 0.09 0.14 0.12 0.14 0.14 0.12 G4 0.10 0.11 0.12 0.13 0.14 0.11 Covariance Matrix F1 F3 G1 G3 G4 --- --- --- --- --- F1 0.38 F3 0.25 0.67 G1 0.04 -0.02 0.87 G3 0.10 0.06 0.31 0.79 G4 0.03 0.04 0.59 0.44 1.01 CFA EKSOGEN Number of Iterations = 27Lanjutan Lampiran 5
Measurement EquationsA2 = 0.50*PRODUK, Errorvar.= 0.19 , R² = 0.57
(0.054) (0.030) 9.23 6.43
A3 = 0.57*PRODUK, Errorvar.= 0.089 , R² = 0.78
(0.049) (0.023) 11.63 3.96
A4 = 0.39*PRODUK, Errorvar.= 0.24 , R² = 0.38
(0.054) (0.034) 7.13 7.13
B1 = 0.70*HARGA, Errorvar.= 0.25 , R² = 0.66
(0.065) (0.032) 10.79 8.07 B2 = 0.92*HARGA,, R² = 1.00 (0.058) 15.86
C1 = 0.65*TEMPAT, Errorvar.= 0.088, R² = 0.83
(0.11) (0.13) 5.71 0.66
C2 = 0.37*TEMPAT, Errorvar.= 0.36 , R² = 0.28
(0.084) (0.065) 4.44 5.63
D1 = 0.64*IKLAN, Errorvar.= 0.13 , R² = 0.76
(0.075) (0.073) 8.55 1.75
D2 = 0.68*IKLAN, Errorvar.= 0.21 , R² = 0.68
(0.080) (0.083) 8.50 2.58
E1 = 0.36*PROSES, Errorvar.= 0.20 , R² = 0.39
(0.050) (0.029) 7.09 6.86
E2 = 0.57*PROSES, Errorvar.= 0.068 , R² = 0.83
(0.052) (0.032) 10.99 2.10
E3 = 0.54*PROSES, Errorvar.= 0.18 , R² = 0.62
(0.059) (0.037) 9.24 4.88
F1 = 0.69*LINGFIS, Errorvar.= -0.099 , R² = 1.26 (0.066) (0.078)
10.52 -1.26
Lanjutan Lampiran 5
F3 = 0.36*LINGFIS, Errorvar.= 0.54 , R² = 0.20
(0.077) (0.073) 4.71 7.37
G1 = 0.63*PEOPLE, Errorvar.= 0.47 , R² = 0.46
(0.088) (0.083) 7.22 5.61
G3 = 0.48*PEOPLE, Errorvar.= 0.56 , R² = 0.29
(0.084) (0.081) 5.73 6.96
G4 = 0.93*PEOPLE, Errorvar.= 0.15 , R² = 0.85
(0.096) (0.12) 9.70 1.20
Error Covariance for D1 and B1 = 0.049
(0.029) 1.68
Error Covariance for D2 and B2 = 0.15
(0.036) 4.15
Correlation Matrix of Independent Variables
PRODUK HARGA TEMPAT IKLAN PROSES LINGFIS --- --- --- --- --- --- PRODUK 1.00 HARGA 0.03 1.00 (0.10) 0.35 TEMPAT 0.22 0.31 1.00 (0.11) (0.10) 1.99 3.15 IKLAN 0.22 0.28 0.27 1.00 (0.10) (0.09) (0.11) 2.16 3.04 2.47 PROSES 0.07 0.27 0.18 0.25 1.00 (0.11) (0.09) (0.11) (0.10) 0.64 3.04 1.68 2.47 LINGFIS 0.76 0.05 0.21 0.22 0.10 1.00 (0.08) (0.08) (0.09) (0.09) (0.09) 9.67 0.69 2.26 2.54 1.14 PEOPLE 0.08 0.16 0.29 0.21 0.28 0.07 (0.11) (0.09) (0.11) (0.10) (0.10) (0.09) 0.78 1.79 2.73 2.06 2.89 0.81
Lanjutan Lampiran 5
Correlation Matrix of Independent Variables PEOPLE
--- PEOPLE 1.00
Goodness of Fit Statistics
Degrees of Freedom = 97
Minimum Fit Function Chi-square = 133.88 (P = 0.0078)
Normal Theory Weighted Least Squares Chi-square = 121.18 (P = 0.049)
Estimated Non-centrality Parameter (NCP) = 24.18 90 Percent Confidence Interval for NCP = (0.15 ; 56.36)
Minimum Fit Function Value = 1.13
Population Discrepancy Function Value (F0) = 0.20
90 Percent Confidence Interval for F0 = (0.0013 ; 0.47) Root Mean Square Error of Approximation (RMSEA) = 0.046
90 Percent Confidence Interval for RMSEA = (0.0036 ; 0.070) P-Value for Test of Close Fit (RMSEA < 0.05) = 0.59
Expected Cross-Validation Index (ECVI) = 1.96 90 Percent Confidence Interval for ECVI = (1.76 ; 2.23) ECVI for Saturated Model = 2.57
ECVI for Independence Model = 8.65
Chi-square for Independence Model with 136 Degrees of Freedom = 995.60
Independence AIC = 1029.60 Model AIC = 233.18 Saturated AIC = 306.00 Independence CAIC = 1093.99 Model CAIC = 445.28 Saturated CAIC = 885.49
Normed Fit Index (NFI) = 0.87
Non-Normed Fit Index (NNFI) = 0.94
Parsimony Normed Fit Index (PNFI) = 0.62
Comparative Fit Index (CFI) = 0.96
Incremental Fit Index (IFI) = 0.96
Relative Fit Index (RFI) = 0.81
Critical N (CN) = 118.61
Root Mean Square Residual (RMR) = 0.038 Standardized RMR = 0.077
Goodness of Fit Index (GFI) = 0.89
Adjusted Goodness of Fit Index (AGFI) = 0.83
Parsimony Goodness of Fit Index (PGFI) = 0.57
The Modification Indices Suggest to Add the Path to from Decrease in Chi-square New Estimate
E1 PRODUK 20.5 0.21 E1 IKLAN 10.5 0.16 E2 PRODUK 14.9 -0.17
Lampiran 6. Syntax Lisrel Hasil Uji CFA Endogen
CFA ENDOGEN
Raw Data from file 'D:\a\DATA.psf'
Latent Variables CITRA
H1-H3 = CITRA
set
error
variance of H2 equal to free
Relationships
Path Diagram
Iterations = 250
Method of Estimation: maximum likelihood
End of Problem
Lampiran 7. Output Lisrel Hasil Uji Kesesuaian CFA Endogen
DATE: 8/10/2010TIME: 9:44
L I S R E L 8.50 BY
Karl G. Jöreskog & Dag Sörbom
This program is published exclusively by Scientific Software International, Inc. 7383 N. Lincoln Avenue, Suite 100 Lincolnwood, IL 60712, U.S.A.
Phone: (800)247-6113, (847)675-0720, Fax: (847)675-2140 Copyright by Scientific Software International, Inc., 1981-2001 Use of this program is subject to the terms specified in the
Universal Copyright Convention. Website: www.ssicentral.com
The following lines were read from file D:\a\CFA ENDOGEN.spj: CFA ENDOGEN
Raw Data from file 'D:\a\DATA.psf' Latent Variables CITRA
H1-H3 = CITRA
set error variance of H2 equal to free
Relationships Path Diagram Iterations = 250
Method of Estimation: maximum likelihood End of Problem
Lanjutan Lampiran 7
CFA ENDOGEN Covariance Matrix H1 H2 H3 --- --- --- H1 0.46 H2 0.29 0.40 H3 0.18 0.28 0.49 CFA ENDOGEN Number of Iterations = 5LISREL Estimates (Maximum Likelihood) Measurement Equations
H1 = 0.47*CITRA, Errorvar.= 0.25 , R² = 0.47
(0.055) (0.032) 8.53 7.71 H2 = 0.63*CITRA,, R² = 1.00 (0.041) 15.43
H3 = 0.44*CITRA, Errorvar.= 0.29 , R² = 0.40
(0.057) (0.038) 7.69 7.71
Correlation Matrix of Independent Variables CITRA
--- 1.00
Goodness of Fit Statistics
Degrees of Freedom = 1
Minimum Fit Function Chi-square = 0.66 (P = 0.42)
Normal Theory Weighted Least Squares Chi-square = 0.66 (P = 0.42)
Estimated Non-centrality Parameter (NCP) = 0.0 90 Percent Confidence Interval for NCP = (0.0 ; 6.02)
Minimum Fit Function Value = 0.0056
Population Discrepancy Function Value (F0) = 0.0
90 Percent Confidence Interval for F0 = (0.0 ; 0.051) Root Mean Square Error of Approximation (RMSEA) = 0.0
90 Percent Confidence Interval for RMSEA = (0.0 ; 0.22) P-Value for Test of Close Fit (RMSEA < 0.05) = 0.48
Lanjutan Lampiran 7
Expected Cross-Validation Index (ECVI) = 0.092 90 Percent Confidence Interval for ECVI = (0.092 ; 0.14) ECVI for Saturated Model = 0.10
ECVI for Independence Model = 1.20
Chi-square for Independence Model with 3 Degrees of Freedom = 136.21
Independence AIC = 142.21 Model AIC = 10.66 Saturated AIC = 12.00 Independence CAIC = 153.57 Model CAIC = 29.60 Saturated CAIC = 34.72
Normed Fit Index (NFI) = 1.00
Non-Normed Fit Index (NNFI) = 1.01
Parsimony Normed Fit Index (PNFI) = 0.33
Comparative Fit Index (CFI) = 1.00
Incremental Fit Index (IFI) = 1.00
Relative Fit Index (RFI) = 0.99
Critical N (CN) = 1191.80
Root Mean Square Residual (RMR) = 0.0082 Standardized RMR = 0.017
Goodness of Fit Index (GFI) = 1.00
Adjusted Goodness of Fit Index (AGFI) = 0.98
Parsimony Goodness of Fit Index (PGFI) = 0.17
Lampiran 8. Syntax Model SEM Hasil Uji Kesesuaian Tahap Akhir
Raw Data from file 'D:\full struktur\S.psf'
Latent Variables PRODUK HARGA TEMPAT IKLAN PROSES LINGFIS
PEOPLE CITRA
Relationships
A2-A4 = PRODUK
B1-B2 = HARGA
C1-C2 = TEMPAT
D1-D2 = IKLAN
E1-E3 = PROSES
F1 F3 = LINGFIS
G1 G3-G4 = PEOPLE
H1-H3 =CITRA
CITRA = PRODUK HARGA TEMPAT IKLAN PROSES LINGFIS PEOPLE
CITRA
SET
ERROR
VARIANCE OF B2 EQUAL TO FREE
SET
ERROR
COVARIANCE OF D1 AND B2 FREE
SET
ERROR
COVARIANCE OF C2 AND H3 FREE
SET
ERROR
COVARIANCE OF C1 AND H3 FREE
SET
ERROR
COVARIANCE OF D2 AND B2 FREE
Path Diagram
Iterations = 250
Method of Estimation: Maximum Likelihood
End of Problem
Lampiran 9. Output Hasil Uji Kesesuaian Model Sem Tahap Akhir
DATE:
8/10/2010
TIME: 9:33
L I S R E L 8.50 BY
Karl G. Jöreskog & Dag Sörbom
This program is published exclusively by Scientific Software International, Inc. 7383 N. Lincoln Avenue, Suite 100 Lincolnwood, IL 60712, U.S.A.
Phone: (800)247-6113, (847)675-0720, Fax: (847)675-2140 Copyright by Scientific Software International, Inc., 1981-2001 Use of this program is subject to the terms specified in the Universal Copyright Convention.
Website: www.ssicentral.com
Lanjutan Lampiran 9
Raw Data from file 'D:\full struktur\S.psf'
Latent Variables PRODUK HARGA TEMPAT IKLAN PROSES LINGFIS PEOPLE CITRA Relationships A2-A4 = PRODUK B1-B2 = HARGA C1-C2 = TEMPAT D1-D2 = IKLAN E1-E3 = PROSES F1 F3 = LINGFIS G1 G3-G4 = PEOPLE H1-H3 =CITRA
CITRA = PRODUK HARGA TEMPAT IKLAN PROSES LINGFIS PEOPLE CITRA SET ERROR VARIANCE OF B2 EQUAL TO FREE
SET ERROR COVARIANCE OF D1 AND B2 FREE
SET ERROR COVARIANCE OF C2 AND H3 FREE
SET ERROR COVARIANCE OF C1 AND H3 FREE
SET ERROR COVARIANCE OF D2 AND B2 FREE
Path Diagram Iterations = 250
Method of Estimation: Maximum Likelihood End of Problem Sample Size = 120 Covariance Matrix H1 H2 H3 A2 A3 A4 --- --- --- --- --- --- H1 0.46 H2 0.29 0.40 H3 0.18 0.28 0.49 A2 0.13 0.15 0.11 0.45 A3 0.11 0.14 0.11 0.29 0.42 A4 0.11 0.13 0.08 0.17 0.22 0.39 B1 0.05 0.04 0.08 0.06 0.03 -0.02 B2 0.06 0.05 0.09 0.03 0.03 0.02 C1 0.14 0.25 0.27 0.05 0.08 0.07 C2 0.09 0.20 0.33 0.08 0.11 0.02 D1 0.08 0.11 0.07 0.11 0.06 0.02 D2 0.09 0.11 0.07 0.10 0.09 0.07 E1 0.18 0.16 0.07 0.13 0.10 0.13 E2 0.11 0.12 0.06 0.01 -0.03 0.05 E3 0.11 0.12 0.08 0.08 0.02 0.06 F1 0.06 0.10 0.10 0.26 0.29 0.22 F3 0.03 0.06 - - 0.09 0.15 0.18 G1 0.09 0.18 0.12 0.07 0.03 0.04 G3 0.17 0.18 0.20 0.07 0.11 0.07 G4 0.20 0.30 0.16 0.05 0.02 0.04 Covariance Matrix B1 B2 C1 C2 D1 D2 --- --- --- --- --- --- B1 0.74
Lanjutan Lampiran 9
B2 0.65 0.86 C1 0.13 0.16 0.51 C2 0.07 0.07 0.24 0.50 D1 0.20 0.16 0.13 0.04 0.55 D2 0.18 0.34 0.10 0.04 0.43 0.65 E1 0.09 0.10 0.06 0.03 0.13 0.15 E2 0.13 0.11 0.06 0.01 0.09 0.04 E3 0.20 0.16 0.07 0.05 0.12 0.07 F1 0.04 0.04 0.09 0.09 0.10 0.11 F3 0.03 0.02 0.06 -0.02 0.13 0.09 G1 0.15 0.10 0.05 0.04 0.10 0.07 G3 0.16 0.13 0.07 0.09 0.14 0.12 G4 0.15 0.15 0.19 0.10 0.11 0.12 Covariance Matrix E1 E2 E3 F1 F3 G1 --- --- --- --- --- --- E1 0.32 E2 0.20 0.39 E3 0.18 0.31 0.48 F1 0.11 0.01 0.06 0.38 F3 0.05 0.03 0.08 0.25 0.67 G1 0.07 0.10 0.09 0.04 -0.02 0.87 G3 0.14 0.14 0.12 0.10 0.06 0.31 G4 0.13 0.14 0.11 0.03 0.04 0.59 Covariance Matrix G3 G4 --- --- G3 0.79 G4 0.44 1.01 Number of Iterations = 34LISREL Estimates (Maximum Likelihood) Measurement Equations
H1 = 0.44*CITRA, Errorvar.= 0.27 , R² = 0.43
(0.036) 7.35
H2 = 0.66*CITRA, Errorvar.= -0.036 , R² = 1.09
(0.082) (0.029) 8.08 -1.26
W_A_R_N_I_N_G : Error variance is negatif.
H3 = 0.41*CITRA, Errorvar.= 0.31 , R² = 0.36
(0.064) (0.040) 6.48 7.61
Lanjutan Lampiran 9
A2 = 0.51*PRODUK, Errorvar.= 0.19 , R² = 0.57
(0.054) (0.029) 9.38 6.56
A3 = 0.56*PRODUK, Errorvar.= 0.10 , R² = 0.76
(0.049) (0.021) 11.46 4.70
A4 = 0.39*PRODUK, Errorvar.= 0.23 , R² = 0.40
(0.053) (0.033) 7.36 7.16
B1 = 0.70*HARGA, Errorvar.= 0.24 , R² = 0.67 (0.064) (0.029) 11.04 8.28 B2 = 0.94*HARGA,, R² = 1.00 (0.058) 16.09
C1 = 0.57*TEMPAT, Errorvar.= 0.17 , R² = 0.65
(0.068) (0.054) 8.33 3.21
C2 = 0.40*TEMPAT, Errorvar.= 0.33 , R² = 0.32
(0.065) (0.049) 6.12 6.74
D1 = 0.66*IKLAN, Errorvar.= 0.11 , R² = 0.79
(0.072) (0.068) 9.17 1.64
D2 = 0.65*IKLAN, Errorvar.= 0.23 , R² = 0.65
(0.077) (0.071) 8.44 3.20
E1 = 0.36*PROSES, Errorvar.= 0.20 , R² = 0.40
(0.050) (0.028) 7.16 6.89
E2 = 0.57*PROSES, Errorvar.= 0.066 , R² = 0.83
(0.051) (0.030) 11.28 2.19
E3 = 0.54*PROSES, Errorvar.= 0.19 , R² = 0.61
(0.058) (0.036) 9.30 5.19
F1 = 0.69*LINGFIS, Errorvar.= -0.095 , R² = 1.25
(0.063) (0.074) 10.84 -1.28
W_A_R_N_I_N_G : Error variance is negatif.
F3 = 0.37*LINGFIS, Errorvar.= 0.54 , R² = 0.20
(0.077) (0.073) 4.76 7.40
Lanjutan Lampiran 9
G1 = 0.63*PEOPLE, Errorvar.= 0.47 , R² = 0.46
(0.084) (0.077) 7.56 6.11
G3 = 0.48*PEOPLE, Errorvar.= 0.57 , R² = 0.29
(0.082) (0.079) 5.83 7.13
G4 = 0.93*PEOPLE, Errorvar.= 0.14 , R² = 0.86
(0.087) (0.099) 10.67 1.46
Error Covariance for C1 and H3 = 0.095
(0.031) 3.03
Error Covariance for C2 and H3 = 0.19
(0.036) 5.24
Error Covariance for D1 and B2 = -0.09
(0.042) -2.18
Error Covariance for D2 and B2 = 0.10
(0.042) 2.39 Structural Equations
CITRA = 0.42*PRODUK - 0.18*HARGA + 0.55*TEMPAT + 0.034*IKLAN + 0.19*PROSES - 0.25*LINGFIS + 0.25*PEOPLE, Errorvar.= 0.32 ,
.32 , (0.14) (0.065) (0.11) (0.073) (0.070) (0.12) (0.078) (0.092) .092) 3.03 -2.73 4.82 0.47 2.79 -2.10 3.21 3 R² = R² = 0.68
Correlation Matrix of Independent Variables
PRODUK HARGA TEMPAT IKLAN PROSES LINGFIS --- --- --- --- --- --- PRODUK 1.00 HARGA 0.02 1.00 (0.09) 0.20 TEMPAT 0.26 0.24 1.00 (0.11) (0.09) 2.39 2.64
Lanjutan Lampiran 9
IKLAN 0.21 0.40 0.27 1.00 (0.10) (0.11) (0.10) 2.06 3.79 2.57 PROSES 0.07 0.26 0.19 0.24 1.00 (0.11) (0.08) (0.11) (0.10) 0.69 3.05 1.80 2.36 LINGFIS 0.77 0.04 0.21 0.21 0.10 1.00 (0.08) (0.08) (0.09) (0.09) (0.09) 10.10 0.57 2.40 2.47 1.12 PEOPLE 0.09 0.15 0.33 0.20 0.28 0.07 (0.11) (0.09) (0.10) (0.10) (0.10) (0.09) 0.80 1.70 3.24 1.91 2.90 0.80Correlation Matrix of Independent Variables PEOPLE
--- PEOPLE 1.00
Covariance Matrix of Latent Variables
CITRA PRODUK HARGA TEMPAT IKLAN PROSES --- --- --- --- --- --- CITRA 1.00 PRODUK 0.41 1.00 HARGA 0.05 0.02 1.00 TEMPAT 0.69 0.26 0.24 1.00 IKLAN 0.24 0.21 0.40 0.27 1.00 PROSES 0.34 0.07 0.26 0.19 0.24 1.00 LINGFIS 0.22 0.77 0.04 0.21 0.21 0.10 PEOPLE 0.49 0.09 0.15 0.33 0.20 0.28 Covariance Matrix of Latent Variables
LINGFIS PEOPLE --- ---
LINGFIS 1.00
PEOPLE 0.07 1.00
Goodness of Fit Statistics
Degrees of Freedom = 139
Minimum Fit Function Chi-square = 180.46 (P = 0.010)
Normal Theory Weighted Least Squares Chi-square = 166.20 (P = 0.058)
Estimated Non-centrality Parameter (NCP) = 27.20 90 Percent Confidence Interval for NCP = (0.0 ; 63.71)
Minimum Fit Function Value = 1.52
Population Discrepancy Function Value (F0) = 0.23
90 Percent Confidence Interval for F0 = (0.0 ; 0.54)
Lanjutan Lampiran 9
90 Percent Confidence Interval for RMSEA = (0.0 ; 0.062) P-Value for Test of Close Fit (RMSEA < 0.05) = 0.74
Expected Cross-Validation Index (ECVI) = 2.59 90 Percent Confidence Interval for ECVI = (2.36 ; 2.90) ECVI for Saturated Model = 3.53
ECVI for Independence Model = 11.58
Chi-square for Independence Model with 190 Degrees of Freedom = 1337.62
Independence AIC = 1377.62 Model AIC = 308.20 Saturated AIC = 420.00 Independence CAIC = 1453.37 Model CAIC = 577.11 Saturated CAIC = 1215.37
Normed Fit Index (NFI) = 0.87
Non-Normed Fit Index (NNFI) = 0.95
Parsimony Normed Fit Index (PNFI) = 0.63
Comparative Fit Index (CFI) = 0.96
Incremental Fit Index (IFI) = 0.97
Relative Fit Index (RFI) = 0.82
Critical N (CN) = 120.16
Root Mean Square Residual (RMR) = 0.037 Standardized RMR = 0.076
Goodness of Fit Index (GFI) = 0.88
Adjusted Goodness of Fit Index (AGFI) = 0.81
Parsimony Goodness of Fit Index (PGFI) = 0.58
The Modification Indices Suggest to Add the Path to from Decrease in Chi-square New Estimate
E1 PRODUK 21.5 0.21 E1 IKLAN 8.3 0.14 E2 PRODUK 15.2 -0.17
The Modification Indices Suggest to Add an Error Covariance
Between and Decrease in Chi-square New Estimate
G3 H3 9.5 0.10 Time used: 0.109 Seconds