TiBuana
Journal of applied Industrial Engineering-University of PGRI Adi Buana
p-ISSN 2622-2027
e-ISSN 2622-2035
TiBuana, Vol. 01, No. 1, 2018| 49
PERFORMANCE ANALYSIS OF WATER TREATMENT PLANT USING FAILURE
MODE AND EFFECT ANALYSIS METHOD AND PREVENTIVE MAINTENANCE
SCHEDULING
IndraDwiFebryanto
*) *)Industrial Engineering Department, Faculty of Industrial Technology University of PGRI AdiBuana Surabaya
email :[email protected]
ABSTRACT
The availability of pure water is a basic requirement of the Company,which is
one of the main
requirements for the production process in order for the Company to produce the cream.In order to meet the production needs ,the Company must have a Water Treatment Plant with good performance. A good Water Treatment Plant can produce a lot of pure water to meet the water requirements required by the Company. This research is needed to get a good Water Treatment Plant performance to improve the pure water of Company XYZ. This research uses FMEA (Failure Mode and Effects Analysis) method to classify which components require maintenance and scheduling . Scheduling in this research using RCM (Realibility Center Maintenance) method.
In this research yield MTTRs and filter 0,48 hour,bag filter 0,68 hour, cartridge filter 1,22 hour.MTTF sanfilter 684 hours,bag filter 190.3hours,cartridge filter 236,8 hours.And MTBFs and filter with an average of 708
hours,bag filters with an average of 214.8 hours and a filter cartridge with an average of 260.8hours per year. In addition to MTTR, MTTF and MTBF other research is reliability (realibility) sand filter with value 0,178527412, bag filter with value 0,005394050, and cartridge filter with value 0,008884653.
KeyWord: Water Treatment Plant, FMEA, RCM
1. INTRODUCTION
In general, companies that use pure water in their products, have their own pure water-producing system so as to save expenses on the production process. Pure water producers in the company are usually referred to as WTP (Water Treatment Plant) .WTP is the basis of the optimization program that is enabled for treat water from poor quality to get a safe water quality for consumption (Pizzi, 2003). The following is a
WTP process diagram:
initial process of the formation of water process, so the performance of sandfilter should always be maintained so that the water produced does not inhibit the performance of UF. Backwash done in sandfilter is to clean the dirt inside the sandfilter, by way of reversing the water path through the sandfilter so that the dirt in the sandfilter can come out. With the removal of the dirt inside the sandfilter, the water produced by the sandfilter machine gets faster and more. In addition to backwash every water generated sandfilter machine less to supply UF. At the time of water supply for UF less then do backwash in sandfilter for sandfilter performance can return to normal. During this backwash process is done only his research on how high the level of defect in luxury palace products in a company. Hanif uses the FMEA method. The result of Hanif's research is based on RPN value of the disability analyzed that is crack disability at product surface, disability on uneven base color giving (Hanif, 2015). In addition, there is also Hakim, in his research on the effectiveness of preventative maintenance program implementation at a palm oil mill. The judge used the RCM method in his research. The results of the Judge's research are the effectiveness of preventive maintenance programs can be improved and can build regular monitoring on the machine to be well maintained (Judge, 2010). And the last one named Palit, in his research on downtime on the machine production line that often occurs in the company manifaktur aluminum, Palit using FMEA and RCM method in his research. Palit's research result is to generate RCM design proposal in the form of RCM decision from each machine component and Improvement with RCM design can decrease downtime equal to 58,07% (Palit, 2012).
Based on the description above in this research, then will be modeled some kind of damage that happened in WTP machine by using method FMEA (Failure Mode and Effects Analysis). The FMEA method is an analytical technique that combines technology and experience in identifying production process failures and planning for damage prevention.
The method in this research using Failure Method and Effect Analysis and Realibility Center Maintenance method. The FMEA method is a technical analysis which, if done correctly and in a timely manner, will provide great value in assisting the decision making process of the engineer during design and development. Such an analysis is usually called a "bottom up" analysis, such as an examination of the initial production process and considering system failures that are the
• Severity is the first step to analyze the risk of calculating how big the impact that arises when a failure occurs. These impacts are scored from the scale of tables 1 to 10, of which 10 are the worst.
• Occurance is a possibility of failure during the life of the product. By estimating the possibility of occurance on a scale of tables 1 to 10.
• Detection is a measure of the ability to control or control the failure that can occur.
• Risk Priority Number (RPN) is a mathematical product of the seriousness of the effect (severity), the probability of occurrence that will cause failure associated with the effect (occurance), and the ability to detect failure before it occurs to the customer (detection).
The RCM method of reliability or reliability can be defined as the probability that a component or system will inform a function that is required within a given time period when used under operating conditions (Ebeling, 1997). Preventive maintenance can be interpreted as a maintenance action to keep the system or sub-assembly in order to keep operating in accordance with its function by preparing inspection in systematic, detection, and correction on minor damage to prevent.
• Preventive maintenance can be interpreted as a maintenance measure to keep the system or sub-assembly in order to keep operating in accordance with its function by preparing systematic inspection, detection, and correction on minor damage to prevent the occurrence of greater damage. • Reactive Maintenance, this type of
TiBuana
Journal of applied Industrial E
| 51 • Prediction and inspe
Although many methods to determine the PM sche no valid before the reliability of a component • Proactive Maintenance,
treatment helps improve actions such as be workmanship, installation, and maintenance procedu In this research needed som data in order to get result which purpose. The data presented in thi on conditions that are in accorda is happening in the company. . P data in this study based on da through questionnaires. The data as supporting data in per calculation process using the Mi
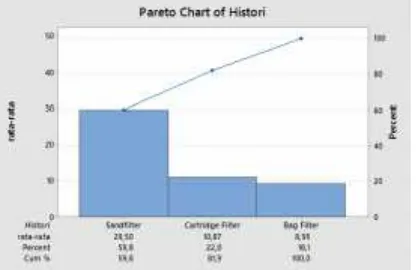
Figure 2. Pareto Diagram Data
From the table above can the highest average MTTR betwe history is on the filter cartridge tha
Figure 3. Pareto Diagram MT
From the table above can the average MTBF highest am history is on the sandfilter is e days and the smallest average am
al Engineering-University of PGRI Adi Buana
TiBuana, Vol. 0 | 51 spection tests
hods can be used chedule, there is he age-derived ponent.
e, this type of ove care through better design, tion, scheduling,
dures.
some supporting hich according to this study based dance with what . Presentation of on data obtained data will be used performing the Minitab tool. So
from the calculation us schedule preventive maint the questionnaire follows a WTP system, for infor components are most co After that all data obtaine value (Risk Priority Num determine which com scheduling preventive results of the questionnair in Table 1
3. RESULT AND D Based on the results of th then the highest RPN value 1. Sandfilter with value 2. Cartridge filter wit 3. Bag filter with value
ata of MTTR Sandfilter, Bag Filter, Cartridge Filter
an be seen that ween the three
that is equal to
73.00 minutes and the sma the three history is at the sa to 28.75 minutes.
TBF Sandfilter Data, Bag Filter, Cartridge Filter on
can be seen that among the third equal to 29.50 among the three
history is in bag filter th days.
Sandfilter Data Processin
p-ISSN 2622-2027
e-ISSN 2622-2035
ol. 01, No. 1, 2018| 51 using the tool can aintenance. Data from s all components of the formation on which commonly damaged. ined is calculated RPN umber) to be able to components requires maintenance. The aire data are presented
D DISCUSSION the RPN table above, lues are:
alue 384 ith value 378 alue 343
ter on WTP machine
mallest average among sandfilter that is equal
r on WTP machine
that is equal to 8.95
Figure 4. Inde
From the result of proces Of Fit with minitab 17, it can be c the probability value of sandfilt there is some data out of the ri result above we get value of weibu
Figure 5. Inde
From Index Of Fit processing wit got the biggest value for MTBF da sandfilter component is to use the distribution with r = 0.976.
Figure 6. Inde
. Index Of Fit MTTR Data Sandfilter Components
ocessing of Index n be concluded that ndfilter component ring. From the eibull estimation
equal to 0,903; lognor exponential of -; and norm calculation with minitab 17 lowest value is weibull whi is normal.
. Index Of Fit MTBF Data Sandfilter Components
with minitab 17, F data of the lognormal
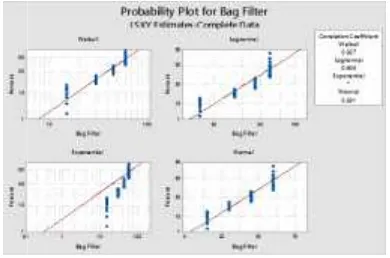
Data Processing Bag Filte The data bag that has been processed using minitab as
. Index Of Fit MTTR Data Filter Bag Component nts
ognormal of 0.913; nd normal at 0.923. From the 17 software shows the while the highest value
nts
ilter
en collected will be b as below.
TiBuana
Journal of applied Industrial E
| 53
From Index Of Fit
results
with minitab 17,
concluded that the probability
bag component filter there ar
outof the ring. From the resul
get value of weibull estimati
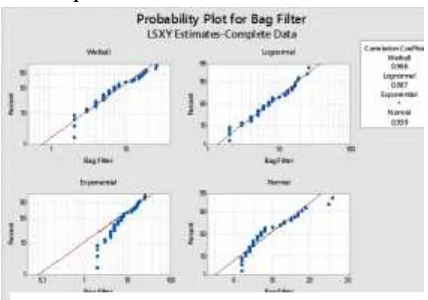
Figure
From the processing of with minitab 17, obtained the val for MTBF data bag filter compone lognormal distribution with r = 0.9
Figure 8. Inde
From Index Of Fit proc with minitab 17, it can be concl probability value of the compone filters contain some data that com ring. From the result above we
al Engineering-University of PGRI Adi Buana
TiBuana, Vol. 0 | 53
Fit processing
17, it can be
ity value of the
are some data
esult above we
ation equal to
0,927; lognormal of 0.903;
; andnormal at 0.931.
with minitab 17 software
value is lognormal while
is normal.
ure 7. Index Of Fit MTBF Data Filter Bag Component
of Index Of Fit value the largest ponent is to use 0.987.
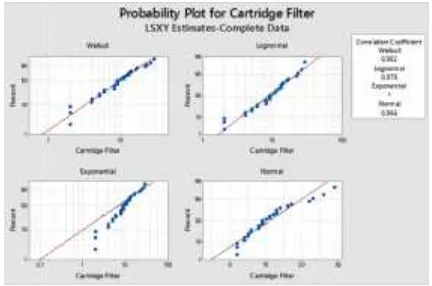
Data Processing Cartridg The filter cartridge data al be processed using minitab
ndex Of Fit MTTR Data Components Cartridge Filte
rocessing results oncluded that the ponent Cartridge comes out of the we get value of
weibull estimation 0.90 0.918;exponential of -; an From the calculation with shows the lowest value i highest value
p-ISSN 2622-2027
e-ISSN 2622-2035
ol. 01, No. 1, 2018| 53
0.903; exponential of
-0.931. From calculations
are shows the lowest
hile the highest value
nents
idge Filter
already collected will tab as below.
ilter
Figure 9 O
From Index Of Fit proc minitab 17, obtained the largest MTBF data of the filter cartridge by using the weibull distributi 0.982.
The data already process then be analyzed to be able de scheduling of all three compone Table 2. C Name of Componen
Sandfilter Bag filter Cartride filter
The data already processed using m calculated for looking for realibili calculated as below:
Ta
The above calculated data reliability of the analyzed WTP c sandfilter with realibility value 0.1 bag filter with realibility value 0.0 and cartridge filter with realibility 0,008884653.
4. CONCLUSION The data already ana resulting in repair time intervals of WTP machine components. I improvements and checks there results on all three components
9 Of Fit Data MTBF Component Cartridge Filter
processing with est value for the dge component is bution with r =
essed above will e determine the ponents that are
often damaged. Analysis follows:
Calculation of M MTTR Of the three m suffered damage can be MTTF and MTTR for poli where during the mainte which must be resolved. 2. Calculation Table of MTTR, MTTF, and MTBF
Damage MTTR
ng minitab, then bility. Data is
Table 3. Table of Reliability Calculations Down component, ie 0.178527412, 0.005394050, lity value
ON
analyzed above als and checking s. In addition to re are reliability nts of the WTP
engine. The results of the a follows:
The result of improvement (MTTR) in components is sandfilter hours, bag filter with an av and filter cartridge with av year.
The result of tim analysis (MTTF) on th components are sandfilter 684 hours, bag filter with
is which is done is as
MTBF, MTTF and machines that often be determined MTBF, policies in taking action ntenance and duration d.
he above analysis are as
of time interval of in the above three ter with average 0.48 n average of 0.68 hours, h average 1.22 hours per
TiBuana
Journal of applied Industrial Engineering-University of PGRI Adi Buana
p-ISSN 2622-2027
e-ISSN 2622-2035
TiBuana, Vol. 01, No. 1, 2018| 55 and cartridge filter with an average of 236.8
hours per year.
The result of time interval checking analysis (MTBF) at the three components above are sandfilter with an average of 708 hours, bag filter with average 214,8 hours and
cartridge filter with an average of 260.8 hours per year.
Results of reliability analysis (realibility) on the third above component is sandfilter with value 0,178527412, bag filter with value 0,005394050, and filter cartridge with value 0,008884653.
5. REFERENCES
1. AWWA, 1971.WaterQualityand Treatment, AWWA, Inc. UAS. 2. Ebeling, C.E. 1997. An Introduktion
reliabilityandMaintainability Engineering. The MC.Graw Hill CompanierInc. New York.
3. Febianti, Evi. 2016. UsulanPerancangan PerawatanMesin RoughingStand DenganPendekatanReabilityCente r Maintenance(RCM),Seminal NasionalIENACO-2016,ISSN233-44349.
4. Hakim, Legisnal. 2010. Aplikasi Komponen RCM Program PemeliharaanPencegahanSebagai Parameter Ketersediaan dan Tingkat Kegagalan padaPeralatan Pengolahan CPOdi PabrikKelapa SawitRSI,
JurnalAPTEKVol3No1.
5. Hanif, Richma. 2015. Perbaikan Kualitas ProdukKeraton LuxuryDiPt X Dengan Menggunakan FMEA Dan FTA, Reka Intagra ISSN2338-5081,
JurusanTeknikIndustriItenasNo 03 Vol.03.
6. Kurniawan, Fajar. 2013. Manajemen Perawatan Industri. Yogyakarta GrahaIlmu,ISBN978-602-262-037-2.
7. Leicth, RogerD. 1995.
RealibilityAnalisis For Engineering:An Introduction. Montgomery, James, 1985.Water TreatmentPrinciples andDesign, A Wiley-Interscience publication, John Wiley&Sons, NewYork. 8. MukhtarAli,M. N. 2016. Simulation of
IroningProsesforBulletCase MinimumFormingForce with Variation ofDie Angleand ReductionWallThickness.
9. Palit, Herry. 2012.Perancangan RCM untukMengurangiDowntime Mesin padaPerusahaan Manufaktur Aluminium, ProsidingSeminar
NasionalManajemenTeknologiXV , ISBN978-602-97491-4-4.
10. Septyani, Sally. 2015. Penentu Waktu IntervalWaktu Perawatan Komponen Kritis Pada MesinTurbin
DiPTPLN(PERSERO)Sektor PembangkitOmbilin,Jurnal
OptimasiSistemIndutri, Vol14 No 2.
11. Setyadi, Indra. 2014. Analisis Penyebab Kecacatan
ProdukCelanaDenganmenggunaka nMetodeFTA dan FMEAdi