CEwebsource.com is produced by Enterprises for Continuing Education Inc. (ECEI), PO Box 300, Brighton, MI 48116-0300,
(810) 229-3354. The views expressed in the journal are the authors’ and do not necessarily represent those of ECEI. Full and complete pre-scribing information should be reviewed regarding any product mentioned herein prior to use. ECEI hereby authorizes you to copy docu-ments published by ECEI on the World Wide Web for non-commercial use only. In consideration of this authorization, you agree that any
copy of these documents which you make shall retain all copyright and other proprietary notices contained herein.
Development of PET
Elaine H. Wacholtz, Ph.D.InTroDucTIon
Positron emission tomography (PET) is a noninvasive diagnostic imaging procedure that enables medical pro-fessionals to view the human body’s biological functions and to study disease processes. Until recently, PET had been envisioned and employed as a research tool, particu-larly in the study of neurophysiology. In the last decade, however, the clinical value of PET as an imaging modality has become increasingly apparent. Medical professionals in the fields of oncology, cardiology, and neurology have been using PET techniques to assess metabolism in their respective evaluations of cancer, damaged heart tissue, and brain disorders. Expectations are high that PET, a nuclear medicine scanning procedure that employs pos-itron-emitting radioactive isotopes to image the body’s metabolic activity, will add a new dimension to the eval-uation and treatment planning of a variety of diseases and medical conditions and that it will serve as a valuable tool for patients’ follow-up and care.1-3
During the PET scanning procedure, physicians and researchers are able to measure in detail the functioning of the human brain [how it thinks and remembers] and other organs [how the heart beats and how the pancreas synthesizes insulin, for example] while patients remain comfortable, conscious, and alert. The PET scanner gen-erates three-dimensional images of the distribution of an IV-administered radiopharmaceutical (a substance con-taining a carrier molecule, such as glucose, and a posi-tron-emitting radioactive isotope that labels the carrier molecule) within the body. The images enable evaluation of physiologic phenomena that include glucose metab-olism, oxygen metabmetab-olism, cerebral blood f low, and receptor sites in the brain. Before the advent of the PET scanner, the study of such physiologic phenomena was not possible. During those times, what went on in patients’ organs and body systems when they were afflicted with disease and illness was inferred from post-mortem dis-sections or from animal studies?4-5
PET uses tomographic algorithms to display data as cross-sectional images in any plane of the living human body. And, as is the case in other nuclear medicine proce-dures, PET’s images are derived from the distribution of radiopharmaceuticals in the body. These two similarities represent the extent of PET’s likeness to MRI and CT and the beginning of its uniqueness. PET’s uniqueness thrives on its ability to produce functional images that permit assessment of chemical and physiological changes associated with metabolic activity, in comparison to the anatomical images produced by MRI and CT that largely depict structure and shape.1
In the first section of this article, we examine in a com-prehensive way PET’s historical perspective, we delve into the reasons for its recent progression in the clinical sector, and we present the year 2000 medical imaging innova-tion that has combined PET and CT technologies, the PET/CT scanner. In the second section, we explore how PET works by looking briefly at the physics behind the process and what the patient experiences.
HIsTorIcal PErsPEcTIvE
Early BEgInnIngs
Lawrence and his colleagues progressed, their cyclotrons increased in size and efficiency and they produced and identified a number of short-lived radioisotopes, such as Carbon-11, Nitrogen-13, Oxygen-15, and Fluorine-18, each of which is currently being used in the synthesis of PET radiopharmaceuticals.
THE 1950s—PIonEErIng IDEas for PET
Wartime research in the late 1930s led to the devel-opment of the nuclear reactor, which, unfortunately, temporarily retired the use of Lawrence and colleagues’ cyclotron and led to use of reactor-produced radioiso-topes (because they were more easily and less expen-sively produced than the short-lived, cyclotron-produced radioisotopes) in the 1940s for biomedical research. The early 1950s heralded two inventions and investigators that contributed to the emergence of imaging in nuclear medicine: the rectilinear scanner by Benedict Cassen and colleagues at UCLA and the gamma camera by Hal Anger and colleagues in Berkeley, California. In 1953, Gordon Brownell at MIT created a precursor to the up-and-coming PET scanner when he constructed the first detector device to record the annihilation that occurs when positrons from positron-emitting pharmaceuticals collide with electrons in the human body. In the middle 1950s, Michel Ter-Pogossian and William Powers of Washington University’s Mallinckrodt Institute of Radiology reinstated in biomedical research the use of radiopharmaceuticals labeled with short-lived, cyclotron-produced radioisotopes. At about this time (1955) on the other side of the world, the first medical cyclotron was built at Hammersmith Hospital in London. Successful experimentation at Hammersmith Hospital led to instal-lation of a National Institutes of Health (NIH)-funded cyclotron in Washington University Medical Center, fol-lowed by the Department of Energy’s funding of hos-pital cyclotrons at UCLA, University of Chicago, and Memorial Sloan Kettering Institute in New York. And, so the production of radioisotopes continued with the use of cyclotrons at these hospitals as well as with the use of existing cyclotrons at UC Berkley and Ohio State. Another development that contributed to the emergence of PET was CT, which was invented by Alan Cormack and Godfrey Hounsfield and popularized by investi-gator, David Kuhl, and colleagues at the University of Pennsylvania in 1959.
THE 1960s anD 1970s—THE DEvEloPmEnT of PET
During the late 1960s, Ter-Pogossian and colleagues continued with and advanced their studies using radio-isotope/radiopharmaceutical techniques while Kuhl and colleagues persevered in their studies of emission com-puted tomography and built the Mark II scanner, often referred to as the ancestor to today’s CT and SPECT scanners. Kuhl and colleagues also studied
reconstruc-tion algorithms, but it was David Chesler’s filtered back projection technique originally developed for CT that was ultimately modified and applied to PET.
The modification and application of Chesler’s filtered back projection technique to PET together with the apt readiness of Ter-Pogossian’s laboratory (i.e., positron-emitting radioisotopes, experience in their production, computers with which to implement algorithms, and engineering expertise in cyclotron targetry, detector sys-tems, and imaging devices), the youthful enthusiasm and workmanship of Michael E. Phelps and his team of col-leagues [i.e., Jerry Cox and Edward Hoffman], and the support of the Department of Energy and NIH paved the way for the 1974 development of the first PET camera or scanner, the PETT III. The star feature of the PETT III was its ability to use advanced algorithms for computing three-dimensional images, which according to today’s standard of PET images, were crude. The PETT III was, for the most part, limited to imaging the head and its resolution was only about 20 mm. In addition to his being one of the developers of the first PET scanner built for human studies, Phelps has contributed to the prolif-eration of PET into the clinical sector by engineering the design of cancer-imaging applications, aiding in the development of PET whole-body scans, establishing the first clinical PET services at UCLA Medical Center in 1990, and heading the international transition of PET from research to clinical application.6
Other developments that were essential to the emer-gence of PET included studies of functional brain map-ping in animals, which alerted neuroscientists about the information that could be derived from measuring brain blood f low and metabolism, and studies of the decay scheme of positron-emitting radioisotopes. It was in the 1970s that researchers realized that highly accurate measurement of brain function in humans could be per-formed with PET and that the most favored technique was blood f low because it could be measured quickly with the radiopharmaceutical, O-15 water, whose short half-life of two minutes made it possible to safely repeat numerous measurements in the same subject.
When they were first introduced in the U.S. in 1970, PET scanners were viewed as a new and exciting research modality that enabled medical researchers to observe, study, and understand the biology of human disease. In 1976 using an application evolved from the work of Louis Sokoloff and colleagues, Al Wolf and Joanna Fowler, chemists at Brookhaven National Laboratory, devel-oped the radiopharmaceutical, fluorodeoxyglucose with Fluorine-18 (FDG)-a development that laid the ground-work for more in-depth research and did much to expand the scope of PET imaging.
of radiopharmaceuticals, and a scanner for detecting and imaging the gamma rays emitted by the radioisotope component of the radiopharmaceutical, as well as a large staff comprised of physicists to operate the cyclotron and oversee the scanner, chemists to synthesize radiophar-maceuticals (such as FDG), and dedicated, specializing physicians to interpret and analyze the images. The first PET scan of a human was reported in 1978.7
The 1970s are seen as the decade in which the devel-opment of PET took place and grew to become a widely encompassing research modality whose impact enabled medical researchers to study and understand the physio-logical and mental workings of the human body and the biology of human disease.
THE 1980s—PET’s aDvancEmEnTs anD
PErformancE In THE rEsEarcH sEcTor
PET remained largely a research modality into the 1980s-the decade during which the technology of PET advanced greatly. The advancement was driven by sev-eral developments. One development was that of a higher resolution PET scanner, such as the one developed by Thomas F. Budinger (a Biological and Environmental Research [BER] scientist) and colleagues in 1986. From an operation standpoint, the number of steps in the scan-ning procedure of the newer PET scanners was reduced and many of the remaining steps were automated, making operation of the scanner less complex. Thus, the new scanning procedures were able to be performed by trained technologists and experienced physicians (rather than by physicists and chemists), ultimately contributing to reducing the cost of the procedure.
A second development was the block detector, which contains 8 x 8 crystals multiplexed to 4 phototubes. Invented by Ronald Nutt and Mike Casey, the block detector has made possible the development of the high resolution tomograph that has slowed the cost of the PET scanner [and made it more affordable to the clin-ical sector] by decreasing the number of optclin-ical detec-tors needed. Prior to the invention of the block detector, one optical detector and electronics channel was needed for each crystal element. In today’s PET systems, there are more than 100,000 elements, but thanks to block detector technology, one optical detector and electronics channel serves 144 elements.
The development of a line of smaller, less expensive, more efficient cyclotrons also contributed to the advance-ment of PET by making possible the installation of cyclotrons at more hospitals for the in-house production of PET radioisotopes to meet the radiopharmaceutical needs of PET research and clinical service. Similarly, the development of a miniaturized self-shielded, low-energy cyclotron containing chemical synthesizers for automated production of positron-emitting radiophar-maceucticals ultimately became the base technology for the concept of PET radiopharmacies. These
radiophar-macies produce and distribute PET radiopharmaceuticals to nearby hospitals and clinics for use in PET imaging-in much the same way as conventional radiopharmaceuticals are distributed by nuclear medicine radiopharmacies. At the time of a 2000 publication of UCLA’s Technology Overview, there were over 60 PET radiopharmacies in the world responsible for the production, chemistry, quality assurance, and business management of PET radiopharmaceuticals, of which FDG was the most widely used. All of this is now possible without the tech-nical, logistical, and economic hassles of the recent past when massive cyclotrons were the only options for the manufacture of radioisotopes to be used in the biosyn-thesis of radiopharmaceuticals.8
Also contributing to the advancement of PET in the 1980s were a number of radiopharmaceutical develop-ments, which included a report by scientists in Brookhaven National Laboratory of the high uptake of FDG in tumors. In another development, scientists at UCLA reported how the use of FDG showed different patterns of glucose metabolism in the brain while subjects per-formed a variety of tasks using different senses. A third radiopharmacetical development was the attempt of many PET centers to determine cardiac viability, employing N-13 to monitor blood flow and FDG to monitor glucose metabolism. The determination of cardiac viability via the use of PET imaging has been considered by some as instrumental in the making of clinical PET into a reality. At the same time, others contend that the use of PET in the diagnosis, management, and treatment of cancer has, since the mid1990s, contributed to increased reimburse-ment for PET services, which has in turn fostered PET’s ultimate transition from a vehicle of research to a sought-after instrument in the clinical sector.
The decade of the 1980s is the time span in which two major imaging companies (i.e., General Electric [GE] and Computer Technology Imagery [CTI]) entered into the PET industry and gave credence to the clinical application of PET, because prior to this time-the late 1980s-most PET applications had been research applications.9-11
THE 1990s—PET’s ProgrEssIon In THE
clInIcal sEcTor
PET Advancements of the 1990s
In 1990, Michael Phelps headed the formation of the Institute for Clinical PET (ICP), a non-profit organi-zation whose purpose was to bring together academia, industry and advocacy groups to educate the public, Congress and professional groups about the value of clin-ical PET.
Whole-body PET scans were introduced in 1992-an event that kicked off the concept of whole-body imaging to detect primary and metastatic disease, differentiate between benign and malignant tumors, and assess thera-peutic efficacy by being able to image all of the organs of the body in a single scan. This introduction of whole-body scans expanded FDG’s importance as a weapon against cancer.
In the late 1990s, a new detector material called lute-tium oxyorthosilicate (LSO) began to replace the use of bismuth germinate oxide (BGO) in PET scanners. Although PET scientists had been using BGO in the fabrication of PET scans since the late 1970s, LSO quickly took over and revolutionized PET imaging sys-tems because it excelled in three fundamental detector material parameters: light output, decay time, and den-sity. The combination of LSO’s high light output [five times more light output than BGO] and high density [slightly higher than that of BGO] served to enhance sharpness and contrast and thus provide superior image quality-driving the resolution PET tomography to a new limit of less then 2 mm. [It is interesting to note that the resolution for positron tomography was 6 mm eleven years ago and 4 mm during the time of BGO detectors.] The short decay time [LSO decays 7.5 times faster than BGO] translated to decreased scan time-an improvement that made patients more comfortable during the proce-dure and from a clinical standpoint increased patient throughput. The increase in patient throughput made the procedure accessible to greater numbers of patients and subsequently increased the testing revenue for hospi-tals and PET imaging centers. The short decay time also lowered the level of random noise in scans.12-17
PET’s Ability to Identify Pathophysiology
As mentioned earlier in this article, PET, because it is based on biological substrates, is able to detect rates of metabolic activity while other imaging modalities, such as CT and MRI, depict anatomical location of struc-tures. From a clinical point of view, this means that disease can be detected by PET during times when ana-tomic structures are still normal. In clinical terms, this means that disease can be detected earlier rather than later, since changes in metabolic processes precede ana-tomical and structural changes. PET’s ability to detect metabolic activity has been especially applicable in the field of oncology because malignancies are detected earlier in the disease cycle when treatment efficacy is at its highest. Apart from its ability to identify patho-physiology, which includes neurologic illnesses, such as
dementias like Alzheimer’s disease and movement disor-ders like Parkinson’s disease, PET is also used to evaluate heart muscle function in patients with coronary artery disease and cardiomyopathy. In the research arena, PET is being used to study drug addiction, psychiatric illness, and stroke.18
Increased Insurance Coverage
Before 1995, most insurers, including Medicare, did not reimburse PET imaging because of the high cost of the procedure and because they associated the procedure with investigation and research. Most medical facilities, on the other hand, could not afford the cost of setting up a PET imaging system or the ongoing operational expense that it required. Things began to change in 1995 when the Health Care Financing Administration (HCFA) approved coverage for Rubidium-82, a gener-ator-produced tracer used in evaluating coronary artery disease. In 1998, HCFS extended coverage to include 18 fluorodeoxyglucose (FDG) for the treatment of two types of lung cancer. In 1999, Medicare agreed to cover whole body PET imaging for lymphoma, colorectal cancer, and metastatic melanoma. In 2000, the HCFA expanded Medicare coverage to include the use of PET in the treatment of six cancers: lung, colorectal, lym-phoma, melanoma, head and neck, and esophageal. The coverage in each of these cancers includes diagnosis and staging to assessment of therapy and recurrence of dis-ease. For non-cancer indications, coverage includes iden-tifying and treating those cardiac patients who would benefit from coronary revascularization and those epi-lepsy patients who would benefit from surgery.
Availability of the PET Radioisotope, FDG
As discussed elsewhere in this article, FDG was not readily available until a few years ago because it is cyclo-tron produced and because it has a relatively short half-life of 110 minutes. Facilities wanting to offer PET imaging have been faced with the prohibitive costs of purchasing and installing a cyclotron and maintaining its operation or alternatively with finding an outside source for obtaining FDG. Opportunely, PET radiopharma-cies that manufacture FDG have popped up all over the United States. By manufacturing and distributing FDG in their regional areas, radiopharmacies have formed a continually-expanding network that has made it possible for community hospitals and outpatient clinics to offer PET services.19-21
THE 2000s—THE PET/cT scannEr
Geneva in Switzerland, and Ronald Nutt, electrical engi-neer and co-founder of CTI. Working intently since the early 1990s, these two scientists developed and applied computer software that combined anatomic information from CT with the unique, functional imaging of PET into one efficient scanning device.
Earlier attempts using computer algorithms to fuse data from PET and CT images made at different times emerged with only limited success, with probable reasons being the minute changes in the patient’s posture and position that inevitably occur when images are acquired on two different systems at different times. Unlike those earlier attempts, Townsend and Nutt managed to create computer software that was able to control the two different imaging systems from one computer con-sole. Based on the newly created algorithms, a prototype combined PET/CT scanner was designed and built as a collaboration between American and German compa-nies and tested by the University of Pittsburgh School of Medicine (UPSM).
PET/CT scanners are seen by oncologists, radiologists, researchers, and patients as an innovative boon to diag-nostic medical imaging because of two main advantages. First, because of their LSO-based technologies, PET/ CT scanners are able to provide unprecedented resolution in the fused images they present of both metabolic and anatomical information-information that is particularly helpful to clinicians who interpret how chemotherapy drugs affect specific metabolic activities at precise loca-tions in the body. Second, the enhanced resolution and resultant superior image quality significantly reduce patient scan times (duration of scan times varies from 20 or 30 minutes-half the time of a PET scan), making the procedure markedly more convenient and comfortable for the patient. Also adding to the patient’s convenience and comfort is the new design of the hybrid scanner-the diameter of the tunnel has been increased to 28 inches.
In addition to the superior image quality and patient comfort that are derived from the two main advantages of PET/CT, additional benefits of include less motion artifacts and fewer problems with claustrophobia.21-23
Although PET/CT is a relatively new innovation in clin-ical imaging, clinclin-ical experience is already showing that PET/CT images provide valuable information that can be used for early diagnosis, more accurate tumor detection and precise localization, improved biopsy sampling, and better assessment of patient responses to chemotherapy or radiation therapy. These are some of the reasons why the fused image of PET/CT scanner, often referred to as the SMART scanner, is being increasing viewed as a result that is greater than the sum of its parts. Figure 1A is an illustration of the SMART scanner. Figure 1B contains an illustration of the fused PET/CT scan as well as illus-trations of individual PET and CT scans.24-26
FIGURE 1A. Schematic of SMART Scanner
FIGURE 1B. Illustration showing the fused PET
and CT scan (as well as the individual PET and CT
scans).
convEnTIonal DIagnosTIc
ImagIng ProcEDurEs
TABLE 1. Diagnostic Imaging Procedures
Procedure
Method
Positive Points
Limitations
X-ray
X-rays (electromagnetic waves) penetrate body tissues and are used to create planar (two-dimensional) images of body structures on film.
Is painless and noninvasive.
X-rays are taken from a series of different angles and arranged by a computer to show a cross-sectional (three-dimensional) view of structures in the body.
Is painless and noninvasive. Portrays soft tissue structures better than x-ray, but contrast detail is inferior to that of MRI.
*
*
Uses x-ray radiation. Provides anatomical image.
Requires patient breath holding.
Conventional CT improved with dramatic scanning speed and thinner slices.
Is painless and noninvasive. Portrays soft tissue structures better than x-ray, but contrast detail is inferior to that of MRI. Improves image resolution and diagnostic accuracy due to use of enhanced contrast concentration and decreased respiratory and cardiac artifacts.
Has superior planar and three-dimensional reformation capabilities. Affords greater patient comfort and department productivity.
Requires patient breath holding.
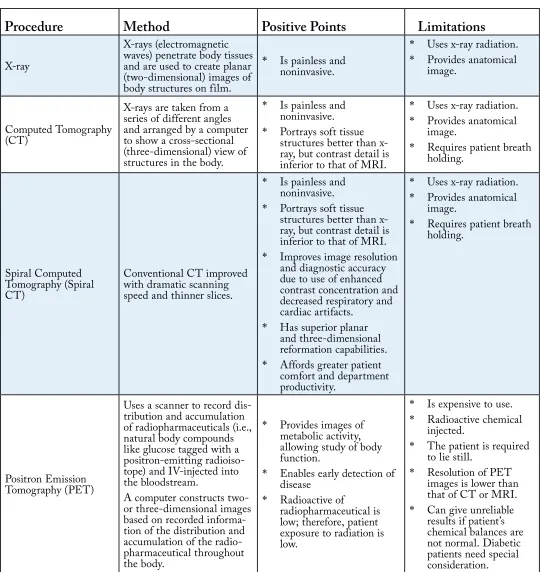
Uses a scanner to record dis-tribution and accumulation of radiopharmaceuticals (i.e., natural body compounds like glucose tagged with a positron-emitting radioiso-tope) and IV-injected into the bloodstream.
A computer constructs two- or three-dimensional images based on recorded informa-tion of the distribuinforma-tion and accumulation of the radio-pharmaceutical throughout the body.
Provides images of metabolic activity, allowing study of body function.
Enables early detection of disease
Radioactive of
radiopharmaceutical is low; therefore, patient exposure to radiation is low.
*
*
*
Is expensive to use. Radioactive chemical injected.
The patient is required to lie still.
Procedure
Method
Positive Points
Limitations
Single Photon Emission Computed Tomography (SPECT)
Like PET, uses scanner to record distribution and con-centration of the radiophar-maceuticals throughout the body.
Key differences between PET and SPECT are:
PET uses positron-emitting radiopharma-ceuticals (which emit two photons) and coin-cidence detection that does not require a col-limator while SPECT uses single-photon-emit-ting radiopharmaceuticals that require the use of collimator.
SPECT radiopharmaceu-ticals directly emit pro-tons while PET radio-pharmaceuticals emit positrons which are con-verted to protons.
•
•
Is less expensive than PET (PET=$2,000-$3,000; SPECT=$700).
Provides functional image (measures metabolism). SPECT’s radioisotopes (key components of
radiopharmaceuticals) have longer half-lives [than PET’s] and can be stored on site.
*
*
*
Is expensive to use.
Radioactive chemical injected.
Image resolution is inferior to that of PET because emission of single photon requires use of collimator to acquire image data, resulting in tremendous decrease in detection efficiency.
The patient is required to lie still.
*
*
*
*
Magnetic Resonance Imaging (MRI)
Uses detection of radio fre-quency signals produced by displaced radio waves in a magnetic field (8,000 times stronger than that of the earth) to create two- or three-dimensional images of body structures. Provides anatomical or structural image.
No x-ray or radioactive chemical used.
Is painless and noninvasive.
Provides exquisite image clarity.
Has ability to create detailed images without contrast media. However, use of gadolinium to image blood vessels and soft tissues like the brain is growing.
*
*
*
*
Is expensive to use.
Provides anatomical image.
Patient required to lie still.
Claustrophobic patients—a problem.
Patients with metallic devices—a problem.
*
*
*
*
Procedure
Method
Positive Points
Limitations
fMRI
(functional Magnetic Resonance Imaging)
Relies on magnetic prop-erties of blood to produce images that portray blood flow as it is happening. Is used to study the physi-ology of the brain and other organs by studying related blood flow.
No x-ray or radioactive chemical used.
Is painless; noninvasive Provides both anatomical and functional images. Provides exquisite image clarity [superior to PET and SPECT]. In-plane resolution of image is generally about 1.5 x 1.5 mm, although resolutions of <1 mm are possible. Has ability to assess blood flow and brain function in seconds [in a shorter time than PET and SPECT]. Total scan time is short— on the order of 1.5 to 2.0 min per run.
*
* *
*
*
*
Is expensive to use.
Patient required to lie still.
Claustrophobic patients—a problem.
Patients with metallic devices—a problem.
*
*
*
*
Ultrasonography
Pulsed, high frequency (>20,000 Hz) sound waves are aimed into the body, reflected back from body tissues, and processed by a computer as a contin-uous, real-time image on a monitor.
Does not employ ionizing radiation and produces no biological injury.
Can be employed in a number of planes (e.g., transaxial, saggital, coronal, or any oblique plane) to show anatomic region being investigated. Is far less expensive than CT, MRI, PET, or SPECT.
Can be performed portably—at bedside, for example.
Real-time ultrasound can provide moving images (e.g., the heart and fetus).
*
*
*
*
*
Image resolution inferior to that of CT, MRI, PET, or SPECT.
The earlier diagnostic imaging procedures of x-ray and CT scan have paved the way for the diagnostic imaging procedures of MRI, PET, and SPECT and have been perceived by many opinion leaders as harbingers of the radiology of the future. The medical professionals of today use all of these diagnostic imaging procedures to evaluate their patients’ diseases or medical conditions. The choice of which imaging procedure or procedures to use is based on the disease or medical condition being evaluated, the uniqueness of each patient’s situation, and on the procedures’ positive points and limitations. Table 1 briefly describes each diagnostic imaging procedure, lists its positive points and limitations, and serves as a vehicle of comparison of the procedures listed.
In sum, the major differences between PET and the diagnostic imaging procedures listed in Table 1 are two:
PET uses an IV-injected radiopharmaceutical to facilitate the creation of images as compared to the x-ray beams used in x-ray and CT scan, the sound waves used in ultrasonography, and the strong magnetic field used in MRI. Unlike some other radiopharmaceuticals that directly emit gamma rays, PET radiopharmaceuticals, emit positrons that are ultimately converted to gamma rays.
PET’s images visualize function, in that they portray metabolic or biochemical processes (physiology), while the other imaging procedures, such as CT and MRI, visualize structure and shape (anatomy). Unlike conventional MRI, the images of functional MRI (fMRI) portray function and provide exquisite clarity, superior to that of PET and SPECT. PET’s ability to present images that visualize function means that it can detect disease when anatomic studies are still normal-since changes in function typically precede changes in structure or anatomy. From an oncology perspective, this means that PET can differentiate benign tissue changes from malignant ones long before associated structural differences become apparent in anatomic imaging procedures. Thus, PET makes possible effective treatment in the early stages of cancer-the stages in which success of treatment is most likely.17,26
The development of PET spans many decades and includes the contributions of many outstanding physi-cists, chemists, biologists, physicians, and businessmen, a number of whom have devoted their lives to the advance-ment of the technology. These contributions have been instrumental in transforming the non-invasive diagnostic imaging procedure from a limited medical research tool that initially employed a small number of radiation sen-sors and constructed images of low resolution and sensi-tivity to a primary, sophisticated imaging device based on a larger number of higher quality radiation sensors and improved computer programs that produces images of high resolution and sensitivity. Today’s modern PET scanners are easier to install and to operate and they offer numerous capabilities (such as speedier procedures and
*
*
movies of parts of the body) for clinicians to use as they perform imaging procedures.
In addition to these technological advances, PET has undergone a gradual but steady transition from a sophis-ticated research environment to the clinical sector where it is being employed in the diagnosis, treatment, and follow-up of patients in the disciplines of oncology, psy-chiatry, and neurology.
How PET works
Positron emission tomography (PET) is a nuclear medicine scanning procedure that employs the elec-tronic detection of short-lived positron-emitting radiopharmaceuticals (substances containing a car-rier molecule, such as glucose, and a positron-emit-ting radioactive isotope that labels or tags the carrier molecule) to study and visualize human physiology. During the PET scanning procedure, physicians and researchers are able to measure in detail the func-tioning of the human brain and other organs while patients remain comfortable, conscious, and alert. The PET scanner or camera generates three-dimensional images of the distribution of an IV-administered radio-pharmaceutical within the body. The images enable the monitoring and evaluation of such bodily processes as glucose metabolism, oxygen metabolism, and cere-bral blood f low. Ongoing indications are that PET’s monitoring and evaluation of the body’s metabolic processes have added a new dimension to the diag-nosis and treatment of a variety of diseases and that the procedure will serve as a valuable tool for patients’ follow-up care.
TEcHnIcal consIDEraTIons
FIGURE 2. In the PET scanner above can be seen
a collision of a positron and electron, their
annihi-lation , the creation of two resultant gamma rays,
the speeding away of the gamma rays 180 degrees
from each other, their detection by the detectors in the
scanner that encircles the patient.
Coincidence Detection
Unlike some other diagnostic imaging modalities whose radiopharmaceuticals directly emit gamma rays, PET uses radiopharmaceuticals that contain
positron-emitting radioisotopes. The emission occurs as positrons emerge from the decaying nuclei of radioactive isotopes specifically created in cyclotrons for use in the synthesis of radiopharmaeuticals. Positrons, which are produced when radioactive substances decay, are subatomic particles that have all of the characteristics of electrons (i.e., mass, size, magnitude of charge), except polarity of charge. Positrons ([e+] positively charged) are the antimatter equivalents of electrons ([e-] negatively charged), which physicists clas-sify as matter. Like all other forms of antimatter, pos-itrons live short, violent lives. When matter (electrons) collides with its corresponding antimatter (positrons), the electrons and positrons are destroyed and their mass is transformed into a pair of high-energy gamma rays that speed away [from the collision] in opposite directions. It is on the basis of this principle that the positrons emitted from radiopharmaceuticals during PET scan procedures are transformed into gamma rays that are detected by gamma cameras or PET scanners (Figure 2) and pro-spectively reconstructed into images.27,28
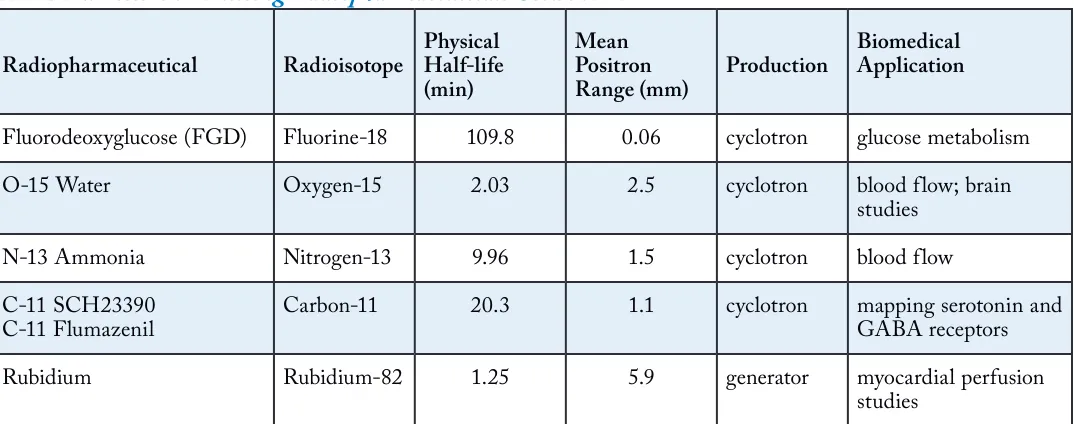
After a radiopharmaceutical is injected intravenously into a patient’s bloodstream, it is distributed throughout the patient’s body and accumulates in the organ or body system being examined where positrons [(e+) or anti-matter] are emitted and travel in the surrounding tissue dispersing kinetic energy until they encounter and collide with one of many nearby electrons [(e-) or matter]. During the collision, the two particles combine and destroy each other in a process that physicists refer to as annihilation. The distance that a positron travels in tissue before anni-hilation depends on the kinetic energy of the positron when it is emitted. Usually, this distance varies from one to two millimeters (Table 2).
TABLE 2. Positron-Emitting Radiopharmaceuticals Used in PET*
Radiopharmaceutical Radioisotope
Physical Half-life (min)
Mean Positron Range (mm)
Production
Biomedical Application
Fluorodeoxyglucose (FGD) Fluorine-18 109.8 0.06 cyclotron glucose metabolism
O-15 Water Oxygen-15 2.03 2.5 cyclotron blood flow; brain
studies
N-13 Ammonia Nitrogen-13 9.96 1.5 cyclotron blood flow
C-11 SCH23390 C-11 Flumazenil
Carbon-11 20.3 1.1 cyclotron mapping serotonin and GABA receptors
Rubidium Rubidium-82 1.25 5.9 generator myocardial perfusion
studies
The annihilation results in a burst of electromagnetic energy that is manifested in the discharge of two 511-keV gamma rays (according to Einstein’s famous equation: E = mc2). As shown in Figure 3, the two gamma rays are discharged “coincidentally” 180 degrees apart, and they travel outward in opposite directions from each other, forming a coincidence line. The coincidence line, which is an indicator that annihilation has occurred somewhere along its trajectory, serves as a vital component in the detection scheme by which PET images are created.
FIGURE 3. Illustration of the discharge of
2 gamma rays at 180 degrees from each other
when a positively-charged positron collides with a
negatively-charged electron.
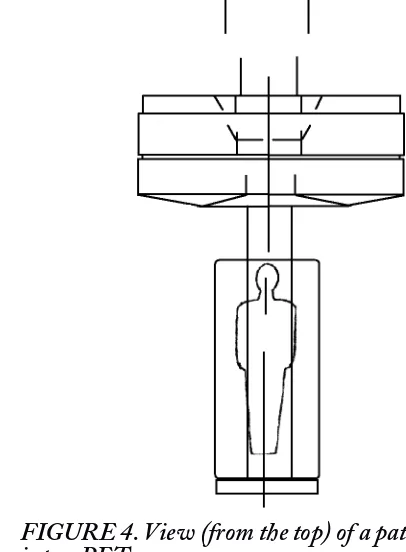
Coincidence Imaging
The two gamma rays, speeding away in opposite direc-tions (180 degrees apart) from each other, are detected on opposite sides of the patient’s body by a PET scanner or gamma camera that surrounds the patient as he or she moves slowly through the scanner as shown in Figure 4. This sort of coincidence detection is possible because the detectors (thousands of them) are arranged in a ring configuration around the interior of the scanner, with each detector having an associate partner detector on the opposite side of the ring. In some instances, each detector consists of a scintillating crystal and a photo-multipler tube. A more recent, more common configu-ration is the block detector, which as Figure 5 shows, consists of a rectangular bundle of crystals (referred to as a block) optically coupled to several photomultipliers. Invented by Ronald Nutt, electrical engineer and co-founder of Computer Technology Imagery, Inc. (CTI, Inc.) in the 1980s, the block detector has lowered the cost of the PET scanner by decreasing the number of optical detectors needed.
When a gamma ray is sensed by a detector, the gamma ray activates the scintillation crystal, which converts it into a burst of light photons. The light photons are detected and amplifiedevent that is registered by the electronics of the scanner. The types of scintillation crystals most
com-monly used in PET scanners include bismuth germinate oxide (BGO), thallium-doped sodium iodide (NaI TI), and lutetium oxyorthosilicate (LSO). The BGO crystals, which in the recent past have generally been used in con-ventional PET imaging, have high spatial resolution, and are 50% percent more efficient than NaI (IT) crystals. BGO detectors are best suited for imaging isotopes with long half-lives, such as Fluorine-18 and Carbon-11. LSO crystals offer the best combination of properties for PET imaging because they have a higher number of protons per atom and density when compared to BGO, which results in higher detection efficiency.12
FIGURE 4. View (from the top) of a patient moving
into a PET scanner.
FIGURE 5. A block detector consisting of a 7 x 8
array of crystals coupled to four photomultiplier tubes.
two events occurring on opposite sides of the patient are actually coincident. Based on that time frame, if two coincidence gamma rays are detected and recorded within nanoseconds of each other, the detectors register an anni-hilation/coincidence event as valid and record it.
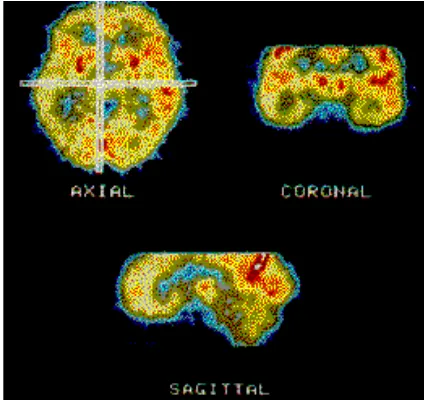
The PET scanner collects all coincident events (usu-ally about 500,000 events) and sorts them in the form of lines into a sinogram (Figure 6), which stores informa-tion in a way that is favorable for image reconstrucinforma-tion. The sinogram is then reconstructed with corrections by a computer linked to the scanner to produce a two-dimen-sional image, using algorithms similar to those employed in computed tomography (CT), magnetic resonance imaging (MRI), and single photon emission computed tomography (SPECT). The image, which can be viewed in axial, sagittal, or coronal planes (Figure 7), depicts the localization and concentration of the radiopharmaceu-tical within the organ or body system that was scanned. All commercially available PET scanners simultaneously acquire data for three-dimensional images, either by imaging the entire volume as a unit or by stacking adja-cent two-dimensional slices.1,4,12,19
FIGURE 6. A sinogram with coincidence lines.
FIGURE 7. PET images can be viewed in axial,
coronal, or sagittal planes.
In sum, PET works in the following manner.
A radiopharmaceutical containing a positron-emitting radioisotope is administered intravenously into the patient’s bloodstream.
The radiopharmaceutical is distributed through the body via blood circulation, accumulating in the organs or body systems being studied.
The radioisotope decays, emitting positrons.
A positron (e+), the antimatter equivalent of an electron, disperses most of its kinetic energy as it passes through the body’s tissue environment before colliding with one of the nearby electrons (e-).
During the collision, the positively-charged positron and the negatively-charged electron destroy each other and annihilation occurs.
The annihilation results in a burst of
electromagnetic energy that is manifested in the discharge of two 511-keV gamma rays 180 degrees apart, traveling outward in opposite directions along a line that passes through the point of annihilation.
The PET scanner detects the gamma rays outside the patient’s body. The detection of a gamma ray happens in this way.
A gamma ray is sensed by one of the scanner detectors, each of which is comprised of scintil-lation crystal and a photomultipler tube or alter-natively as a block detector that consists of rect-angular bundle of crystals optically coupled to several photomultiplers.
When the gamma ray interacts with the scintil-lation crystal, its energy is converted to a burst of light photons.
The photons are detected and amplified by the photo-multiplier.
The photomultiplier then generates an electronic signal and sends it to the electronics of the scanner.
The scanner electronics record the electronic signals and determine which of the electronic signals are coincident. Coincidence is determined in this way.
The electronics of the computer employ a time frame or coincidence window.
Based on that time frame, if two coincident gamma rays are detected on opposite sides of the patient’s body within nanoseconds of each other, the computer pairs and records them into coincident events, forming a coincidence line.
A computer linked to the scanner reconstructs the coincident event information into images that portray the activity of the radiopharmaceutical in the patient’s body. The image is reconstructed in this way.
*
*
*
*
*
*
*
•
•
•
•
*
•
•
The PET scanner collects all coincident events and sorts them into a sinogram.
The sinogram is reconstructed with correc-tions by the computer to produce two- or three-dimensional images using algorithms similar to those employed in CT and MRI.
THE PET scan ProcEDurE
After undergoing a preliminary review of his or her medical history and a blood glucose test, the patient receives an IV-injection of a positron-emitting radio-pharmaceutical that was recently synthesized from a cyclotron-manufactured, positron-emitting radioiso-tope. In less than an hour while the patient relaxes, the radiopharmaceutical, which is mildly radioactive, disperses throughout the body via the blood stream and accumulates in the organ or system being evalu-ated. The amount of radiation exposure is minimal— less, actually, than the radiation dose from many x-ray procedures. The particular radiopharmaceutical is chosen based on its affinity for a particular organ or body system. The time required for a radiopharmaceu-tical’s distribution and accumulation varies, depending on the radiopharmceutical.
After allowing for the appropriate time for the dis-tribution and accumulation of the radiopharmaceutical, the PET technologist, a skilled medical professional who has received specialized education in patient care, radiation protection, radiopharmaceuticals, and nuclear medicine techniques, positions the patient comfort-ably on a narrow table called a scanning bed that moves slowly through the PET scanner or gamma camera. As the scanning bed moves, the processes of coincidence detection and coincidence imaging take place, resulting in a series of thin slices of the organ or body system being evaluated. The slices are later reconstructed into a three-dimensional image depicting the localization and concentration of the radiopharmaceutical in that organ or body system. It is imperative that the patient be made as comfortable as possible, because he or she must remain quiet without moving during the entire scan-ning procedure (for 30 minutes to two hours, depending on the procedure) to assure high quality images at the end of the procedure. Certain measures, such as the use of special cushions to hold the head in place or a mask with holes for the eyes, nose, and mouth that is tied to the scanning bed, may be used in instances when patients are undergoing PET scans of the head to keep the head from moving.
The PET scanner (or gantry) is very much like the donut-shaped scanner used in CT scanning but unlike the MRI whole-body tube that contains the MRI scanner. The PET scanner contains thousands (about 12,000) of detectors that contain special scintillation crystals that produce electronic signals when they are struck by gamma rays. An emission scan is created as the scintillation
crys-•
•
tals detect the gamma radiation produced outside the patient’s body by the collision, interaction, and annihi-lation of the radiopharmaceutial’s emitted positrons with electrons from the patient’s body. Using algorithms sim-ilar to those used in CT and MRI, a computer linked to the PET scanner reconstructs the patterns of detected radiation and displays them as images on a monitor or video screen. Different colors and degrees of brightness in the images signify different levels of body function. In the instance of oncologic studies where a glucose-based radiopharmaceutical is used, healthy tissue will show up on the image as background area while cancerous tissue will appear as much brighter foreground because it will have absorbed more of the radiopharmaceutical than the normal tissue, since most cancerous tissue has the innate propensity to metabolize more glucose [as much as 20 times more] than normal tissue.5,18,29
After the procedure, patients are encouraged to urinate because radiopharmaceuticals, for the most part, tend to accumulate in the bladder. In addition, patients are urged to drink plenty of liquids for the remainder of the day and to urinate frequently to assure elimination of the radio-pharmaceutical from their systems as quickly as possible. As noted in Table 2, the radioisotope component of a radiopharmaceutical has a relatively short half-life, such that most of the radioisotope radiation typically becomes a nonissue within the first four to eight hours following the injection.18
In addition to the emission scan, the PET technolo-gist performs a transmission scan at some time during the procedure using an external radiation source, similar to that of CT, to measure the patient’s unique attenua-tion factors. This measurement of attenuaattenua-tion is stored, so that a correction factor can be applied to every subse-quent emission scan.
PET scans are usually performed as outpatient proce-dures. Following the procedure, the PET technologist processes and films the information from the scan. Then, the resulting images are analyzed and interpreted by a nuclear medicine physician. Finally, a report based on the physician’s findings is sent directly to the physician who ordered the PET study.30,31
In sum, the PET scan procedure occurs in the fol-lowing steps:
The radiopharmaceutical is synthesized from a cyclotron-produced, positron-emitting radioisotope on site or it is transported from an off-site location to the imaging site.
The PET technologist administers the radiopharmaceutical to the patient via IV and allows time for its distribution throughout the body.
As the patient moves slowly through the scanner on a scanning bed, the radiopharmaceutical’s emitting positrons (e+) collide with patient’s electrons (e-).
*
*
As the collisions occur, annihilation and the discharge of gamma rays follow and detectors in the PET scanner detect gamma rays outside the patient’s body.
The scanner electronics determine which of the gamma rays are coincident and pairs them into coincident events.
A computer linked to the scanner constructs, from the coincident event information, images that portray the activity of the radiopharmaceutical in the patient’s body.
A radiologist analyzes and interprets the images and sends the resulting information to the physician who ordered the PET study.
PET scan moDEs
PET scans can be derived in any one of several modes. One common mode is the whole-body static mode, which is, in essence, a snapshot of the patient’s physi-ology. Another mode, a more active dynamic mode, por-trays radiopharmaceutical uptake over time. Other modes include the gated mode, which reproduces the cardiac cycle in a series of images, and the three-dimensional-volume-imaging mode, which is known for its ability to improve image quality and reduce scan time.1,32
raDIoPHarmacEuTIcals In PET
In addition to the use of a PET scanner and computer, the PET imaging process requires the use of radiophar-maceuticals. Most radiopharmaceuticals contain two components: a carrier molecule that contains a natural substrate, such as glucose, and a positron-emitting radio-isotope that labels the carrier molecule. Bound to each other, the carrier molecule and the positron-emitting radioisotope make it possible for the PET scanner to detect, record, and image the results of the collision and interaction of emitted positrons with electrons inside the body in the form of gamma radiation detected outside the body. It is important to point out that the radioisotopes used in PET radiopharmaceuticals mimic substances, such as sugars, water, proteins, and oxygen-substances that occur naturally in the human body, and it is for this reason the radioisotopes can be used to label natural substrates without altering the substrates’ biological and chemical properties.
Most of the radioisotopes used in PET radiopharma-ceuticals are manufactured in a cyclotron (Table 2). The cyclotron is a machine that accelerates protons by moving them along a circular orbit inside a chamber controlled by powerful electromagnetic fields until the protons’ velocity is near the speed of light and smashes them into the nuclei of stable or nonradioactive elements (e.g., flu-orine, nitrogen, oxygen, and carbon), transforming the nonradioactive elements into positron-emitting
radioac-*
*
*
*
tive isotopes. The excess protons acquired by the newly created radioisotopes during the particle acceleration process that takes place in the cyclotron, cause the radio-isotopes to be unstable, such that they decay by positron emission-in keeping with their innate propensity to revert back to their stable state. Because they instinctively try to return to their original stable state, PET radioisotopes have short half-lives. While it is true that these short half-lives complicate the PET procedure because of the time constraints they impose, it is this very feature that contributes to the low-risk profiles of PET radiophar-maceuticals. Together the short half-lives of PET radio-pharmaceuticals along with their low levels of radiation make them ideal choices in terms of safe levels of radia-tion for the patient.
Based on the body function that they measure, PET radioisotopes can be divided into three categories. The first category includes radioisotopes, such as Fluorine-18, that are used to measure such general metabolic data as glucose uptake and protein synthesis. First cate-gory radioisotopes leave the bloodstream and enter cells. Quite contrarily, the second category of radioisotopes, which includes Oxygen-15, remain in the bloodstream throughout the study duration, making them appropriate candidates for measuring blood flow. The third category radioisotopes, such as Carbon-11, quantify and delineate cellular receptors.
The four most commonly used PET radioisotopes are Fluorine-18 , Nitrogen-13, Oxygen-15, and Carbon-11; their half-lives are 109.8 minutes, 9.96 minutes, 2.03 minutes, and 20.3 minutes, respectively. Because their half-lives are short, the manufacture of these radioiso-topes and their transformation into PET radiophar-maceuticals must take place inside or close to the PET imaging site where they are to be used. The exception is Fluorine-18 whose half-life of 109.8 minutes permits the radiopharmaceutical of which it is a component, to be transported to and used on other local PET imaging sites, as well as sites in other cities and states. PET radio-pharmaceuticals are usually synthesized a single dose at a time and administered to the patient within minutes after their synthesis.12,33
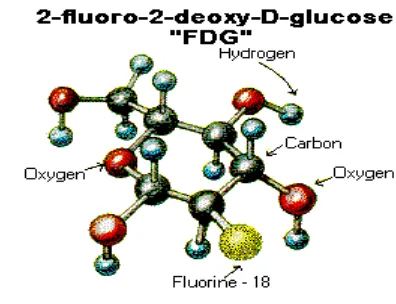
fluoroDEoxyglucosE (fDg)
Of the four radiopharmaceuticals currently used in PET imaging, FDG (Figure 8) is the most widely used-so widely used, in fact, that its namesake, “FDG,” has become synonymous with the term, “radiopharmaceu-tical.” There are two key reasons for FDG’s widespread popularity. The first reason, as noted previously, is that its radioisotope component, Fluorine-18, has a longer half-life (110 minutes) than the other radioisotopes used in the biosynthesis of PET radiopharmaceuticals, thereby per-mitting more flexibility in transport time to PET sites and administration to patients. The second reason for FDG’s widespread popularity is that its carrier compo-nent, glucose, a monosaccharide sugar (C6H12O6), hap-pens to be the principal circulating sugar in the blood and the body’s major source of energy. The fact that glu-cose is ubitiquously distributed in the human body [the brain, for instance, requires a supply of glucose equivalent to 250 M & M candies per day to function] together with the glucose orientation of FDG’s carrier molecule accen-tuates the practicality of employing FDG in the applica-tions of oncology, neurology, and cardiology where the radiopharmaceutical’s uptake in biological tissue is a major contributor to the illustration of glucose metabolism and a marker of cell dysfunction in the human body. FDG provides, without question, the widest range of clinical utility among the PET radiopharmaceuticals. The clin-ical utility of FDG in the applications of oncology, neu-rology, and cardiology will be discussed in depth in the final article in the PET series.
FIGURE 8. A Chemical Sketch of FDG
Because of its glucose orientation, FDG competes with the body’s glucose for entry into the body’s cells to become a part of the intracellular metabolism. But unlike glucose, which continues on with the cell’s metabolic process, FDG does not proceed past the phosphoryla-tion stage; it remains in the cell, where it is detected and imaged during the PET procedure.
During an FDG-PET scan procedure, most cancer cells ingest more glucose-based FDG than normal cells [about 20 times more, some sources say], because cancer cells thrive on a higher rate of metabolism than
normal cells, since they divide and grow more quickly than normal cells. For this reason, the cancer-infested areas of abnormal [increased] metabolic activity appear as “hot spots” or highly illuminated areas on a PET scan. Abnormal metabolic activity manifested as “hot spots” on a PET scan may also be an indication of heart disease or brain disorders (Figure 9).5,16,19,32,34
FIGURE 9. Whole-body scan with hot spots. This
patient with metastatic melanoma was thought to
have a single lesion in his leg. This scan revealed
unsuspected metastases.
oBsTaclEs To THE wIDEsPrEaD
usE of PET
PET has many benefits that include early detection and intervention, the elimination of other more invasive procedures, pre-surgical assessment, identification of dis-tant metastases, replacement of multiple tests, and as a monitor of treatment efficacy. Unfortunately, these ben-efits have been counterbalanced with a number of obsta-cles that have deterred the widespread use of PET. The major obstacles have had to do with the high cost of dedi-cated PET equipment, the intricacies of setting up a PET system, and the battle over insurance reimbursement for PET services.
DEDIcaTED PET EquIPmEnT
high-ticket items, the use of PET has been restricted, thus far, to major research institutions and well-endowed medical centers in large cities. Recently, the prices of nondedi-cated systems (usually hybrid SPECT cameras that come equipped with coincidence-detection circuitry) ranging from $500,000 to $750,000, have placed PET within the financial grasp of smaller institutions. Nondedicated scanners consist of a camera with two large area scin-tillation detectors situated 180 degrees apart that rotate and detect the annihilation of the gamma rays in coin-cidence. A major concession of the nondedicated PET systems is that efficiency and sensitivity are somewhat compromised when compared to that of the dedicated PET systems. It is important to point out, however, that the less expensive, nondedicated PET systems are able to provide information that other imaging modalities, such as CT, MRI, and ultrasound are unable to provide, and that they are viewed by many as attractive alternatives in some non-oncologic situations.17,34
A word about PET scanner or camera trends. Conventional whole-body cameras are being used to image any part of the body with only relatively small gains in terms of cost/performance tradeoffs. Currently, cameras especially designed for imaging specific organs of the body, such as cameras for imaging breast cancer, are being developed. These cameras are expected to sport large performance gains as a tradeoff for limited body coverage. Another camera trend is that of imaging small animals, typically mice and rats. The impetus for development of these cameras, referred to as MicroPET scanners, has been the reality that experiments using these small animals require much higher resolutions (8 microliters spatial resolution) than the resolutions achieved in human PET scanners (64 microliters spatial resolution). The higher resolutions in MicroPET scan-ners, which are being achieved by using smaller scin-tillator crystals and multianode photomultiplier tubes, permit researchers to conduct serial and longitudinal studies with mice and rats as subjects. In these studies, researchers are able to follow a single animal over time as they monitor the effects of interventions on disease progression and outcome.16,35
As another way of combating the high cost of dedicated PET equipment, some medical centers have been opting for the services of PET radiopharmacies-companies that manufacture and distribute radiopharmaceuticals. Of the PET radiopharmaceuticals, FDG is the best candidate for radiopharmacy distribution because the 110-minute half-life of the radioisotope [Fluorine-18] from it is synthesized, allows time for the radiopharmaceutical to be transported from radiopharmacy to waiting PET imaging destina-tions. In the year 2000, a UCLA technology publication reported that 50% of hospitals in the United States had PET radiopharmacies located within a 100-mile radius and that the number of PET radiopharmacies was steadily increasing. Radiopharmacies are also located throughout Canada, Europe, Asia, and other parts of the world.17
Yet another way that some resourceful medical centers are combating the high cost of dedicated PET equipment is by opting for mobile rather than fixed PET scan units. Some hospitals become part of a mobile PET-sharing arrangement where they split the leasing of a mobile unit to minimize financial risk while ascertaining the volume of service that will fill the needs of their organization. Other hospitals use mobile scanners in the transition period while they are making plans to install fixed units. Then, there are the organizations whose projected utilization of a PET scanner is moderate at best, making their participation in a mobile PET-sharing arrangement their only means of offering PET services. In these arrangements, PET scan-ners are mounted on trailers and transported on a regular schedule from one medical center to another across the state or even across state lines to neighboring states.36
sETTIng uP a PET sysTEm
Setting up a PET system requires painstaking planning, which typically includes significant renovation, unless plans call for building a new facility. Generally, some-where around 2,000 square feet are required to properly house a complete PET scan unit, but individual differ-ences can substantially change that requirement. Usually, a PET scan unit will include a procedure room (the room where the PET scan is conducted) that is very similar to a CT scan facility, an equipment control or operator’s room, a patient waiting room, a patient prep area, and a patient toilet. If radiopharmaceuticals are to be manufactured on site, a cyclotron room is added to the plan. Within the cyclotron room would be radiochemistry/radiopharmacy areas used for the preparation and dispensing of radio-pharmaceuticals. Within the radiopharmacy areas would be the hot cells where the synthesis of the PET radio-pharmaceutical would to be completed.
Setting up a PET system also requires providing spe-cial training and education for the staff. Personnel will usually need to be trained to minimize patient contact time after administration of the radiopharmaceutical, to maximize distances from high radiation sources, and to properly use barriers and shielding. Obtaining training materials [geared for training personnel] has been a chal-lenge for some of the organizations setting up hybrid systems, mainly because of the newness of hybrid sys-tems. More recently, the personnel training material has become more plentiful as the use of the radiopharmaceu-tical, FDG, has spread.
PET scan rEImBursEmEnT
Until recently, the reluctance of third-party payers, such as Medicare, Medicaid, private insurers, and health maintenance organizations (HMOs), to provide reim-bursement for PET scans was an obstacle to the wide-spread use of PET. Because PET was considered an investigative or research procedure by many third-party payers, providers of PET services were forced to go to great lengths and to expend inordinate amounts of time to obtain preapprovals for PET services, a number of which were not ultimately reimbursed.
The financial obstacles have been diminishing since the mid and late 1990s when the Heath Care Financing Administration (HCFA) began to approve insurance reimbursement for more and more PET scan indica-tions.11,37,38 Late in 2000, the HCFA expanded Medicare reimbursement to include treatment for six cancers: lung, colorectal, lymphoma, melanoma, head and neck, and esophageal. The coverage in each of these cancers ranges from diagnosis and staging to assessment of therapy and recurrence of disease. The HCFA additionally recom-mended coverage for assessing myocardial viability and imaging the relocation of refractory seizures. A positive ramification of the expansion of the Medicare reimburse-ment guidelines is that private insurers generally follow them on reimbursement guidelines.38
conclusIon
PET is an exciting nuclear medicine technique that enables the evaluation of the chemical and physiological changes associated with the metabolic processes in the human body via the use of non-invasive diagnostic imaging procedures. These imaging procedures are derived from the physics-based activities that occur when a radiophar-maceutical containing a positron-emitting radioisotope is injected into a patient’s body. The physics-based activities culminate in the manifestation of electromagnetic energy that is detected and tracked by intricately designed PET scanners or cameras. The detection and tracking of the electromagnetic energy serve as data that are transformed by a PET technologist into diagnostic images that are analyzed and interpreted by a radiologist and presented in report form to the referring physician.
The benefits that have come forth from the mastery of the PET technique (early detection and intervention, non-invasive procedures, and monitor of treatment effi-cacy—to name a few) were for a time stymied by a number of obstacles that deterred the widespread use of the pro-cedure in the clinical sector. These obstacles included the high cost of dedicated PET equipment, the intricacies of setting up a PET system, and the battle over insurance reimbursement for PET services. Fortunately, resource-fulness on the part of impassioned thought leaders and resolute medical centers—working to bring about radio-pharmacies, mobile PET-sharing arrangements, and
PET scan reimbursement—has successfully overcome enough of the obstacles, such that PET has undergone an apparent, steady transition-a transition that has cata-pulted it from its long-standing position in a sophisti-cated research environment to its coming of age in the clinical sector.
rEfErEncEs
Positron Emission Tomography: An Introduction. GE Medical Systems. Available at: http://www.gehealthcare.com/euen/ patient/nuclear-medicine-and-pet/exam.html#1. Accessed August 17, 2011.
Schewe P, Stein B. Sharper, Cheaper PET Scans. American Institute of Physics. May 16, 1996. Available at: http://www. aip.org/enews/physnews/1996/split/pnu271-1.htm. Accessed August 17, 2011.
What is PET? University of Texas Houston Science Center. Available at: http://www.uth.tmc.edu/pet/patients/pet-what-is-pet.htm. Accessed August 17, 2011.
Positron Emission Tomography. Available at: http://legacyweb. triumf.ca/welcome/petscan.html. Accessed August 17, 2011. Hamamatsu/Queen’s PET Imaging Center - FAQ. The Queen’s Medical Center. Available at: http://www.queenspet-center.com/faq.html. Accessed August 17, 2011.
Molecular PET and CT Imaging Center of Excellence. The University of Texas MD Anderson Cancer Center Website. Available at: http://www.mdanderson.org/education-and- research/research-at-md-anderson/cancer-imaging-network-of-texas/centers-of-excellence/molecular-pet-and-ct-imaging/index. html. Accessed August 17, 2011.
Brice J. Award winners confirm imaging’s essential role in medical practice. Diagnostic Imaging Online. January 2002. Available at: http://www.diagnosticimaging.com/dinews/0201. diawards.di.shtml. Accessed August 17, 2011.
Alumni Profile: Dr. Ronald Nutt. The University of Tennessee College of Engineering. Available at: http://www.engr.utk.edu/ tnengr/fall_00/alumprof.htm. Accessed August 17, 2011. Phelps ME, Cherry SR. The changing design of positron imaging systems. Clin Positron Imaging. 1998;1:31-45. Converting energy to medical progress: 50-year commit-ment to improved healthcare though nuclear medicine (Vital legacy of BER medical sciences). Available at: http://www. doemedicalsciences.org/pubs/sc0033/vital.shtml. Accessed August 17, 2011.
Coleman RE, rev. What is PET? About Nuclear Medicine Webpage. Society of Nuclear Medicine Website. Available at: http://interactive.snm.org/index.cfm?PageID=972&RPID=31 06. Accessed August 17, 2011.
Nutt R. Is LSO the future of PET? Eur J Nucl Med Mol Imaging. 2002;29:1523-5.
Surti S, Karp JS, Kinahan PE. PET instrumentation. Radiol Clin North Am. 2004;42:1003-16.
PET/CT Patient Information. Alliance Imaging, Inc. Website. Available at: http://www.alliancehealthcareservices-us.com/ ?s=positron+emission+tomography. Accessed August 17, 2011. 1.
2.
3.
4.
5.
6.
7.
8.
9.
10.
11.
12.
13.
Nutt R, Melcher CL. Current and future developments with LSO, a scintillator with excellent characteristics for PET. Revue de I’ACOMEN. 1999;5:152-5. Available online at: http://www. univ-st-etienne.fr/lbti/acomen/revue/1999/pdf/pdf2/nutt.pdf. Accessed August 17, 2011.
Moses WW. Trends in PET imaging. Nucl Instrum Methods Phys Res A. 2001;471:209-14.
Hinton W. Planning for PET. Gene Burton and Associates. Available at: http://www.gbainc.com/Bios.aspx?person=hinto n&dept=Medical%20Technology%20Project%20Managers. Accessed August 17, 2011.
PET Scan. Aetna InteliHealth Wesite. Available at: http:// www.intelihealth.com/IH/ihtIH/WSIHW000/9339/23828/ what. Accessed August 17, 2011.
Wagner HN Jr. A brief history of positron emission tomog-raphy. Semin Nucl Med. 1998;28:213-20.
Brownell GL. Radiopharmaceutical development for PET imaging. From: A History of Positron Imaging presentation given at Massachusetts General Hospital on October 15, 1999. Manuscript available online at: http://www.petdiagnostik.ch/ PET_History/alb.html. Accessed August 17, 2011.
Nutt R. 1999 ICP Distinguished Scientist Award. The his-tory of positron emission tomography. Mol Imaging Biol. 2002;4:11-26.
Stephenson, G. Hopkins first in U.S. to get commercial PET/ CT scanner. Johns Hopkins Medical Institutions Office of Communications and Public Affairs. 2001. Available at: http:// www.hopkinsmedicine.org/press/2001/JUNE/010621.htm. Accessed August 17, 2011.
Jaroff L. Inventions of the year: a winning combination. Time Magazine. December 4, 2000.
Townsend DW. Dual-modality imaging: combining anatomy and function. J Nucl Med. 2008;49:938-55.
Townsend DW, Beyer T, Kinahan PE, et al. The SMART scanner: a combined PET/CT tomograph for clinical oncology. IEEE MIC, Toronto, Canada, M5-01, 1998. Available at: http://ieeexplore.ieee.org/Xplore/login.jsp?url=http%3A%2 F%2Fieeexplore.ieee.org%2Fiel5%2F6268%2F16740%2F00 774368.pdf%3Farnumber%3D774368&authDecision=-203. Accessed August 17, 2011.
Newport Diagnostic Center. PET/CT Patient Brochure. Available at: http://www.newportdiagnosticcenter.com/ Portals/129/petCTBrochure.pdf. Accessed August 17, 2011. Wilson, J. Whole-Body Medical Scans. Whole-body medical scans will buy you peace of mind--or sleepless nights. Popular Mechanics. July 2002.
Ollinger JM, Fessler JA. Positron-emission tomography. Signal Processing Magazine, IEEE. Jan 1997:14,(1):43-55.
Sabbatini RME. The PET Scan: A New Window into the Brain. Brain and Mind Magazine website. Available at: http:// www.cerebromente.org.br/n01/pet/pet.htm. Accessed August 17, 2011.
Positron Emission Tomography. Radiology Info web-site. Available at: http://www.radiologyinfo.org/en/info. cfm?pg=pet. Accessed August 17, 2011.
Positron Emission Tomography Scanning. Available at: http:// www.ebme.co.uk/arts/pet.htm. Accessed June 19, 2009. 15.
16.
17.
18.
19.
20.
21.
22.
23.
24.
25.
26.
27.
28.
29.
30.
31.
Position Emission Tomography. Saint Barnabus Ambulatory Care Center website. What is PET? Available at http://www. saintbarnabas.com/pet/what/index.html. Accessed August 18, 2011.
Sabbatini RME. The Cyclotron and PET. Brain and Mind Magazine website. Available at: http://www.cerebromente.org. br/n01/pet/pet.htm. Accessed August 17, 2011.
Medical Sciences Division of the Office of Biological and Environmental Research of the Office of Science of the U.S. Department of Energy. Converting Energy to Medical Progress. April 2001. Booklet available at: http://www.doemedi-calsciences.org/pubs/sc0033/DOESC0033sc.pdf. Accessed August 17, 2011.
Chatziioannou AF, Cherry SR, Shao YP, et al. Performance Evaluation of microPET: high-resolution lutetium oxyor-thosilicate PET scanner for animal Imaging. J. Nucl Med. 1999;40:1164-75.
Rice WW and Grice S. PET scanning: wave of the future.
ACE Update [Association of Cancer Executives]. January/February 2001;3:5.
Middleton ML, Shell EG. Nuclear medicine application in the clinical setting. Imaging studies aid disease staging and man-agement. Postgrad Med. May 2002;111:89-90, 93-6.
Smith WJ. Medicare to reimburse for lung cancer PET imaging. J. Nucl Med. 1998;39:22N.
32.
33.
34.
35.
36.
37.