The Influence Analysis of Product Perception, Shopping Experience and Customer
Service towards consumer decision on online shopping
Submitted by:
Annisa Indah Fitriana
NIM: 605081000029
MANAGEMENT DEPARTMENT INTERNATIONAL PROGRAM
FACULTY OF ECONOMICS AND SOCIAL SCIENCES UNIVERSITAS ISLAM NEGERI SYARIF HIDAYATULLAH
AUTO BIOGRAPHY
I. SELF IDENTITY
Name : Annisa Indah Fitriana Place/ Date of Birth : Jakarta, 21 June 1987
Religion : Islam
Address : Vila Bintaro Indah A8 No18 Phone No : (021) 7454387
Email : [email protected]
II. EDUCATIONAL BACKGROUND
- State Islamic University Syarif Hidayatullah, Jakarta
(2005 – 2010) - Northern University of Malaysia (2007 – 2010)
III. FAMILY BACKGROUND
1. Father : Muhammad Saleh Sugandhi
2. Place/ Date of Birth : Semarang, 19 January 1954
3. Mother : Widjiasti Anggraini
ABSTRACT
Information technology during the 1990s has become a major contribution to increase productivity in a company. This requires each corporations and businesses competing to take advantage of technological superiority information to improve their bargaining position and the quality of service. Use information technology in the process of creating ideas, communicate, and send values to consumers as well as maintaining relationships with customers by a company called E-marketing. Companies can run their businesses to offer and sell their products and consumers can find information about a product that they want to require internet media. Internet can provide facilities for the marketers in order to save production costs, which the company eventually could sell their products with lower prices and provide a high enough value to consumers. And consumers on the other hand also can easily find information about a product they want and obtained the desired goods and transact with sellers only by opening the vendor’s website. With so many advantages that can be obtained by online shopping, it is expected that the today’s consumers can change the attitude and behavior intention to seek information and make purchases via internet (online shopping). This research is about analysis influence of online shopping on consumer decision and behaviors on internet shopping. The research identify on two variables which are independent and dependent variable. Independent variables are product perception (X1), shopping experience (X2) and customer service (X3). For dependent variable is the influence of consumer decision on online shopping (Y). In gaining data, researcher took 100 internet users as sample as it chosen by the researcher randomly. The result of research has been gained, based on coefficient determination about .316 and adjusted coefficient determination about .291 it was concluded that product perception (X1), shopping experience (X2) and customer service (X3) effect approximately 29.1% on dependent variable and the rest of it about 70.9% explained by unknown factors which is excluding on this research and out of this regression analysis.
PREFACE
Alhamdulillahirabbil’alamin, In the name of Allah, the beneficent, the most merciful. All praises be to him, the lord of the World, as benefits His glory and the greatness of His Power. I am grateful to Him for the blessings bestowed upon me, and for honoring me with His aid in finishing this thesis in order to fulfill one of the requirement program in order to graduate as a bachelor of economy, on the topic I have chooses on “The Influence Analysis of product perception, shopping experience and customer service towards consumer decision on online shopping. Where the thesis has been well-made and can be easily understandable as what I have been expected. It’s a matter for me to bring out this thesis.
In this Opportunity I would like to thank for those who has been helping me in doing this thesis from the beginning until the end of the implementation of this thesis, they are:
1. Very big thanks to my parents, Mr. M. Saleh Sugandhi and Mrs. Widjiasti Anggraini. Thank you for each and every non stop supports, prayers, love, advises, spirits, etc beginning from days and nights. My sisters nana and sarah and my brother fariz.
2. Mr. Prof. Dr. Abdul Hamid, MS., as dean of faculty of economics and science State Islamic University Syarif Hidayatullah Jakarta and as my first supervisor who has guided me with patience. Thanks for your support and suggestion for me during finishing this thesis.
4. Mr. Arief Mufraini LC, M.Si. as head of international program and who has encourage me to completing this thesis. Thank for your support and suggestion for me.
5. Mr. Dumyati Bashori, MA. As the secretary of international program who has give me spirit and support to finishing this thesis.
6. Mr. Prof. Dr. Achmad Rodoni, MM. As the head Departmrnt of Management.
7. My friends Tami, Zul2, Astary, Dila who have help me and encourage me to completing this thesis. Thanks for your support and spirit guys.
8. My classmates in UIN who always giving me spirit, support all the time during sadness and happiness. Miss go to dufan with all of you guys.
9. Last but no Least a Special thanks to all Management Divisions of International Class Program Mba indah and Mas Hamdi who sacrifices their full time in Secretariat of Int’l Class and giving us support, patient managing Int’l Class students.
I realized that perfection is own by Allah and human being is just be able to endeavor. This report has been made according to my effort and knowledge which is still not end up till here, where I’m still keep on learning further more on how it supposedly be made. Hopefully this report can be useful for the next generations.
Jakarta, 13 March 2010
TABLE OF CONTENTS
Page
Page of Thesis Approval……… ii
Auto Biography……… ………iv
Abstract………. v
Preface……….. vi
Table of Contents……… ix
List of Table……… xii
List of Diagrams……….. xii
Chapter I BACKGROUND A. Background...1
B. Problem Identification ...6
C. Purpose of Study and The Use of Study...6
Chapter II LITERATURE REVIEW A. Ecommerce definition and concept ... 8
B. Marketing Concept ...12
C. Consumer Decision Making ...14
D. Model of Buyer Decision Making ...15
E. Interactive Decision for Online Shopping ...21
F. Product Perception ...22
H. Customer Service ...25
I. Previous Literature of Observation ...25
J. Theoretical Framework ...27
K. Hypothesis……….. .28
Chapter III RESEARCH METHODS A. Research Scope ...29
B. Sampling Methods ...29
C. Data Collection Methods ...30
D. Analysis Method……….. 32
E. Quantitative Analysis ...36
F. Operational Variable……… 44
Chapter IV FINDING AND RESULT A. General illustration of Research Object ...47
1. Location and Time of Research ...47
2. Characteristics of Respondent...47
B. Finding and result...51
1. Validity Test...52
2. Reliability Test……….54
3. Descriptive Analysis……… 55
C. Classical Assumption Test...68
1. Autocorrelation Test……… ..68
2. Multicolinearity Test ...70
3. Heterokedasity Test ...71
D. Multiple Linier Regression ...73
1. Correlation………...73
2. Coefficient Determination (R2) ...76
3. F Test ...78
4. T Test ...79
E. Interprets………81
Chapter V CONCLUSION IMPLICATION AND RECOMMENDATION A. Conclusion ...82
B. Implication………. ..83
LIST OF TABLES
Number Statements Page
3.1 Likert Scale Category……… 33
3.2 Category High and Low Reliability Instrument………. 35
3.3 Durbin Watson………38
3.4 Operation Variable Analysis……….. 46
4.1 Pre- Test of Variables……….53
4.2 Reliability Test……….. 55
4.3 Product Quality………. 56
4.4 Product Quantity……… 58
4.5 Lifestyle………..59
4.6 Effective and Efficient……….. 61
4.7 Reliability and Responsivenss………62
4.8 Form of Payment………. 64
4.9 Product Information……….. 66
4.10 Product Price………. 67
2.3 Histogram of influence of consumer decision on online shopping 72 2.4 Normal P – P Plot Curve……… 72
CHAPTER I
INTRODUCTION
A.
Background
Today, internet is a public, cooperative, and self-sustaining facility accessible to hundreds of millions of people worldwide. This research focuses on various factors influencing consumer decision on purchase online which has been found the most relevant behavioral characteristics of online consumers. The data were collected from a sample consisting of young adults with familiarity of computer use, online shopping experience and people who have lot of activities until make them don’t have much time to shopping in department store. Findings indicate that young adults with a history of e-commerce purchasing experience have a more positive attitude towards online buying than do young adults without e-commerce purchasing experience.
Marketers have identified many factors that influence a consumer’s purchase decision and online buying behavior (Jarvenpaa & Todd, 2006:20). Jarvenpaa and Todd (2006) classify these factors into four clusters of purchase perceptions that influence a consumer’s purchase decision. These clusters of purchase perceptions are: product understanding, shopping experience, and customer service.
determinants and includes the attributes of time, convenience and product availability, effort, lifestyle compatibility and playfulness or enjoyment of the shopping process (Capella, & Taylor, 2001: 45). Customer service, the third cluster that influences purchase decisions, includes vendor responsiveness, assurance, and reliability.
A structural equation model was employed to test hypotheses. According to the findings, utilitarian value of Internet information search, value of Internet information search, perceived benefits of Internet shopping, perceived risk of Internet shopping, and Internet purchase experience predicted the influence of consumer decision making and behavior on online shopping well.
fashion cities, online commerce has been eagerly embraced and consumers use the Web to buy fashion goods online Paderni, 2006:20). Of the 40 million customers who make up the online fashion shopper contingent, most are young, higher income females who used the web extensively (Paderni, 2006:20).
A unique characteristic of online shopping environments is that they allow vendors to create retail interfaces with highly interactive features. One desirable form of interactivity from a consumer perspective is the implementation of sophisticated tools to assist shoppers in their purchase decisions by customizing the electronic shopping environment to their individual preferences. The availability of such tools, which we refer to as interactive decision aids for consumers, may lead to a transformation of the way in which shoppers search for product information and make purchase decisions.
Specifically, we hypothesize that the way in which consumers search for product information and make purchase decisions is a function of the particular interactive tools available in an online shopping environment.
Online shopping has been a growing phenomenon in all four corners of the world, in particular amongst countries possessing highly developed infrastructure available for marketing activities through the internet. Today, internet is not only a networking media, but also a global means of transaction for consumers. Internet usage has grown rapidly over the past years and it has become a common means for information transfer, services and trade.
Nowadays, internet was quite familiar for most people in the world. The increasing of internet users attract vendor to sell and promote their product through internet marketing because more effective and efficient. Advertising through internet could reduce cost for advertising, because they don’t need spend lot of money for advertise such as advertise in magazine, news paper and so on. The social network sites trends become opportunities for the seller or vendor, because these sites not only for communicate or acquainted with other people with create biodata profile but also could be media to promote their product easily, and cheaply. They can directly communicate to consumer, with feedback communication seller know what consumer needs. The social network sites such facebook, twitter, frindster have been attracted people interest in the world, which is seen from the increase the number of users of social network sites.
services not matching the description on the website, and the risk of damage during the delivery process, etc. There seems little assurance that customers will receive the products or services comparable to the ones they ordered according to the description and image on the computer screen. Customers also do not know how the retailer will deal with the personal information collected during the shopping process. Therefore, trust is an important factor in the buyer-seller relationships in electronic commerce. Trust is also one of the most frequently cited reasons for consumers not willing to purchase online and plays a critical role in facilitating online transactions.
B.
Problem Identification
Specific objective is looking to some problems:
1. Is there any partially influence of product perception, shopping experience and customer service in order to form a consumer decision on online shopping?
2. Is there any simultaneously influence of product perception, shopping experience and customer service in order to form a consumer decision on online shopping?
C.
Purpose of Study and the Use of Study1. Purpose of Research
b. analyze frequency of consumer in the using online shopping.
2. The Use of Study
a. For the researcher, to increase knowledge, especially knowledge about the activity consumer in choosing online shopping. Also as the form of the implementation on the theory and knowledge those were received in the studying process.
b. For the student and the academic, as the addition of the scientific reading material to become one of the sources of knowledge towards the subject consumer behavior, especially concerning the application consumer preference.
c. For vendor on online shopping
CHAPTER 2
Literature Review
A. Ecommerce definition and conceptElectronic Commerce, commonly known as (electronic marketing) e-commerce or eCommerce, consists of the buying and selling of products or services over electronic systems such as the Internet and other computer networks which transactions or terms of sale are performed electronically (Reif, 2003:57). Electronic commerce that is conducted between businesses is referred to as business-to-business or B2B. Electronic commerce that is conducted between businesses and consumers, on the other hand, is referred to as business-to-consumer or B2C. Three primary processes are enhanced in e-commerce:
1. Production processes, which include procurement, ordering and replenishment of stocks, processing of payments, electronic links with suppliers and production control processes, among others
3. Internal management processes, which include employee services, training, internal information-sharing, video-conferencing, and recruiting. Electronic applications enhance information flow between production and sales forces to improve sales force productivity. Workgroup communications and electronic publishing of internal business information are likewise made more efficient.
This is the type of electronic commerce conducted by companies such as Amazon.com. In e-commerce concept, information and communications technology (ICT) is used in inter business or inter organizational transactions (transactions between and among organizations/firms) and in business to consumer (B2B) transactions (transactions between firms/organizations and individuals.
1. Types of Ecommerce
There are four types transaction in Ecommerce a. Business to Business (B2B)
B2B e-commerce is simply defined as e-commerce between
b. Business to Consumer (B2C)
Business-to-consumer (B2C) describes activities of businesses serving end consumers with products and/or services. A transaction that occurs between a company and a consumer opposed to a transaction between companies (called B2B). The term may also describe a company that provides goods or services for consumers.
Business-to-consumer e-commerce, or commerce between companies and consumers, involves customers gathering information, purchasing physical goods (i.e, tangibles such as books or consumers products) or information goods (or goods of electronic material or digitized content, such as software, or e-books); and, for information goods, receiving products over an electronic network (Paderni, 2006:18).
c. Consumer to Consumer (C2C)
commission. The sites are only intermediaries, just there to match consumers. They do not have to check quality of the products being offered. This type of e-commerce is expected to increase in the future because it cuts out the costs of using another company. The C2C Concept is based on the idea that anyone can click on a product on a website, but it doesn't really matter until and unless they put it in their shopping cart and purchase it. In other words, strictly focusing on just getting people to a website doesn't help unless they actually buy something from a website (Paderni, 2006:22).
d. Consumer to Business (C2B)
Consumer-to-business (C2B) is an electronic commerce business model in which consumers (individuals) offer products and services to companies and the companies pay them. This business model is a complete reversal of traditional business model where companies offer goods and services to consumers (business-to-consumer = B2C).
B. Marketing Concept
Marketing is an integrated communications-based process through which individuals and communities discover that existing and newly identified needs and wants may be satisfied by the products and services of others (Philip, 2000). Marketing be able to managing profitable customer relationships. The marketing concept is the philosophy that firms should analyze the needs of their customers and then make decisions to satisfy those needs, better than the competition.
In 1776 in The Wealth of Nations, Adam Smith wrote that the needs of producers should be considered only with regard to meeting the needs of consumers. While this philosophy is consistent with the marketing concept, it would not be adopted widely until nearly 200 years later.
The production concept prevailed from the time of the industrial revolution until the early 1920's. The production concept was the idea that a firm should focus on those products that it could produce most efficiently and that the creation of a supply of low-cost products would in and of itself creates the demand for the products.
The sales concept by the early 1930's however, mass production had become common place, competition had increased, and there was little unfulfilled demand. Around this time, firms began to practice the sales concept (or selling concept), under which companies not only would produce the products, but also would try to convince customers to buy them through advertising and personal selling.
C. Consumer Decision Making
Consumer decision process is the decision making processes undertaken by consumers in regard to a potential market transaction before, during, and after the purchase of a product or service (Morin, 2002:6). More generally, decision making is the cognitive process of selecting a course of action from among multiple alternatives.
According to Morin in generally there are three ways of analyzing consumer buying decisions. They are:
Economic models - These models are largely quantitative and are based on the
assumptions of rationality and near perfect knowledge. The consumer is seen to maximize their utility. See consumer theory. Game theory can also be used in some circumstances.
Psychological models - These models concentrate on psychological and cognitive
processes such as motivation and need recognition. They are qualitative rather than quantitative and build on sociological factors like cultural influences and family influences.
Consumer behavior models - These are practical models used by marketers. They
D. Models of Buyer Decision Making
There are five general models of buyer decision making process that are problem recognition, gathering information, alternative education, purchase decision, and Post-purchase behavior/buyer's remorse (cognitive dissonance) (Howard, 2003:8). According to Howard there are a range of alternative models, which most directly links to the steps in the marketing/promotional process is often seen as the most generally useful those are:
Awareness - before anything else can happen the potential customers must become
aware that the product or service exists. Thus, the first task must be to gain the attention of the target audience. All the different models are, predictably, agreed on this first step. If the audience never hears the message, they will not act on it, no matter how powerful it is.
Interest - but it is not sufficient to grab their attention. The message must interest them
and persuade them that the product or service is relevant to their needs. The content of the message(s) must therefore be meaningful and clearly relevant to that target audience's needs, and this is where marketing research can come into its own.
Understanding - once an interest is established, the prospective customer must be able
to appreciate how well the offering may meet his or her needs, again as revealed by the marketing research. This may be no small achievement where the copywriter has just fifty words, or ten seconds, to convey everything there is to say about it.
Attitudes - but the message must go even further; to persuade the reader to adopt a
it, albeit as a trial. There is no adequate way of describing how this may be achieved. It is simply down to the magic of the copywriter's art, or based on the strength of the product or services itself.
Purchase - all the above stages might happen in a few minutes while the reader is
considering the advertisement; in the comfort of his or her favorite armchair. The final buying decision, on the other hand, may take place some time later; perhaps weeks later, when the prospective buyer actually tries to find a shop which stocks the product.
Repeat Purchase - but in most cases this first purchase is best viewed as just a trial
purchase. Only if the experience is a success for the customer will it be turned into repeat purchases. These repeats, not the single purchase which is the focus of most models, are where the vendors focus should be, for these are where the profits are generated.
There are various factors affecting intention to search online:
1. Utilitarian value of online information search
The utilitarian value of online information search involves the external motive of consumers to use the Internet instrumentally as a source of problem solving. This type of value is usually linked to speed, efficiency, and ease to problem solving through the help of net navigation.
Hammond et al.(2007) suggest that novice Web users tend to appreciate the Web’s informational value more than its entertainment value, compared to more experienced Web users. Lin(1999) proposes that the motives which drive the use of online services media such as the Internet are different than those of the use of traditional media for instance TV, the former emphasizing entertainment, pastime, compilation of information rather than formation of community and problem solving.
2. Hedonic value of online information search
It has been acknowledged that consumers use different strategies while exploring a shopping environment depending upon the purpose or task of a particular shopping trip (Hirschman and Holbrook 2003). Hirschman (1999) introduced the notion that some consumers seek cognitive or informational stimulation, while others seek sensory stimulation in the consumption experience. Similarly, Babin, Darden and Griffin (2004) and Baumgartner and Steenkamp(2006) assert the importance to evaluate shopping as an experience in addition to its utilitarian outcomes (i.e. the goods or services acquired).
Look into these values from an online-based perspective. If the purpose of a shopping trip is to locate a particular item, the search process tends to be of a utilitarian or problem solving nature. If the main purpose of the trip is more fun oriented, then the search strategy involves more hedonic or experiential behavior. The hedonic value of online information search is associated with the fun and enjoyment of the online search process. The flow construct in the studies of Novak, Hoffman, and Duhachek(2003) and Novak et al.
users are most likely to search online for information when they perceive to obtain these values via the Internet.
3. Perceived benefits of Internet shopping
The perceived benefits of shopping via the Internet, for the most part, can be represented by convenience, economical efficiency, and entertainment. The supply of online product information, acceptance of online orders, and convenience of front door delivery have made reduction in time or mobility costs possible, as well as an offering of a variety of product without the worry of stock or storage issues, leaving Internet shopping with competitive advantage over traditional retail shopping. Consumers are not only free to search for product information, but also free to compare information between competing manufacturers. As for the entertainment of Internet shopping, many online shoppers reportedly enjoy the search for new products or new product information, and/or find pleasure in participating in various activities provided by online shopping mall websites. Much of this benefit of Internet shopping has been discussed earlier in connection with the hedonic value of Internet information searching.
4. Perceived risk of Internet shopping
failure of an online-purchased product), personal risk (i.e. uncertainty of the stability of the online shopping process), and privacy risk (i.e. fear of the exposure of personal information).
Previous research conducted by Miyazaki and Fernandez (2001), shows a negative relationship between perceived risk of Internet shopping and purchase rate. The first prediction in consumer behavior literature in regards of perceived risk (Bauer 2001: 28) states that consumers make purchase decisions that minimize perceived risk in the relevant situation.
5. Online purchase experience
In line with the work by Shim et al.(2001: 42) found that previous experience with Internet shopping is a good predictor of online search behavior. It has been also established through past studies that prior online purchase experience may also have a direct effect on online purchase intentions (e.g., Shim et al. 2001; Weber & Roehl 1999: 32). That is, prior Internet purchase experience may both have a direct and indirect (through online information search intentions) impact on online purchase intentions.
E. Interactive Decisions for Online Shopping
their virtually infinite “shelfspace,” i.e., the lack of physical constraints with respect to product display.
Interactive decision aids that may be of use to consumers who wish to shop online include a wide variety of software tools, ranging from general-purpose search engines to sophisticated agent-mediated electronic commerce systems (e.g., compare.net; www.jango.com). A common classification of interactive shopping agents is based on whether a tool is designed to help a consumer determine (1) what to buy or (2) who to buy from. These two tasks may be referred to as product brokering and merchant brokering, respectively (see Guttman et al. 1998). For the purpose of this paper, we confine our attention to the former. Among tools for product brokering, a distinction can be made between decision aids that operate within a particular merchant’s online store and ones that operate across merchants.
1. The initial screening of available products to determine which ones are worth considering further and
2. The in-depth comparison of selected products before making the actual purchase decision.
F. Product Perception
The three most influential purchase perception factors cited in the literature are the perceptions of price, product quality, and product variety Price is defined as the total monetary cost to the consumer for the purchase (Yan Zhi, 2001:3). Pricing perceptions are important since new pricing strategies are being applied to goods and services sold over the Internet. Dynamic pricing, defined as a pricing strategy where prices change over time, across consumers, or across product bundles can easily be executed on the internet. This pricing strategy contrasts with conventional retail channels where pricing changes are traditionally performed over the course of weeks or months (Yan Zhi 2001:5).
Yan Zhi defined the product quality as those distinguishing characteristics or traits inherent in the product or service that differentiate it from competitive product or service offerings. Quality of a product is one of a shape that according to the fitness for use. Quality is the effort of a product and service that can satisfy the needs and wants from consumers.
According to the connection with customer satisfaction, quality can be seen from two components, i.e:
2. Quality of conformance, which connected with the product design, also the effort of the producer to put down the scrap of raw materials, rework and complaints of the consumer.
A third factor contributing to product perception is product variety, defined as the assortment of alternative and complementary goods available from the retailer. Product variety is important to shoppers because it provides them with the opportunity to compare, contrast, and select from among multiple potential solutions that meet their needs.
G. Shopping Experience
The shopping experience is a mixture of effort, lifestyle compatibility, fun, and playfulness (Baty &Lee, 2000; Goldsmith, 2007). When engaged in e-commerce purchases over the Internet, effort is primarily a mental activity; shoppers work at their keyboard instead of having to plan for and travel to multiple shopping sites. For e-commerce shopping, the dominant components of effort are ease of use, coupled with the ease of placing and canceling orders. These components may be described in terms of the time required to find and purchase products, the convenience of using the shopping engine or “shopping cart” as part of the purchasing process, and the availability of the desired products (Misra, & Rao, 2000).
addition, lifestyle compatibility may reflect on the consumer’s opinion of those that make e-commerce purchases (Goldsmith & Bridges, 2000).
H. Customer Service
Customer service affects purchase decisions through vendor knowledge, responsiveness and reliability (Baker, Levy, & Grewal, 1992; Gefen, 2002). Vendor knowledge and responsiveness are embodied in the way that the service provider anticipates and responds promptly and effectively to customers’ needs and requests, providing the customer with the knowledge necessary to make a purchase. An example of anticipating customers’ needs occurs when a merchant clearly states which forms of payment are acceptable and goes on to explain the differences in expected delivery times and charges for different delivery options available to the customer.
Reliability occurs when the customer perceives that there is a high probability that the service provider will deliver precisely what is being promised, within the proper time. Internet purchases of tangible goods present unique challenges when compared with traditional ‘brick and mortar’ retail store purchases. Consumers do not have the opportunity to physically inspect goods purchased over the Internet prior to purchasing them (Jarvenpaa & Todd,2007).
I. Previous Literature Observation
responsiveness, reliability, return convenience and policy) or consumer risk issues (form of payment, credit card security, and confidentiality). Specific factors that were more influential to students that have made e-commerce purchases consumer Adoption include the product perception (price and quality), and the positive aspects of the shopping experience (lifestyle compatibility and enjoyment). This finding is consistent with that of Jarvenpaa and Todd (1996-97) who proposed that vendors should emphasize product perception and shopping convenience factors when developing web sites. Experienced online shoppers find the activity to be enjoyable and amenable to their lifestyles. In a similar vein, students who rated
J. Theoretical Framework
In the theoretical framework shows there is inter-correlation among the variables between independent variables and dependent variables. Independent variable consists of product perception, shopping experience and customer service. Which these independent variables simultaneously indicate product perception shopping experience and customer service influence dependent variable consumer decision on online shopping.
Product
Perception
(X
1)
Shopping
Experience
(X
2)
Customer
Service
(X
3)
Consumer Decision
on online shopping
K. Hypothesis
The hypothesis of this research is:
1. Ho: There is no significant between product perceptions toward purchase decision on online shopping.
Ha: There is significant between product perceptions toward purchase decision on online shopping.
2. Ho: There is no significant between shopping experiences toward purchase decision on online shopping.
Ha: There is significant between shopping experiences toward purchase decision on online shopping.
3. Ho: There is no significant between customer services toward purchase decision on online shopping.
CHAPTER III METHODOLOGY
A. Research Scope
The research will be on product perception, shopping experience, and customer service toward the influence of consumer decision on online shopping. This research unknown population which is the customers of online shopping and internet users selected randomly, which are 100 populations that was made as sample the research.
B. Sampling Method
The sample is some of the numbers and the characteristics that were owned by this population (Sugiyono,2002: 731).
In this research, the writer used the Convenience sampling technique. According to Kriyantono (2008: 158)”Choosing this sample was based on the ease of the data that was owned by the population. The free researcher chose anyone the population's member who had the abundant data and easy to be received by the researcher”. The writer used this technique because of could shorten time and limitation of budget.
C. Data Collection Method
The writer in getting the accurate data used several methods that were taken from the location of the research in accordance with the Arikunto opinion (2004:134)”Technique data processing is methods that could be used by the researcher to gather data”.
According to Sugiyono (1999:139) ”if based on the source of data, then the data
Several techniques that the writer did in receiving the data that was needed take the form of:
1. Primary Data
Getting primary data is inspecting directly the company that became the object of the research, and the technique which researcher use are:
a. Interview
Interview is one of the methods of getting the data by asking in the form of verbal communication or the interview in order to gets information from the respondent. In this case the IT management that was needed by his information in supporting the writing of this thesis.
b. Observation
Observation is a technique look for or gathered the data with the road to observe and enter directly to the field. Saw obviously the situation and the condition for the company with all the aspects of the activity that was connected with the research. Observation as the technique of the data collection had the specific characteristics when compared with the other technique.
From the data that could be gathered, was analysed, and concluded that was further relevance towards the title that will be discussed.
c. Questionnaire
The questionnaire is the question that must be filled in by the respondent. The aim of the spreading of the questionnaire is to look for information that was complete concerning a problem from the respondent without feeling worried when respondent gave the answer that was not in accordance with the reality in the questionnaire filling.
In this research, the writer used the closed ended question. It is where the respondent is given by the alternative to the answer by the researcher. The respondent was kept choosing the answer that according to him in accordance with reality that is his experienced, usually by giving the X sign or √.
D. Analysis Method
carried out the calculation to answer the formulation of the problem and carry out the calculation to test that has given”.
1. Descriptive Analysis
The objectives from this descriptive analysis is to make the formulation or picture factual systematically and real actual fact, behavior and also the relation between phenomena that is looking for (Sugiono1999 :112).
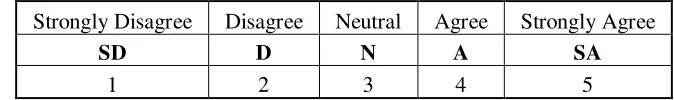
The question at first section is using nominal scale. The whole question at second section is measure by likert scale. In this research, writer using 1-5 scale, where 1 represent “strongly disagree” and scale 5 represent “strongly agree”.
Table 3.1
Likert Scale Category
Source: Sugiono : Metode Penelitian Bisnis, 2005, Pg. 87
Strongly Disagree Disagree Neutral Agree Strongly Agree
SD D N A SA
To examine validity and reliability of the each and every item of the questionnaires, hence the writer needs to do a test on validity and reliability first in order to get the good research result try out must be done towards several respondents first.
a. Reliability Analysis
Reliability according to Singarimbun (2006: 140)” is index that showed how far the gauge implement could be believed”. When a gauge implement was used twice to measure the same sign and results of the grating that was received relatively consistent, then this gauge implement reliable. In other words, reliability showed consistency in a gauge implement inside measured the same sign.
Reliability Test is meant to see how far results of a grating could be believed only if several times the implementation of the grating was against the same subject group received by results that relatively same, for the aspect that is measured the subject did still not change.
The Correlation Product Moment formula (Pearson’s Correlation) according to Kriyantono (2008:173):
r = n(∑XY) – (∑X ∑Y)
[n∑X² - (∑X)²][n∑Y² - (∑Y)² Keterangan:
r = Koefisiensi Korelasi Pearson’s Product Moment n = The amount of sample
X = The raw figure the variable X Y = The raw figure the variable Y
∑ = The total amount
The score of reliability is differentiating on each of every variable to interpret low or high of the reliability instrument, as directive is base on certainty as follows:
Table 3.2
Category High and Low Reliability Instrument Interval Coefficient Level of Reliability
< 0.200 Very low
0.200 - 0.399 Low
0.400 - 0.599 Sufficient
0.600 - 0.799 High
b. Validity Test
The validity test was the testing that used to measure legal or valid or not from some questionnaire. Some questionnaire was said valid if the question in questionnaire was able to reveal something that will be measured by that questionnaire (Ghozali, 2006)
The validity test was carried out with compared r counted (the table of Corrected Item-Total Correlation) with r the table (the Product Moment table with the significance 5%) to degree of freedom (df) = n-2, in this case n was the number sample the research totaling n the respondent that had r counted for the value df=n-2, and some questionnaires was said valid if r counted > r the table (Ghozali, 2006)
E. Quantitative analysis a. Normality Data Test
b. Assumption Classic Test
Multiple linier regression models can be call as a good model when that model fulfill the normality data and free from statistic classic assumptions whether it is autocorrelation, multicollinearity and heteroskesdastisity.
1) Autocorrelation
To examine autocorrelation in certain model is aim to recognize whether there is any correlation between intruder variables (et) or not in certain period with the previous intruder variable (et-1). The procedure in order to know the test of Durbin Watson, by formulae as follows:
The easy way to detect whether there’s autocorrelation or not also can be use by following certainty:
D = ∑(
e
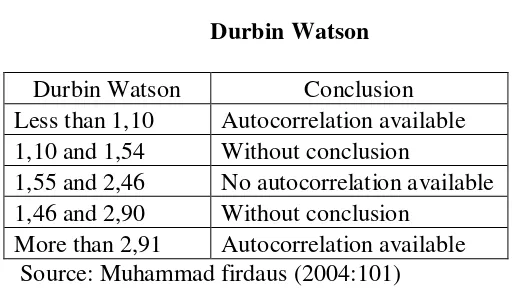
n – e n-1)Table 3.3 Durbin Watson Durbin Watson Conclusion Less than 1,10 Autocorrelation available 1,10 and 1,54 Without conclusion
1,55 and 2,46 No autocorrelation available 1,46 and 2,90 Without conclusion
More than 2,91 Autocorrelation available Source: Muhammad firdaus (2004:101)
2) Multicollinearity
Multicollinearity test is to know whether there is a similarity between one independent variable with the other independent variable in a certain model. Similarity between one independent variable with the other independent variable in certain model is causing a strong correlation happened between one independent variable with the other independent variable, beside that the detection on multicollinearity also aim to avoid the habit of taking conclusion process of influence partial in every independent variables towards dependent variable.
3) Heteroskesdastisity
Heteroskesdastisity test is aim to examine is in the regression model happen any residual variance in certain monitoring period to the other monitoring period. If this characteristic is fulfilled, that means factor of intruder variation towards the data has the characteristic of heteroskesdastisity. If that assumption cannot be fulfilled hence there is a divergence. The divergence towards this intruder factor is called as heteroskesdastisity. A good regression model is homokesdastisity and not heteroskedastisity.
According to Bhuono (2005:62), to predict there is heteroskesdastisity or not in a certain model can be seen from the picture of its scatterplot model. In the scatterplot picture when it says multi linear regression having no heteroskesdastisity if:
a) The dot for the data is spreading above and below or around the number of 0.
b) The dots is not just grouping only above or grouping just below, in other words just grouping at one side only but also at the other side (both of the sides).
c) The dots cannot spread like a wide wave and then narrow and again widening.
c. Multiple Linear Regression Test
To reach the research goal, the data that already received must be analyzed. In this research multi linear regression is used, this model is used because the writer need to know how big is the influence of the variable Product Perception (X1), Shopping Experience (X2), Customer Service (X3) in order to form an influence of consumer decision (Y).
In order to count multi linear regression for this research, the writer taking the help of SPSS 16.00 for Windows.
By using the formula of similarity as follows: Y = + 1 X1 + 2 X2 + 3 X3 +
Where:
Y = Consumer decision on online shopping
= Constant
= Coefficient Regression
X1 = Product Perception X2 = Shopping Experience X3 = Customer Service
b1 = Coefficient Regression Product Perception b2 = Coefficient Regression Shopping Experience
From the counting with SPSS 16 will gain the information and explanations on the coefficient determination, F Test, t Test to answer the formulation of the problems. These are the following explanation that is connecting to the problem above, that is:
1) Coefficient determination (R2)
Coefficient determination (R2) is aim to understand how big the ability of independent variable explaining dependent variable. In the output SPSS, coefficient determination is located in the model summaryb table and written R square. However for multi linear regression written as adjust R square, because adjusting with the total independent variables that is used in the research.
2) F test
F Test is done to see and to understand the influence both independent variables together towards dependent variable. To examine hypothesis: Ho: b = 0, hence steps that is used to examine the hypothesis with F Test is as follows:
a) Determining Ho and Ha
Ho: b = 0 (there is no significant influence between independent variable with dependent variable).
b) Determining level of significance
Level of significance used is 5% or () = 0,05. c) Determining score of F-test
To determine F-test the formulae as follows:
Where:
R2 = Coefficient determination n = Total of observation / Sample k1 = Total of Independent variable
d) Determining the criteria acceptance and reject of Ho If probability < 0,05 reject Ho
If Probability > 0,05 fail to reject Ho
3) t test (Partial Test)
T test is aim to understand how big the influence each independent variables individually/ partially towards dependent variable. According to Bhuono (2005:54) the result of this t-test is from the output of SPSS by looking at the table of coefficientsa. The score from t-test can be seen from p-value (in the sig column) in each and every independent variables, if p-value smaller than level of significant
R2 / k F =
that has been determined, or t-test (in t column) larger than t-table (counting from two tailed = 5% df = n – k, k is a total independent variable). To examine coefficient hypothesis: Ho = 0.
Hence the steps that is use to examine this hypothesis by t test as follows: a) Determining Ho and Ha.
Ho : b = 0 (coefficient regression not significant) Ha : b 0 (coefficient regression significant) b) Determining level of significance
Level of significance use is amount 5% or () = 0,05. c) Determining t test
Determining t-test can be formulated as follows:
……… (3.6) b - Se
t test = Sb
Se Sb =
X 2
Y2 –
n
Y2 - Y – b XY Se =
Where:
a = Constant
b = Coefficient correlation n = Total Sample
Sb = Book error coefficient correlation Se = Book error estimation
If t test > t table therefore Ho rejected and Ha accepted, that means independent variable partially has influence significantly towards dependent variable.
If t test < t table therefore Ho accepted and Ho rejected, that means independent variable partially has no influence significantly towards dependent variable.
Level of significance use amount 5% or () = 0
F. Operational Variable
Variable in this research consist of:
1. Variable independent
Influenced or that to because of his change or the emergence variable dependent (was tied). In this research that to variable independent was Product Perception (X1), Shopping Experience, (X2), and Customer Service (X3).
2. Variable dependent
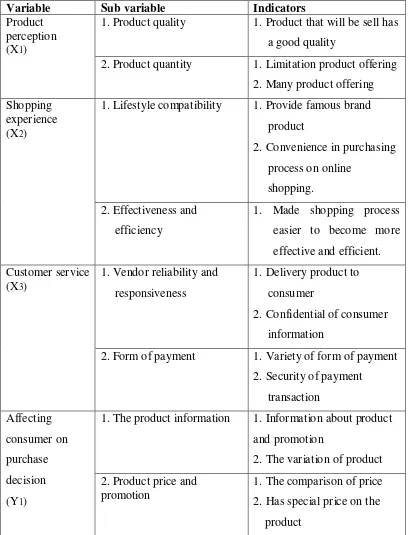
Table 3.4
Operational Variable Analysis
Variable Sub variable Indicators
1. Product quality 1. Product that will be sell has a good quality
Product perception (X1)
2. Product quantity 1. Limitation product offering 2. Many product offering 1. Lifestyle compatibility 1. Provide famous brand
product
2. Form of payment 1. Variety of form of payment 2. Security of payment
transaction
1. The product information 1. Information about product and promotion 2. Has special price on the
CHAPTER IV FINDING and RESULT
A. General Illustration of Research Object 1. Location and time of the Research
This research is held in any locations, which are State Islamic University (UIN), Institute Technology Bandung (ITB), and some online shop boutique in Bandung and Jakarta. Considering the unknown of sample, then in this research the writer used the technique judgment sampling that is the election sample the research was chosen randomly.
Research data is assembled by distributing questionnaires directly to the respondents and through e-mail. The distribution of questionnaires is started on 26 Dec 2009 until 24 January 2010. Distribution of the questionnaire is assembled routine.
.
2. Characteristics of Respondents
Questionnaire that has already distributed is 100 questionnaires to all 100 respondents (Internet users). All 100 questionnaires given, all returned and responded.
Chart 1 Gender
As shown on the Chart 1 above, from the gender side of 100 respondents there are 25 male and 75 female.
From chart 2 above, we can see the for the result of Occupation side there are 70 students of university, 3 respondents are entrepreneurs, 15 respondents are office employee, 7 respondents are government office, and 5 respondents are from other occupation for instance housewife.
Chart 3
Frequency of internet usage (per week)
Chart 4
Products are usually purchased
From the result of respondents, the chart above shows the products are usually purchased by internet or online shopping is 50 respondents choose fashion products (Cloths, Bags, Shoes, Jewelry, etc), 5 respondents choose electronics (TV, HP, Laptop, Camera, Pc, etc), 1 respondent choose food/beverage, 35 respondents choose tickets (Film, Flight, Music concert, etc), 1 respondent choose book and 8 respondents choose other.
From the total respondents how much they spent their money for shopping a month. We can see from table above that 2 respondents who spent their money less than Rp. 100.000, 30 respondents are spent their money around Rp.100.000 – Rp. 300.000, 30 respondents are spent their money around Rp.310.000 - Rp500.000, 20 respondents are spent their money around Rp. 5100.000 – Rp.700.000, 10 respondents are spent their money around Rp710.000 – Rp 1000.000 and 8 respondents spent their money more than Rp1000.000. All these interpretations give us a picture of how the customer can be influenced on online shopping decision process.
B. Finding and Result
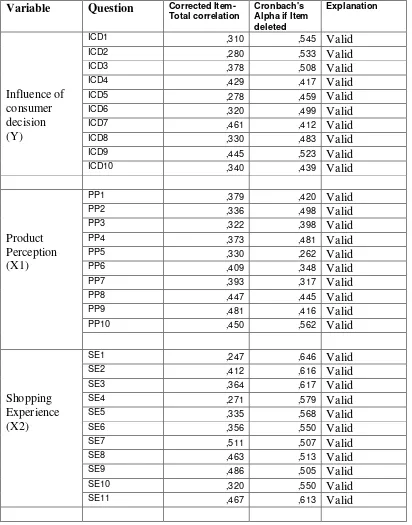
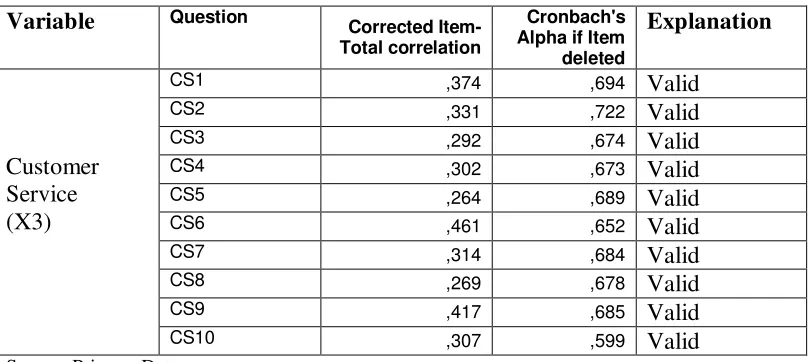
1. Validity Test
Validity test explains that the validity of instrument could be used to get validity of data and could be used to measure what we want to calculate. Requirement of validity is, if the significance values of questionnaire every indicator between 0.05 or 5%.
Table 4.1
Pre Test f the Product Perception, Sopping Experience, Customer Service, toward influence of consumer decision on online shopping
Item-Continue table 4.1
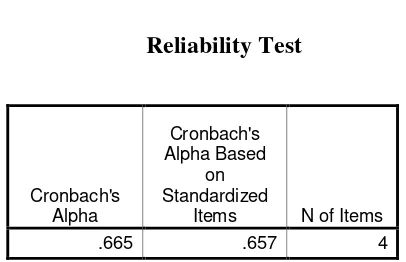
items of questionnaires could be use for further research and if the same question is distributed, the answer to it will not be far difference with the previous answers.
Table 4.2 Reliability Test
Source: Processed data by SPSS
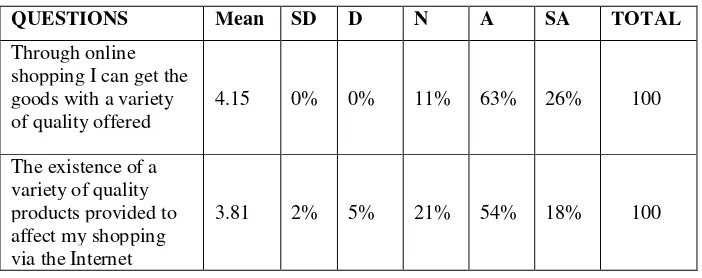
3. Descriptive Analysis A. Perceived Quality
When all the data that needed has been collected, then it should be continued by coding and input data process to fulfill the analysis system. The data that is ready for processing will be continued by using SPSS 16.0 version. The question at second section is using nominal scale and the other question is measure by likert scale that using 1-5, where 1 is presenting “strongly disagree” and 5 is presenting “strongly agree”.
Cronbach's Alpha
Cronbach's Alpha Based
on Standardized
Where:
Score 1-1.8 = Strongly Disagree (SD) Score 1.8-2.6 = Disagree (D)
Score 2.6-3.4 = Neutral (N) Score 3.4-4.2 = Agree (A)
Score 4.2-5 = Strongly Agree (SA)
the quality of different is 3.45, Shopping online can help consumers to choose alternative products such as the type and quality is 3.61, I shop via the Internet because the availability of merchandise brands / products with various options is 3.58, Consumers can ensure that more goods will be purchased to avoid mistakes in the purchase via the Internet is 3.64, Shopping via the internet has to offer goods are goods that have a quality product that was seeded is 3.70.
Continue table 4.5
via the internet is 3.44, There is value added from online shopping is 3.63, Through online shopping can add business networking is 3.48.
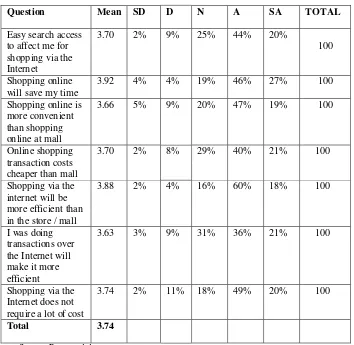
Total mean of influence of consumer decision is 3.74. Following to the likert scale above, it shows that correspondents of this research are attending to “neutral”. The indicators show the almost of respondents are agree. Its explained by Easy search access to affect me for shopping via the Internet is 3.70, Shopping online will save my time is 3.92, Shopping online is more convenient than shopping online at mall is 3.66, Online shopping transaction costs cheaper than mall is 3.70, Shopping via the internet will be more efficient than in the store / mall is 3.88, I was doing transactions over the Internet will make it more efficient is 3.63, Shopping via the Internet does not require a lot of cost is 3.74.
2. Customer Service
a. Reliability and Responsiveness
Table 4.7
Question Mean SD D N A SA TOTAL
I shop via the Internet for quick online shop to handle complaints from customers.
4.00 0% 2% 14% 66% 18% 100
Online store offers special services (personal care) to the customer
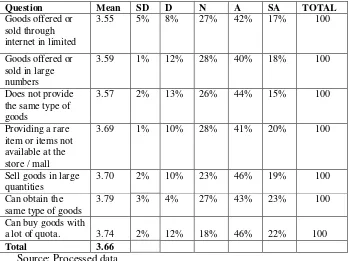
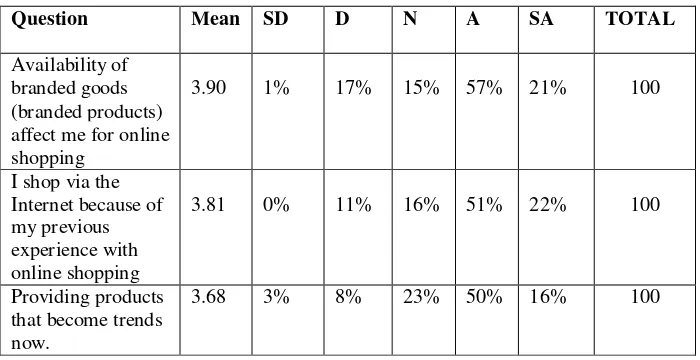
3. The influence of consumer decision on online shopping “neutral”. The indicators show the almost of respondents are agree. Its explained Wide variety of products can be found in the online shop is 3.93, Complete
Question Mean SD D N A SA TOTAL
Total mean of influence of consumer decision is 3.74. Following to the likert scale above, it shows that correspondents of this research are attending to “neutral”. The indicators show the almost of respondents are agree. Its explained Products offered through the internet has a competitive price is 3.77, Cheaper product prices when shopping over the Internet from the ordinary the store is 3.65, Products on the Internet often give a discount is 3.79, Products on the Internet has variable values is 3.66, The products on the internet have a significant price is 3.64, I can compare prices on each different type of goods in each store online is 3.82, By shopping through the Internet, I often get a product with a lower price is 3.86.
C. Classical Assumption Test
1. Autocorrelation
Table 4.11 Durbin Watson
Durbin Watson Conclusion
Less than 1,10 Autocorrelation available 1,10 and 1,54 Without conclusion 1,55 and 2,46 No autocorrelation available 1,46 and 2,90 Without conclusion More than 2,91 Autocorrelation available
Autocorrelation test in certain model is aimed to know the availability of correlation between disturbance variable (e1) in the previous period (et-1). Autocorrelation test can be made by using Durbin Watson Test.
Table 4.12
Autocorrelation Test
Model Summaryb
a. Predictors: (Constant): PP, SE, CS
b. Dependent Variable: The influence of consumer decision on online shopping Source: Processed data by SPSS
To know whether there is autocorrelation or not, it can be seen through a certainty in the table 4.12 Durbin Watson. The result of Durbin Watson test used SPSS is 2.114 with the standard of significant 0.05, according to the table 4.12, there is no autocorrelation in this linear regression models, and this model is suitable to be used.
Model Durbin-watson
2. Multicollinearity Test
Table 4.13
Multikolinearity Test
a.Dependent Variable: The influence of consumer decision on online shopping
Based on the table 4.13 that the value of tolerance is not less than 0.1 and the value of Variant Inflation Factor not more than 10, meaning that this analysis does not indicate there is a tendency towards variable multikolinearitas research, so that it can be concluded that this research is supported by classical theory and reasonable use in testing.
Collinearity Statistics
Model Tolerance VIF
(Constant)
Product Perception .852 1.174 Shopping Experience .847 1.180 1
3. Heteroskesdastisity
Graphic 4.1
__
4. Normality Data
Normal P-P Plot of Regression Standardized Residual
Dependent Variable: The influence on consumer decision
__
Graphic 4.3
From the Graphic 4.2 above, shows that symmetric histogram did not skew to left or right side. And graphic 4.3 shows the plot of normality plots spreading around diagonal and it mean has normal distribution. According to autocorrelation, multicolliearity, heterokedastisity and normality test, it has fulfilled the requirement to continue to regression test.
The correlation value of influence of consumer decision toward product perception is 0.112 the correlation value of the influence of consumer decision toward shopping experience is 0.445, the correlation value of the influence of consumer decision toward customer service is 0.186. The correlation product perception toward shopping experience is 0.374, the correlation product perception toward customer service is 0.151.That’s all using significant at 0.01.
Table 4.15
Result of Multiple Regressions
Unstandardized Coefficients
Model B Std. Error
(Constant) 20.223 4.965
Product Perception .081 .099
Shopping Experience .409 .080
1
Customer Service .122 .078
According to the table 4.16 above obtained the similarities of linear regression as follows:
Y= 20.223+0.81X1+0.409X2+0.122X3+
Where:
Y = the influence of consumer decision on online shopping X1 = Product Perception
X2 = Shopping Experience X3 = Customer Service
From the result above will be interpreted if variable product perception (X1), Variable shopping experience (X2), and customer service (X3) is constant, therefore influence of consumer decision on online shopping (Y) amount is 20.223
The coefficient regression amount of shopping experience is .409 it shows, shopping experience variable raise 1 unit hence influence of consumer decision on online shopping (Y) will increase .409. Because has positive effect, it means there is coefficient regression of shopping experience (X2) to form the influence of consumer decision on online shopping (Y).
The coefficient regression amount of customer service is .122 it shows, customer service variable raise 1 unit hence influence of consumer decision on online shopping (Y) will increase .122. There is coefficient regression of customer service (X3) to form the influence of consumer decision on online shopping (Y).
2. Coefficient Determination (R²)
Table 4.16
Coefficient Determination (R²)
Model Summaryb
a. Predictors: (constant), product perception, shopping experience, customer service b. Dependent variable: The influence of consumer decision on online shopping
Model R R Square
Adjusted R Square
1 .564a
From the result as shown in the table 4.16, the number of correlation (R) between product perception, shopping experience, and customer service in order to form the influence on consumer decision is .564.
3. F Test
a. Predictors: (Constant), PP, SE, CS.
b. Dependent Variable: Influence of consumer decision on
online shopping together simultaneously Y (Influence of consumer decision).
Shopping Experience (X2), Customer Service (X3) together simultaneously has influenced towards Y (consumer decision) significantly.
4. T Test
Table 4.18
Coefficientsa
Unstandardized Coefficients
Standardized
Coefficients
Model B Std. Error Beta t Sig.
(Constant) 20.223 4.965 4.073 .000
Product perception .081 .099 .083 .814 .418
Shopping experience .409 .080 .484 5.134 .000
1
Customer service .122 .078 .143 1.554 .123
a. Dependent Variable: The influence of consumer decision on online shopping
Source: Data processed by SPSS
a. Product Perception (X1)
b. Shopping Experience (X2)
Table 4.18 shows the significant number of variable X2 (shopping experience) is 0.000. The number 0.000<0.05. Therefore Ho rejected Ha accepted. With the standard error 5% and degree of freedom (df) = n-total of independent variable = 100-3= 97, the result of T table is 1.671. The value of T test is 5.134>T table 1.671. Therefore shopping experience (X2) is significantly affects the influence of consumer decision on online shopping (Y).
c. Customer Service (X3)
E. Interprets
Thomas W. Dillon and Harry L. Reif in 2004 have been done research about factors affecting consumers shopping online in the perception of the product, shopping experience, customer service and consumer risk. The research results from table T test and Zsign overall showed that there is significant among of those four variables.