A
SIAN
J
OURNAL OF
C
HEMISTRY
A
SIAN
J
OURNAL OF
C
HEMISTRY
http://dx.doi.org/10.14233/ajchem.2015.18641
INTRODUCTION
In the field of material science, development of nano-materials is the main interest currently pursued intensively since nanomaterial has been proved to posses beneficial characteristics compared to the material with larger particle size, such as higher homogeneity and larger surface area which increase the availability of the active sites. Due to superior performance, many nanomaterials have been developed and applied in wide range of applications, such as catalysts1,2,
sensors3,4, soft magnetic materials5,6, microwave absorbers7,8,
colour imaging9,10 and inductors11,12.
In recognition of important roles of nanomaterial, a large number of researches has been devoted and focused on two main aspects, e.g. development of synthetic method and development of various materials which satisfy the continuous growing of utilization. Currently, several methods for prepa-ration of nanomaterial exist, including co-precipitation13,14,
sol-gel15,16, soft mechano-chemical17, hydrothermal18,19 and
precipitation20,21.
Among the methods mentioned above, sol-gel technique is the most widely applied since this method is acknowledged to offer several advantages in terms of the processing and the characteristics of the product resulted. Sol-gel process can be carried out at ambient temperature using simple apparatus. In addition, since the sol-gel method involves dissolved substrates,
Sol-Gel Method for Preparation of Nanosize NiFe
2-xCo
xO
4Using Egg White
RUDY SITUMEANG1,*, POSMAN MANURUNG2, SEPTHIAN TRY SULISTIYO1, SUTOPO HADI1,*, WASINTON SIMANJUNTAK1 and SIMON SEMBIRING2
1Department of Chemistry, FMIPA University of Lampung, Jl. S. Brodjonegoro No. 1 Bandar Lampung 35415, Indonesia 2Department of Physics, FMIPA University of Lampung, Jl. S. Brodjonegoro No. 1 Bandar Lampung 35415, Indonesia
*Corresponding authors: E-mail: [email protected], [email protected]
Received: 26 August 2014; Accepted: 5 November 2014; Published online: 19 January 2015; AJC-16742
NiCoxFe2-xO4 nanomaterials (with x = 0.1-0.3) have been prepared using a combination method of sol-gel and freeze-drying. Preparation of material was carried out by dissolving nitrate salts of iron, nickel and cobalt in egg white solution and then the sample was stirred throughly using magnetic stirrer. The sample was subjected to calcination treatment and subsequently characterized using the techniques of X-ray diffraction for both qualitative and quantitative analysis such as Rietveld and Debye-Scherrer methods, infrared spectroscopy and scanning electron microscopy. The results of X-ray diffraction characterization indicated that the catalysts consist of various crystalline phases, with NiFe2O4 superimposed to CoFe2O4 is a major phase. FTIR analysis confirmed the existence of both Lewis acid and Brønsted-Lowry acid sites. The sample was found to display relatively surface morphology and according to the scanning electron microscopy data and Scherrer equation, the particle size of the material is in nano scale, 15-46 nm.
Keywords: Nanomaterial, Sol-gel and freeze-drying, BrØnsted-Lowry and Lewis acid sites.
the mixing of the substrate in atomic or molecular level can be achieved, resulted in very homogeneous product.
Some researchers have reported succesfull preparation of nanomaterials belong to ferrites compounds using different methods. Derakshi et al.14
reported application of co-precipi-tation method to synthesize ferrites material with the particle size of 32 nm. In another study15
, it was reported that ferrites material with the particle size of 45 nm was obtained using sol-gel method, followed by sintering treatment at temperature range of 900-1200 °C, while Lazarevic et al.17
applied soft mechanochemical method to obtain ferrites material with particle size of 40 nm.
Recently, global consideration on green chemistry, the material researchers have changed their ideas to use all chemicals on preparing material stuffs which is both amenable to environment and economically reasonable products without diminishing its characteristics22,23
. Maensiri et al.22
have been able to obtain nano-particle of NiFe2O4 spinel using ovalbumin
solution as non-toxic and economical chemical even the particle size still varied in the range of 60-600 nm. Another study on preparing CeO2 using egg-white solution, Maensiri et al.23 was
able to synthesize plate like clusters of CeO2 which has the
particle size of 6-30 nm in diameter23
. Other researchers24,25
have also been able to obtain nanomaterial by using freeze-drying method due to evaporating its solvent without destruc-ting the formed network.
In this paper, we report our result in order to obtain nano-catalysts of NiFe2-xCoxO4 (x = 0.1-0.3) using freshly egg white
solution as capping agent and freeze-drying due to both elimi-nating its solvent and preventing the precursors' network formed and also to inform the effect of Ni/Co ratio on its charac-teristics.
EXPERIMENTAL
Catalysts preparation: Solid NiCoxFe2-xO4 was prepared
by dissolving solution of Fe(NO3)3·9H2O, Co(NO3)3·6H2O and
Ni(NO3)3·6H2O, respectively in 100 mL egg white solution.
Then, these solutions (by Fe/Co ratio variation, x = 0.1 to 0.3) were mixed and stirred, until homogenous solution is obtained and then freeze-dried. Furthermore, the precursor was calcined at 600 °C for 6 h (increased by 2 °C min-1).
Catalysts characterizations: A small amount of catalyst's sample (50-100 mg) was prepared and put it on sample holder. X-rays power diffraction pattern of NiCoxFe2-xO4 were
recorded from 2θ = 10 to 90° on a Philips diffractometer Model PW 1710 using CuKα radiation at a step 0.02° per second. Diffractogram then analyzed qualitatively by comparing to ICCD-JCPD files and quantitatively by using Rietveld method26. Particle sizes is also determined using Debye-Scherrer
method27.
Scanning electron microscopy analysis: 0.1 g of catalyst's sample is put on sample holder containing Cu sticking tape, then sample is coated by thin layer of gold or other conducting materials28,29.
Acid sites analysis of catalyst: After heating on 120 °C, sample is inserted in vaccum30. Then, liquid pyridine is
fluidized into crucible located inside of vaccumized dessicator. After contacting for 24 h, catalyst's sample is taken out from dessicator and allowed on air for 2 h. Finally, a small amount of sample is mixed to KBr powder (sample/KBr ratio = 1/9) and is ready to analyze by putting it on quartz cell of FTIR spectroscopy31,32.
RESULTS AND DISCUSSION
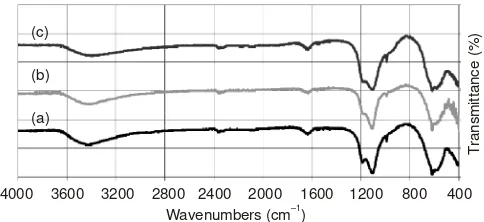
Acidity analysis: In this study, Fourier transform infrared (FTIR) spectroscopy was applied to identify the functional groups present in the sample. With the main interest is the existence of BrØnsted-Lowry and Lewis acid sites, since the
acidity is acknowledged as a prime characteristic which determines the performance of a material, for example the catalytic activity. The application of this spectroscopic tech-nique in this study and interpretation of the spectra produced were based on similar studies on various catalyst samples reported by others33-35. The FTIR spectra obtained for the three
samples investigated are presented in Fig. 1. The spectra are practically similar in terms of the absorption bands, with only some minor differences in the relative intensities of some bands, depending on the composition of the sample. The band at 3385.06, 3379.28 and 3373.49 cm-1 of NiCo
0,1Fe1,9O4,
NiCo0,2Fe1,8O4 and NiCo0,3Fe1,7O4 materials respectively refers
to O-H stretching vibration which is usually happened at the range of 3500-3200 cm-1. It can be implied that wavenumber
of O-H stretching vibration shifted to the relatively lower band with increasing Co-content. In finger print region, peaks appeared
at 586.36, 613.36 and 586.36 cm-1 for NiCo
0,1Fe1,9O4, NiCo0,2
Fe1,8O4 and NiCo0,3Fe1,7O4 materials, respectively which is
indicating that stretching vibration of M ↔ O types such as Co ↔ O, Fe ↔ O and Ni ↔ O modes occured. Other peaks represent bending vibration of M ↔ O types such as Co ↔ O, Fe ↔ O and Ni ↔ O modes appeared at 563.21, 567.07 and 561.28 cm-1 for NiCo
0.1Fe1.9O4, NiCo0.2Fe1.8O4 and NiCo0.3
Fe1.7O4 materials, respectively17,36,37. In general, stretching
vibration happened in a range of 613-580 and at 428-420 cm-1
is catagorized as strong or weak stretching vibrations, respec-tively38. So, it can be stated that metal in NiCo
xFe2-xO4
spinel structure is located on tetrahedral sites. The existence of BrØnsted-Lowry acid sites is displayed by the absorption
bands located both at 1469.75, 1473.61 and 1469.75 cm-1 and
also at 1421.53, 1436.96 and 1421.53 cm-1, for NiCo
0.1Fe1.9O4,
NiCo0.2Fe1.8O4 and NiCo0.3Fe1.7O4 materials, respectively. While
the existence of Lewis acid site is displayed by the absorption bands located both at 1616.34, 1608.63 and 1612.49 cm-1 and
also at 1516.05, 1527.62 and 1521.83 cm-1 33,39. Based on
the relative intensities of the bands and wavelength locations, it can be inferred that the Lewis acid sites is more prominent than BrØnsted-Lowry acid sites. According to this acidity type,
it can be inferred that the samples investigated are suitable for process requiring both Lewis and BrØnsted-Lowry acid sites,
such as dehydrogenation, Fischer-Tropsch, deNOx and other
catalytic reactions39.
Fig. 1. FTIR spectra of pyridine absorbed on three samples with different compositions investigated in this study, (a) NiCo0,1Fe1,9O4, (b)
NiCo0,2Fe1,8O4, and (c) NiCo0,3Fe1,7O4
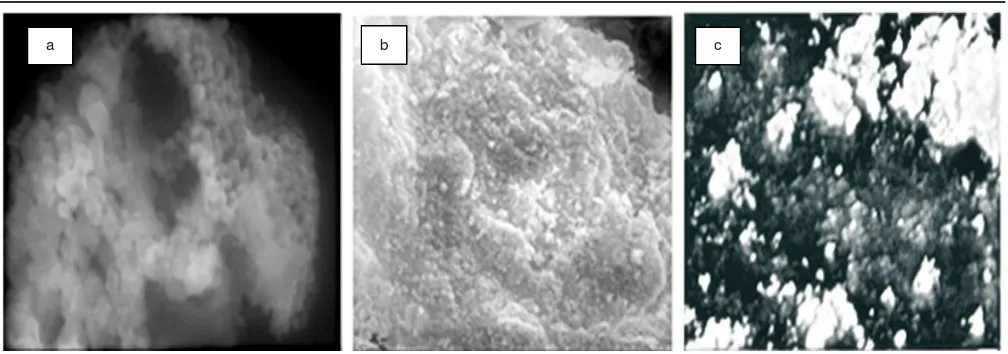
Characterization using scanning electron microscopy analysis: It is well acknowledged that surface characteristic is an important factor to determine the performance of solid material in the process involving the surface, such as catalytic reaction. In this respect, the samples investigated in this study were characterized using scanning electron microscopy analysis technique and the scanning electron microscopy analysis images obtained are shown in Fig. 2.
As can be seen from Fig. 2, SEM images demonstrated that the surface morphology of the samples are quite different, suggesting the effect of composition. In micrograph (a) shows that the NiFe1.9Co0.1O4 sample has an intact structure, marked
by contiguous and smooth surface and also has a cubic structure (Fig. 2a). These cubic structures were well distributed. So it can be said the cubic grains were homogeneous formed. The other samples, NiFe1.8Co0.2O4 and NiFe1.7Co0.3O4, on the other
A porous structure increases the surface area accessible to acid sites of material, leading to increased probability of acid-base reaction occured. It is then expected that freeze-drying will facilitate the formation of porous structures. Since micrographs of those samples display cubic grains which are minimal con-sisted of a couple cubic particle so it is hard to measure and determine definitely its particle size using scanning electron microscopy. Furthermore, the particle size of NiFe2-xCoxO4 is
determined by using Debye-Scherrer equation to difractogram-data representing the main peak of spinel structure27
.
X-Ray diffraction analysis: To investigate the crystalline nature of the samples, the X-ray characterization was carried out and identification of the peaks in diffractograms was carried out qualitatively by comparing the diffraction lines of the samples with those in standard from The powder diffraction files40
. X-ray diffraction analysis showed that the major phase obtained for the sample isspinel NiFe2O4(PDF-10-0325) and
spinel CoFe2O4(PDF-22-1086). The X-ray diffractograms for
the samples, together with some standards related to the pre-dicted phases of the samples are presented in Fig. 3.
Fig. 3 showed that the diffractograms are practically similar, suggesting that the composition has no effect on the crysta-llinity of the samples. The main phases observed are NiFe2O4
and CoFe2O4. However, other crystalline phases are also
identified, in such as NiO (JCPD file no. 47-1049) and Ni2O3
(JCPD file no. 14-0481) as minor phases. Furthermore, it has to be noted that crystalline phases of NiFe2O4 and CoFe2O4
have a similar spinel crystal structure and its peaks is a slightly
NiFe1.7Co0.304
NiFe1.8Co0.204
NiFe1.9Co0.104
0 10 20 30 40 50 60 70 80 90
Fig. 3. X-Ray diffractograms of the samples: (a) NiFe1.9Co0.1O4, (b)
NiFe1.8Co0.2O4 and (c) NiFe1.7Co0.3O4, with references of NiFe2O4
and CoFe2O4 (*), Ni2O3(+) and NiO (o) data
different. So it can be implied that both spinel crystalline phase structures are superimposed.
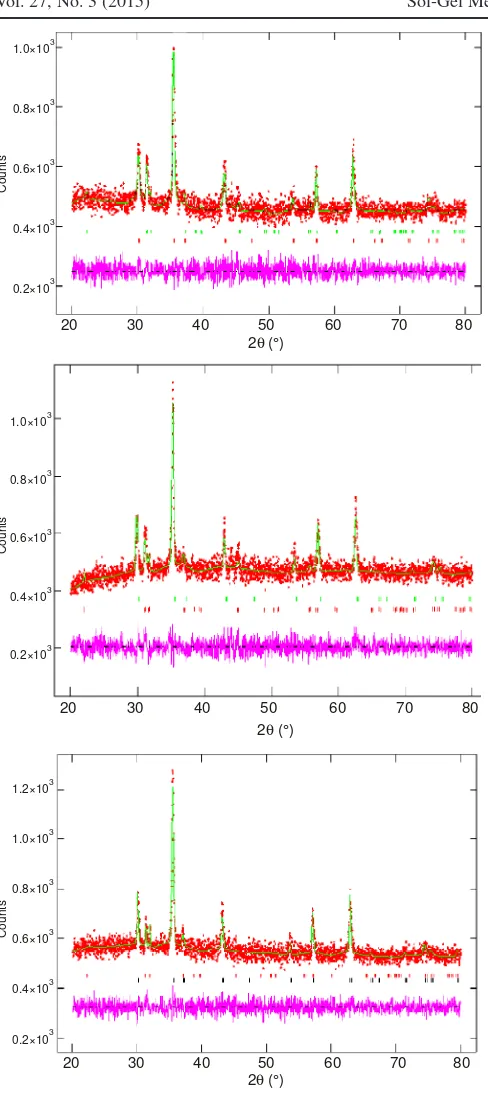
Furthermore, quantitative analysis of NiFe2-xCoxO4 (x =
0.1-0.3) materials using Rietveld method26 as shown in Fig. 4,
showed that spinel stucture of M1M2Fe2O4 (M1 = Ni and M2 =
Coy) is formed with different weight percentage of its
crystalline phase obtained and unit cell parameters as shown in Table-1. It can be implied that the relative crystalline phase composition (wt. %) of the sample is affected by the increasing of cobalt content.
However, the maximum crystalline phase of the spinel structure formed was happened on Co/Ni ratio of 0.25. It means that Co - addition into NiFe2O4 spinel type due to the formation
of NiCoxFe2-xO4 (A1A2B2O4 - type) spinel structure is limited
TABLE-1
RIETVELD REFINEMENT RESULTS OF NiFe2-xCoxO4(x = 0.1-0.3)
Unit cell parameter No. NiFe2-xCoxO4
a(Å) b(Å) c(Å) V(Å3
) χ2
Crystal system
Weight (%) NiFe2-xCoxO4
1 NiFe1.9Co0.1O4 8.354 8.354 8.354 583.02 0.765 Cubic 67.4
2 NiFe1.8Co0.2O4 8.354 8.354 8.354 583.03 0.847 Cubic 74.7
3 NiFe1.7Co0.3O4 8,349 8,349 8,349 582.11 0.699 Cubic 63.3
TABLE-2
PARTICLE SIZE CALCULATION USING DEBYE–SCHERRER EQUATION
Catalyst 2θ (°) hkl FWHM (β), radian Size of particle (D) (nm) NiFe1.9Co0.1O4 35.5 311 0.00326 44.8
NiFe1.8Co0.2O4 35.2 311 0.00605 24.1
NiFe1.7Co0.3O4 35.46 311 0.00942 15.5
c b
a
20 30 40 50 60 70 80
Fig. 4. Result quantitative analysis of NiFe2-yCoyO4 (y = 0.1-0.3)
diffractograms fitted using Rietveld method. The observed data are shown by the (+) red sign, and the calculated data is shown by a solid green line. The purple line (below) is the difference profile between observed and calculated data. The vertical lines (green and red) refers to point series of hkl
by Co/Ni ratio in this condition of preparation. This fact is clearly supported by its cell volume as shown in Table-2 and its density which is 5.240, 5.130 and 5.663 g cm-3, respectively.
Consequently, wt. % of other crystalline phases formed which is oxides of nickel (Ni2O3) and NiO as a minor phases was
also varied.
The particle size of NiFe2-xCoxO4 (x = 0.1-0.3) was
calcu-lated from the full width at half maximum (FWHM) of the
representative peak which is a strongest reflection crystalline phase of using the well-known Scherrer formula27:
D = k λ/β cos θ
where D is the crystallite size (nm), k is a constant with a range of 0.9-1.0, lis the X-ray wavelength of CuKα = 0.154 nm, β is the broadening of diffraction line measured at half maximum intensity (radian) and q is the Bragg's angle in degrees unit. The results are shown in Table-2.
Conclusion
Using egg white solution and freeze drying method is convinient for the synthesis of nano sized Ni-Co ferrites. X-ray diffraction pattern confirm that crystalline phase of spinel Ni-Co ferrites is obtained as much as 75 % at 600 °C. Particle sizes of 15-45 nm were obtained by using Debye-Scherrer calculation. The grain of nano sized Ni-Co ferrites particles is well distributed and homogeneous as confirmed by SEM analyse. FTIR spectra showed that the obtained Ni-Co ferrites materials have BrØnsted-Lowry and Lewis acid characteristics
as required to catalysis application. The Ni/Co content affected the formation of crystalline phase of Ni-Co ferrites. Further-more, this simple, relatively low temperature preparation and environmentally friendly method is a good alternative to obtain nano sized of spinel Ni-Co ferrites.
ACKNOWLEDGEMENTS
The authors thank and appreciate the Directorate General Higher Education Republic of Indonesia for research funding provided through The National Grant for Competitive Research University of Lampung and Ministry of Indonesia Higher Education program under contract No. 287/H26/PL/2013.
REFERENCES
1. C.A.G. Fajardo, D. Niznansky, Y. N'Guyen, C. Courson and A.-C. Roger, Catal. Comm., 9, 864 (2008).
12. J. Azadmanjiri, H.K. Salehani, M.R. Barati and F. Farzan, Mater. Lett., 61, 84 (2007).
13. Y.L.N. Murthy, I.V. KasiViswanath, T. Kondala Rao and R. Singh, Int. J. Chem. Tech. Res., 1, 1308 (2009).
14. P. Derakhshi, S.A. Khorrami and R. Lotfi, World Appl. Sci. J., 16, 156 (2012).
15. S. Singhal, J. Singh, S.K. Barthwal and K. Chandra, J. Solid State Chem., 178, 3183 (2005).
16. W. Trisunaryanti and H.S. Oktaviano, Indo. J. Chem., 8, 47 (2008). 17. Z.Z. Lazrevic, C. Jovalekic, A. Milutinovic, M.J. Romcevic and N.Z.
19. M.G. Naseri, E.B. Saion, H.A. Ahangar, M. Hashim and A.H. Shaari,
Powder Technol., 212, 80 (2011).
20. N. Yongvanich, P. Visuttipitukkul, P. Leksuma, V. Vutcharaammat and P. Sangwanpant, J. Metals Mater. Min., 20, 67 (2010).
21. M. Sarkari, F. Fazlollahib, H. Atashi, A.A. Mirzaeid and W.C. Hecker,
Chem. Biochem. Eng. Q, 27, 259 (2013).
22. S. Maensiri, C. Masingboon, B. Boonchom and S. Seraphin, Scr. Mater., 56, 797 (2007).
23. S. Maensiri, C. Masingboon, P. Laokul, W. Jareonboon, V. Promarak, P.L. Anderson and S. Seraphin, Cryst. Growth Des., 7, 950 (2007). 24. Y. Peng, D.J. Gardner and Y. Han, Cellullose, 19, 91 (2012). 25. A. Samimi and M. Ghadiri, Iran. J. Chem. Chem. Eng., 27, 69 (2007). 26. H.M. Rietveld, J. Appl. Cryst., 2, 65 (1969).
27. B.D. Cullity, Elements of X-ray Diffraction, Addison-Wesley, London, edn 2, p. 102 (1978).
28. J. Drbohlavova, R. Hrdy, V. Adam, R. Kizek, O. Schneeweiss and J. Hubalek,
Sensors, 9, 2352 (2009).
29. L.D. Hanke, Handbook of Analytical Methods for Materials, Materials Evaluation and Engineering Inc. Plymouth, pp. 35-38 (2001). 30. ASTM 4824-13, Test Method for Determination of Catalyst Acidity
by Pyridine Chemisorption, MNL 58-EB (2013).
31. E.P. Parry, J. Catal., 2, 371 (1963).
32. A.R. Swoboda and G.W. Kunze, Infrared Study of Pyridine Adsorbed on Montmorillonite Surface. Texas Agricultural Experiment Station, p. 277-288 (2006).
33. M. Yurdakoç, M. Akçay, Y. Tonbul and K. Yurdakoç, Turk. J. Chem., 23, 319 (1999).
34. J. Ryczkowski, Catal. Today, 68, 263 (2001).
35. F. Benaliouche, Y. Boucheffa, P. Ayrault, S. Mignard and P. Magnoux,
Micropor. Macropor. Mater., 111, 80 (2008).
36. J.-S. Kim, J.-R. Ahn, C.W. Lee, Y. Murakami and D. Shindo, J. Mater. Chem., 11, 3373 (2001).
37. Z. Wei, H. Qiao, H. Yang, C. Zhang and X. Yan, J. Alloys Comp., 479, 855 (2009).
38. R.M. More, T.J. Shinde, N.D. Choudhari and P.N. Vasambekar, J. Mater. Sci. Mater. Electron., 16, 721 (2005).
39. K. Tanabe, Solid Acids and Bases, Their Catalytic Properties, Kodansha, Tokyo, Academic Press, New York, London, p. 58 (1970).