CHARACTERISTICS OF NANOSIZE SPINEL NixFe3-xO4
PREPARED BY SOL-GEL METHOD
USING EGG WHITE AS EMULSIFYING AGENT
Rudy Situmeang
1,*, Sukma Wibowo
1, Wasinton Simanjuntak
1, R. Supryanto
1, Rizki Amalia
1,
Mitra Septanto
1, Posman Manurung
2, and Simon Sembiring
21
Department of Chemistry, University of Lampung, Jl. Prof. Soemantri Brodjonegoro No. 1 Bandar Lampung 35145, Indonesia
2
Department of Physics, University of Lampung, Jl. Prof. Soemantri Brodjonegoro No. 1 Bandar Lampung 35145, Indonesia
Received December 8, 2014; Accepted March 17, 2015
ABSTRACT
In this study, sol-gel method using egg white as emulsifying agent was applied to prepare nano size spinel NixFe3-xO4 (with x = 0.2–1). Sample preparation was carried out by mixing the solution of Fe(NO3)3.9 H2O and
Ni(NO3)3.6 H2O with egg white, and then the sample was stirred thoroughly using magnetic stirrer. After freeze–
drying process, the sample was subjected to calcination treatment and subsequently characterized. The phase composition was evaluated using the X-ray diffraction (XRD) technique, followed by quantitative analysis using Rietveld and Debye-Scherrer Methods. The functionality of the sample was identified using Fourier Transform Infrared (FTIR) spectroscopy, and surface morphology and elemental composition were analyzed using scanning electron microscopy coupled with electron dispersive spectroscopy (SEM/EDS). The results of XRD characterization indicated that materials consist of various crystalline phases, with NiFe2O4as a major phase. FTIR Analysis revealed
the existence of both Lewis and Brønsted–Lowry acid sites, with Lewis acid as the prominent site. The sample was found to display relatively homogeneous surface morphology, having the crystallite size in the range of 33 to 61 nm according to the Debye-Scherrer equation. The EDS data indicated that the ratio of Fe/Ni is in agreement with the composition of the raw materials used.
Keywords:nanomaterial; sol-gel method; Brønsted-Lowry and Lewis acid sites
ABSTRAK
Dalam penelitian ini metode sol-gel menggunakan putih telur sebagai pengemulsi diaplikasikan untuk pembuatan nanomaterial NixFe3-xO4(x = 0,2–1). Preparasi dilakukan dengan metode sol-gel dan karakterisasi yang
dilakukan meliputi difraksi sinar-X untuk mengetahui fasa kristalin yang terbentuk, spektrofotometer IR untuk identifikasi situs asam Brønsted-Lowry dan situs asam Lewis, SEM-EDS untuk morfologi dan sebaran atomnya. Analisis difraktogram bahan katalis NixFe3-xO4(dimana x = 0,2–1) menunjukkan bahwa fasa kristalin yang mayoritas
terbentuk NiFe2O4. Keasaman situs aktif secara spektrofotometri infra merah ditunjukkan pada bilangan gelombang 1727 dan 1613 cm-1 untuk situs asam Lewis dan bilangan gelombang 1409 dan 11363 cm-1 untuk situs Brønsted-Lowry. Hasil analisis mikroskop pemindaian elektron (SEM) menunjukkan bahwa distribusi partikel relatif lebih menyebar dengan bertambahnya kadar nikel. Ukuran partikel berkisar 33–61 nm. Selanjutnya, analisis EDS untuk sampel NiFe2O4mempunyai rasio Fe/Ni yang sesuai dengan rasio bahan baku yang digunakan.
Kata Kunci:nanomaterial; situs asam Lewis dan asam Brønsted-Lowry; metode sol-gel
INTRODUCTION
Ferrite compounds with spinel structure have attracted major attention due to their suitable properties for diverse technological applications, such as electronic devices [1-2], magnetic storages [3], and catalysis [4-5]. In general, the applications of this type of compound are governed by peculiar properties, which in turn depends on the chemical composition and microstructure [3,6].
Since chemical composition and microstructure are the prime factors to determine the suitability of spinel for
enhance the suitability of the product for specific applications [11-13].
Considering the advantageous performance of the sol-gel method, this method has been applied for preparation of several spinel nanocompounds. As an example, in the previous study [14], the sol-gel method was successfully used to prepare nickel-zinc ferrites composite followed by thermal treatment at 600–1000 °C. The product was reported to have the particle size of 80–200 nm and displays both excellent electrical resistivity and permeability properties. In another study, it was reported that using the sol-gel method followed by calcination treatment at 500 °C, nanosize Ni1-xMnxFe2O4
composite with the particle size of 23–38 Å was obtained [15]. The composite was reported to posses mixed spinel structure, in which normal and disorder spinel structures are coexist. The structure of spinel is of particular interest for its role in governing magnetic and electrical properties of the spinel. In the study by a research group of Poland [16] the application of the sol-gel method to produce CuFe2O4 composite from nitrate
salts in SiO2 matrix was reported. After sintering
treatment at 800–1100 °C, it was found that the sample has the particle size of 7–130 nm, and displays super magnetic property. Distribution of Fe3+ and Fe2+ ions in NixFe3-xO4 spinel structure was investigated by others
[17-18]. In the studies, a series of NixFe3-xO4 samples
was prepared using sol-gel method with different ratios of Ni/Fe. The results revealed that increased ratios of Ni/Fe led to increased magnetic and electrical conductivity of the products, which was suggested as a consequence of different quantity of normal and inverse spinel structure composing the sample.
Another aspect that has been found to influence the properties of product resulted using sol-gel method is the matrix of raw materials used. In addition to aqueous system, several studies have used different modifiers. For preparation of spinel NiFe2O4, the examples of
modifier used are CMC as template [18], TEOS as chelating agent [17], polyvinyl alcohol as powder binder [19], urea, glycine, and citric acid as organic complexant [20-21], and polyvinyl pyrrolidone as auto combustion enhancer [22]. The findings of these previous studies demonstrated that, in general, the use of modifiers enable the formation of products with better properties than those prepared without modifier.
Despite the advantages they offer, several disadvantages of modifiers should also be acknowledged, such as high cost, toxicity, and non-environmentally friendly. Considering the drawbacks associated with aforementioned modifiers, this current study was carried out to assess the potential of egg white as alternative modifier for preparation of (NixFe3-xO4) using sol-gel method followed by
freeze-drying process to remove the solvent. The main purpose
of the study was to investigate the effect of Ni/Fe ratio on the properties of the sample. The dry samples were calcined at 600 °C for 2 h, and subsequently characterized using the techniques of Fourier transform infrared (FTIR) spectroscopy, the X-ray diffraction (XRD), and scanning electron microscopy couple with electron dispersive spectroscopy (SEM/EDS).
EXPERIMENTAL SECTION
Materials
Chicken eggs were purchased from local market in Bandar Lampung, Fe(NO3)3.9H2O, and
Ni(NO3)3.6H2O (99%) were purchased from Merck.
Instrumentation
The instruments used for characterization were Fourier Transform Infrared (FTIR) spectrometer (Shimadzu Prestige-21) for identifying the presence of functional groups, and Scanning Electron Microscope and Electron Dispersive Spectroscopy (SEM-EDS, JSM-6360 LA) for morphological, micro-structures and composition identifications. A Philips X-ray
diffractometer (XRD) model PW 1710 with Cu-Kα
radiation was used for structural and crystalline phase identification.
Procedure
Preparation of NixFe3-xO4
Solid NixFe3-xO4 was prepared by dissolving
specified mass of Fe(NO3)3.9H2O, and Ni(NO3)3.6H2O,
respectively in 100 mL egg-white, to obtain different ratios of Fe/Ni, in which x = 0.2 to 1.0. The mixture was stirred until homogenous solution was obtained, and then freeze-dried. Dry samples were calcined to 600 °C for 6 h, using temperature program with temperature increase of 2 °C min-1.
Characterization of NixFe3-xO4
X-Ray diffractogram analysis. X-ray powder
diffraction pattern of the sample was recorded from 2 = 10 to 90° on a Philips diffractometer Model PW 1710 using Cu K radiation at a step 0.02°/sec. The phase identification was performed using search and match method by comparing the x-ray pattern of the sample to those of the standards in the ICCD-JCPD files, and identified phase was quantified using Rietveld method [23]. The particle size was determined using Debye-Scherrer method [24].
SEM and EDS analysis. To evaluate the surface
SEM-EDS Philips-XL, on polished and thermally etched samples with different magnifications [25].
Acid sites analysis of NixFe3-xO4. After heating at 120 °C, sample was transferred into a crucible and placed in vacuumized desiccator. Pyridine was transferred into another crucible and placed in the desiccator to allow the vapor of the pyridine to contact with the sample. After 24 h, the sample was taken from desiccator and left on open air for 2 h to expel the physically adsorbed pyridine from the sample. Finally, the sample was analyzed using the FTIR spectroscopy. The analysis was conducted by grinding the sample with KBr of spectroscopy grade, and scanned over the wave number range of 4000–400 cm−1[26-28].
RESULT AND DISCUSSION
X-Ray Diffraction Analysis
The X-ray diffraction analysis was carried out on five samples with different ratios of Ni/Fe. As a first assessment, the diffraction pattern of Ni0.6Fe2.4O4
together with some standards related to the predicted phases of the sample was presented in Fig. 1. With the aid of search and match method, it was found that the major phase is spinel NiFe2O4 (PDF-10-0325).
Additional phases identified are spinel Fe3O4
(PDF-19-0629) and NiO (PDF-47-1049) as a minor phase. To evaluate the effect of the nickel quantities on the formation of the spinel NiFe2O4 compound, the
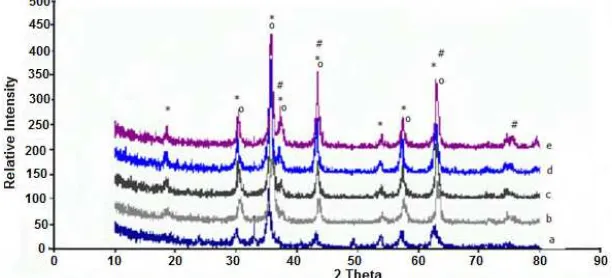
samples with different Ni contents were characterized similarly, and the X-ray diffraction patterns of the samples were compiled in Fig. 2. As can be seen in Fig. 2, the diffractogram are practically similar, with only slight difference in the intensity and the position of the representative peaks for spinel NiFe2O4 (2 and
intensity: 30.319 (30%); 35.730 (100%); 57.409 (30%); 62.974 (40%) according to JCPDF-10-0325). The intensity and position of the other phases (NiO and Fe3O4) were also observed. Based on the intensity, it is
concluded that the relative quantity of crystalline phase of spinel NiFe2O4 increased as Ni-content in the
sample increased, demonstrating the effect of composition on the phase formation.
Fig 1. Qualitative identification of crystalline phases in the Ni0.6Fe2.4O4 Diffractogram (red-line represents spinel
NiFe2O4 crystalline phase; green-line represents cubic NiO crystalline phase, and blue-line represents spinel Fe3O4
crystalline phase)
Fig 2.Diffractogram of various NixFe3-xO4 spinel after calcining at 600 °C in 2 h (a = Ni0.2Fe2.8O4, b = Ni0.4Fe2.6O4,
c = Ni0.6Fe2.4O4, d = Ni0.8Fe2.2O4, and e = NiFe2O4). The *) sign refers to spinel NiFe2O4; #) sign refers to NiO; and o)
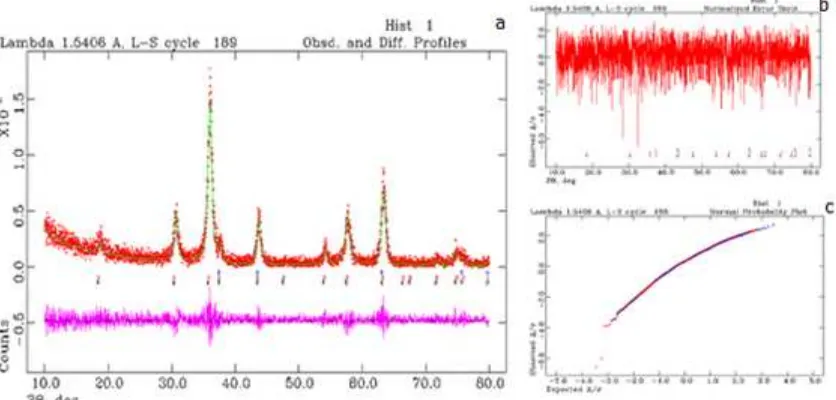
Fig 3. Result quantitative analysis of Ni.4Fe2.6O4 diffractogram fitted using Rietveld method. The observed data are
shown by the (+) red sign, and the calculated data is shown by a solid green line. The purple line (below) is the difference profile between observed and calculated data. The vertical lines (blue and red) refers to point series of hkl.
Table 1.Rietveld refinement results of NixFe3-xO4(x= 0.2–1.0) % crystalline Phase
No. NixFe3-xO4Sample NiFe
2O4 Fe3O4 NiO 2 Crystal system
1. Ni.2Fe2.8O4 85.92 10.77 3.32 1.123 spinel
2. Ni.4Fe2.6O4 94.95 3.27 1.78 1.126 spinel
3. Ni.6Fe2.4O4 86.21 9.77 4.02 1.124 spinel
4. Ni.8Fe2.2O4 90.54 7.77 2.69 1.12 spinel
5. NiFe2O4 96.35 2.73 0.92 1.13 spinel
Quantitative analysis of spinel NixFe3-xO4(x = 0.2–1)
materials using Rietveld method [23] is presented in Fig. 3, and show very good agreement between the observed and calculated, as reflected by very small differences of the plots (Fig. 3b and 3c).
Table 1 shows crystalline phases composition, crystal system, and weight percentage obtained from Rietveld refinement of the XRD data of NixFe3-xO4
sample calcined at 600 °C for 2 h. The goodness of fit () values are relatively low, 1.12–1.13, which is considered as acceptable according to basic principle of
, in which the value of less than 4 is considered satisfactory [23]. As shown in Table 1, the weight percentage of spinel NiFe2O4 is higher than 85%. This
result means that thermal treatment at 600 °C led to production of relatively high quantity of the spinel NiFe2O4. The data in Table 1 also demonstrate that
nickel quantity in the sample affected the formation and distribution of the phases, in which the formation of spinel NiFe2O4 tends to increase as nickel quantity
increased.
The crystallite size was calculated from the full width at half maximum (FWHM) of the peak with the
highest intensity representing the targeted phase. The calculation was based on the well-known Debye-Scherrer equation [24]:
cos
k
D
Where D is the crystallite size (nm), k is a constant with range of 0.9–1.0 (in this calculation, k = 0.95), is the X-ray wavelength used, in this case, Cu-K = 0.15406 nm, is the broadening of diffraction line measured at
half maximum intensity,
180xFWHM
(in radian), and
is the Bragg’s angle in degree unit. The calculation results are compiled in Table 2.
As shown in Table 2, the crystallite sizes of NixFe3-xO4 samples are in the range of 33–61 nm,
demonstrating the efficacy of the proposed method to produce nano-size spinel NixFe3-xO4. In relation with the
Ni contents, it was found that increased Ni-content from x = 0.2 to x = 0.6) resulted in increased particle size of the spinel NiFe2O4crystalline phase from around 34 to
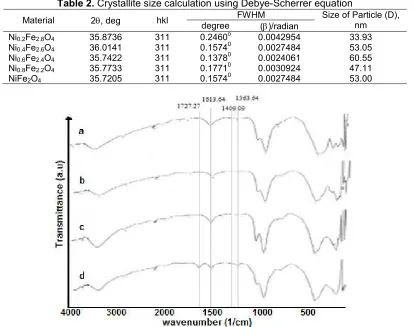
Table 2.Crystallite size calculation using Debye-Scherrer equation
FWHM
Material 2, deg hkl
degree ()/radian
Size of Particle (D), nm
Ni0.2Fe2.8O4 35.8736 311 0.2460o 0.0042954 33.93
Ni0.4Fe2.6O4 36.0141 311 0.15740 0.0027484 53.05
Ni0.6Fe2.4O4 35.7422 311 0.13780 0.0024061 60.55
Ni0.8Fe2.2O4 35.7733 311 0.17710 0.0030924 47.11
NiFe2O4 35.7205 311 0.15740 0.0027484 53.00
Fig 4. FTIR spectra of various NixFe3-xO4 spinel after exposing to pyridine (a = Ni0.4Fe2.6O4, b = Ni0.6Fe2.4O4, c =
Ni0.8Fe2.2O4, d = NiFe2O4)
x = 1.0. This inconsistent trend observed for the samples with x = 0.8 and x = 1.0 is most likely due to the coexistence of normal and inverse spinel in these two particular samples (29-31).
Acidity Analysis
In this study, Fourier transform infrared spectroscopy was applied to identify the functional groups present in the sample, primarily to identify the existence of Lewis and Brønsted-Lowry acid sites. The acid sites identification is of particular importance since the acidity is acknowledged as a very important characteristic which determines the performance of a material as catalyst [32-33]. The FTIR spectra of four samples investigated are shown in Fig. 4.
As can be seen in Fig. 4, the spectra are practically similar in terms of the absorption bands, with only some minor differences in relative intensities and positions of some bands, depending on the Ni/Fe ratio. In general, the peaks appeared at the wavelength range of 3500– 3000 cm-1are assigned to O–H stretching vibration, and the absorption bands located at 630–580 cm-1 and at
480–420 cm-1 are assigned to strong and weak stretching vibrations of M–O modes, respectively [33-35]. The presence of M–O modes is supported by the vibration band located at the wavelength of 570–560 cm-1. The existence of Brønsted-Lowry and Lewis sites is displayed by the absorption bands located at 1475– 1420 cm-1and 1620–1510 cm-1, respectively [35-36].
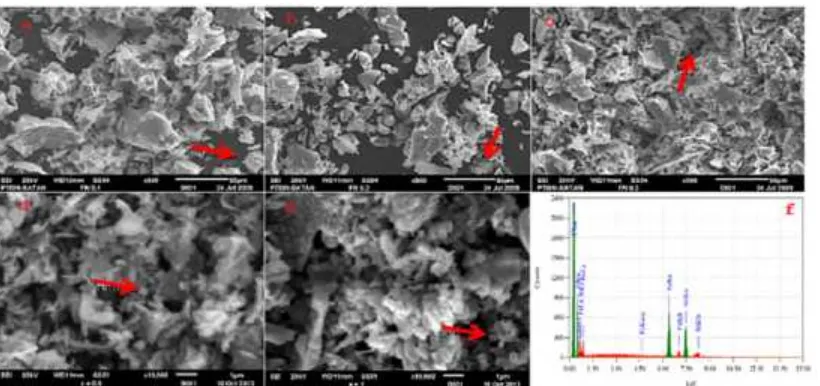
Fig 5. SEM micrograph of spinel NixFe3-xO4 materials (where x= 0.2–1 and a = Ni0.2Fe2.8O4; b = Ni0.4Fe2.6O4; c =
Ni0.6Fe2.4O4; d = Ni0.8Fe2.2O4; e = NiFe2O4) and EDS photograph (f = NiFe2O4where x = 1). Then, red-arrow pointed
a cubic form of spinel NiFe2O4
sites, it can be concluded that the acid characteristic of the samples is dominated by Lewis acid, and there is tendency that the Lewis acid strength increases with increased Ni content in the samples. In the fingerprint region of the spectra, the absorption band representing stretching vibration of Fe-O and bending vibration of Ni-O was detected at 617.22 cm-1 [33-34], suggesting the existence of Fe–O–Ni bond which confirms the formation of NixFe3-xO4structure as expected.
Microstructure Analysis
As generally known, the surface characteristic plays very important roles in the application of solid material in the process involving the surface interaction, such as catalytic reaction. For this reason, the samples investigated in this study were characterized using SEM and EDS technique [25-26]. The SEM micrographs of the samples and the EDS spectrum of a typical sample (NiFe2O4) are shown in Fig. 5.
As can be seen in Fig. 5, SEM micrographs of the samples display quite significant differences in terms of topography and morphology of the samples, suggesting the effect of compositions on the surface characteristics. The grain size and shape of spinel NiFe2O4 phase are
quite hard to identify. However, by careful inspection of a specific area, the presence of particle with cubic structure could be seen. An example is marked with red arrow. There is a possibility that the cubic structure is covered by carbon layer used as a coating material during characterization of the sample or residual carbon from the egg-white used for the preparation. Another possibility is agglomeration of the particle, leading to poor separation of the particles.
The EDS spectrum of a selected sample (NiFe2O4), displays the elemental composition of the
sample which in accordance with the ratio of Ni/Fe applied for preparation of the sample. This means that the proposed method practically causes no mass loss, and the raw materials were converted into product effectively.
CONCLUSION
This current study demonstrated the potential of egg-white solution as a emulsifying agent for preparation of nano-size materials using sol-gel method. The XRD results revealed that the particle size of the samples prepared are in the range of 33 to 61 nm. The samples were found to exhibit Lewis and Brønsted-Lowry acid characteristics, with Lewis acid as the dominant, as revealed by the FTIR analyses. The surface of the samples as seen by SEM is characterized by the existence of particles with varied sizes and shapes. The elemental composition of the surface obtained using the EDS technique is in accordance with the composition of the raw materials used for preparation of the sample.
ACKNOWLEDGEMENT
REFERENCES
1. Kumbhar, S.S., Mahadik, M.A., Mohite, V.S., Rajpure, K.Y., and Bhosale, C.H., 2014, Energy Procedia, 54, 599–605.
2. Valenzuela, R., Zamorano, R., Alvarez, G., Gutiérrez, M.P., and Montiel, H., 2007,J. Non-Cryst. Solids, 353(8-10), 768–772.
3. Jacob, B.P., Kumar, A., Pant, R.P., Singh, S., and Mohammed, E.M., 2011, Bull. Mater. Sci., 34(7), 1345–1350.
4. Chung, Y-M., Kwon, Y-T., Kim, T.J., Lee, S.J., and Oh, S-H., 2009,Catal. Lett., 131(3-4), 579–586. 5. Wolska, J., Przepiera, K., Grabowska, H., Przepiera,
A., Jabłonski, M., and Klimkiewicz, R., 2008, Res. Chem. Intermed., 34(1), 43.
6. Nejati, K., and Zabihi, R., 2012, Chem. Cen. J., 6, 23.
7. Chen, D.H., and He, X.R., 2001, Mater. Res. Bull., 36(7-8), 1369–1377.
8. Yang, J.M., Tsuo, W.J., and Yen, F.S., 1999,J. Solid State Chem., 145(1), 50–57.
9. Zhou, J., Ma, J., Sun, C., Xie, L., Zhao, Z., Tian, H., Wang, Y., Tao, J., and Zhu, X., 2005,J. Am. Ceram. Soc., 88(12), 3535 –3537.
10. Prasad, S., and Gajbhiye, N.S., 1998, J. Alloys Compd., 265(1-2), 87–92.
11. Perego, C., and Villa, P., 1997, Catal. Today, 34, 281–305.
12. Kumar, P., Mishra, P., and Sahu, S.K., 2011, Int. J. Sci. Eng. Res., 2(8), 1–4.
13. Maensiri, S., Masingboon, C., Boonchom, B., and Seraphin, S., 2007,Scr. Mater., 56, 797–800. 14. Zahi, S., Daud, A.R., and Hashim, M., 2007, Mater.
Chem. Phys., 106(2-3), 452–456.
15. Abbas, T., Hussein, A., and Niazi, S. B., 2009, J. Res. (Sci.), 20-21(1-4), 19–27.
16. Plocek, J., Hutlová, A., Nižňanský, D., Buršík, J., Rehspringer, J.-L., and Mička, Z., 2005, Mater. Sci.-Poland, 23(3), 697–705.
17. Wang, L., Li, J., Lu, M., Dong, H., Hua, J., Xu, S., and Li, H., 2015,J. Supercond. Novel Magn., 28(1), 191–196.
18. Li, D-Y., Sun, Y-K., Gao, P-Z., Zhang, X-L., and Ge, H-L., 2014, Ceram. Int., 40(10), Part B, 16529–16534.
19. Ali, I.O., 2014, J. Therm. Anal. Calorim., 116(2), 805–816.
20. Sutka, A., and Mezinskis, G., 2012, Front. Mater. Sci. China, 6(2), 128–141.
21. Sutka, A., Mezinskis, G., Jakovlevs, D., and Korsaks, V., 2013, J. Aust. Ceram. Soc., 49(2), 136–140.
22. Sivakumar, P., Ramesh, R., Ramanand, A., Ponmeshamy, S., and Methamizh, C., 2011,Mater. Res. Bull., 46(2), 2204–2207.
23. Rietveld., H.M., 1969, J. Appl. Crystallogr., 2, 65–71.
24. Cullity, B.D., 1978, Elements of X-ray Diffraction, 2nded. Addison-Wesley, London, 102.
25. Hanke, L. D., 2001, Handbook of Analytical Methods for Materials, Materials Evaluation and Engineering Inc., Plymouth, 35–38.
26. Parry, E.P., 1963,J. Catal., 2(5), 371–379.
27. ASTM 4824-13., 2013, Test method for Determination of catalyst acidity by pyridine chemisorption, MNL 58-EB.
28. Ryczkowski, J., 2001, Catal. Today, 68(4), 263–381.
29. Sutka, A., Mezinskis, G., Pludons, A., and Lagzdina, S., 2010,Energetika, 56(3-4), 254–259. 30. Carta, D., Loche, D., Mountjoy, G., Navarra, G.,
and Corrias, A., 2008,J. Phys. Chem. C, 112(40), 15623–15630.
31. Powder Diffraction File, 1997, Diffraction Data for XRD Identification, International Centre for Diffraction Data, PA, USA.
32. Lazarević, Z.Ž., Jovalekić, Č., Milutinović, A., Romčević, M.J., and Romčević N.Ž., 2012, Acta Phys. Pol. A, 121(3), 682–686.
33. Kim, J-S., Ahn, J-R., Lee, C.W., Murakami, Y., and Shindo, D., 2001,J. Mater. Chem., 11, 3373–3376. 34. Zhiqiang, W., Hongxia, Q., Hua, Y., Cairong, Z.,
and Xiaoyan, Y., 2009,J. Alloys Compd., 479(1-2), 855–858.
35. Yurdakoç, M., Akçay, M., Tonbul, Y., and Yurdakoç, K., 1999, Turk. J. Chem., 23(3), 319–327.