A MODELING APPROACH TO
COLLABORATIVE FOREST MANAGEMENT
By
HERRY PURNOMO
POSTGRADUATE PROGRAM
BOGOR AGRICULTURAL UNIVERSITY
HERRY PURNOMO. A Modeling Approach to Collaborative Forest Management. Under the direction of Rudy C. Tarumingkeng, Endang Suhendang, Dudung Darusman, Mohammad Syamsun and Upik Rosalina.
A successful sustainable development strategy requires that forest management be carried out in a participatory way. This includes the involvement of local communities. The importance of communities’ participation has been written into Indonesian Law No. 41 on Forestry (1999). However, how this law can be implemented in areas already allocated to a concession holder is still unclear. The state-owned company, Inhutani II Sub Unit Malinau, has managed a forest area in Malinau District, East Kalimantan for over 10 years. Forest-dependent communities located in the managed area were Long Seturan, Long Loreh and Langap villages. The company managed the area based on plans approved by the local and central] governments. They established permanent sample plots for measuring the stand growth and yield data in their area, and were asked to improve the well-being of local communities. However, the schemes did not give the company sufficient space to manage the area creatively, or provide a systematic way to involve the communities in the management of the forest.
This research was aimed at seeking scenarios of sustainable forest management (SFM) that addressed the above limitations. To reach this aim, two research hypotheses were proposed:
1. Local forest stakeholders can define their own SFM Criteria and Indicators (C&I) for specific sites where they live, or that concern them; 2. Collaborative management of forests by all relevant stakeholders will
achieve better forest management outcomes.
An artificial society of primary forest actors was built using a multi-agent system approach, used for developing scenarios to increase the sustainability of forest management. Indicators of forest cover and standing stock, communities’ incomes, company revenue and taxes paid to local and central governments measured the sustainability.
I herewith declare that the dissertation entitled “A Modeling Approach to
Collaborative Forest Management” is purely my work with the supervision of the
advisory committee. This dissertation has never been submitted to other
universities to get a similar degree. All data and information sources have been
stated clearly in the document and their correctness can be checked.
Bogor, 6 May 2003
Herry Purnomo
A MODELING APPROACH TO
COLLABORATIVE FOREST MANAGEMENT
By
HERRY PURNOMO
A Dissertation
In partial fulfillment of the requirements for
the degree of Doctor of Forestry Science
POSTGRADUATE PROGRAM
Dissertation Title : A Modeling Approach to Collaborative Forest Management
Name : Herry Purnomo
Student Registration
Number : 975068
Study Program : Forestry Science
Approved by,
1. The Advisory Committee
Prof. Dr. Ir. Rudy C. Tarumingkeng, MSc Chairperson
Prof. Dr. Ir. Endang Suhendang, MS
Member Prof. Dr. Ir. Dudung Darusman, MA Member
Dr. Ir. Mohammad Syamsun, MSc
Member Dr. Ir. Upik Rosalina, DEA Member
2. Head of Forestry Science
Study Program 3. Director of Postgraduate Program
Prof. Dr. Ir. Cecep Kusmana, MS Prof. Dr. Ir. Syafrida Manuwoto, MSc
BIOGRAPHY
The researcher was born in Lumajang, East Java, on 21 April 1964 as the
third child of Abdul Rasyid and the late Siti Masamah. His undergraduate
program was carried out as a Study Program at the Agricultural Meteorology,
Faculty of Science and Mathematics, Bogor Agricultural University, completed in
1987. In 1990, the researcher studied Computer Science at a Sandwich Program
in a cooperative program between the University of Indonesia and University of
Maryland USA for a Master of Science degree, completed in 1990. In 1997, the
researcher joined the Forestry Science Study Program, a Postgraduate Program
at Bogor Agricultural University, to do a Doctoral degree.
The researcher is a lecturer at the Faculty of Forestry, Bogor Agricultural
University. He primarily teaches Systems Analysis. He is also a researcher at
the Center for International Forestry Research (CIFOR) in Bogor.
During the doctoral study, he participated in training on Programming in
Logic (PROLOG) for Natural Resource and Environmental Management,
University of Edinburgh, United Kingdom (1998), and Artificial Society with
CORMAS (Common Pool Resources and Multi-agent Systems), Centre de
Coopération Internationale en Recherche Agronomique pour le Développement
(CIRAD), Montpellier, France (2000). In 2002, he presented a paper titled
“Development of Multi-stakeholder Scenarios of Secondary Forest Management:
A Multi-agent System Simulation Approach” in an international seminar on
Dipterocarp Reforestation to Restore Environment through Carbon
Sequestration, organized by Gadjah Mada University and KANSAI and KANSO
Japan in Yogyakarta. In February 2002, he presented another paper entitled
“Developing a Collaborative Model for the Management of the Areas Surrounding
on Forest Margin Interactions, organized by CIFOR Regional Office, Harare,
Zimbabwe. He also visited Beijing, China for presenting criteria and indicators for
sustainable forest management and related tools in June 2002
In the year 2002, as a senior author, he submitted five different scientific
papers to international journals. Two papers entitled “Multi-agent Simulation of
Alternative Scenarios of Collaborative Forest Management” and “Collaborative
Modelling to Support Forest Management: Qualitative Systems Analysis at Lumut
Mountain, Indonesia” will be published in the Journal of Forest Small Scale
Economics, Management and Policy, in the year 2003. The other three papers
ACKNOWLEDGMENTS
My sincere gratitude and appreciation go to my supervisors Prof. Dr. Rudy
C. Tarumingkeng, Prof. Dr. Endang Suhendang, Prof. Dr. Dudung Darusman, Dr.
Mohammad Syamsun and Dr. Upik Rosalina for their precious help, continuous
encouragement, and wise guidance during my graduate work. Without their
contributions, I would never have reached the goal of my doctoral program.
This study would not have been possible without the funding I received. I
would like to thank the Ministry of National Education, which provided me
financial support for this program. My thanks also to the Center for International
Forestry Research (CIFOR) that provided data and information essential to this
study. Special appreciation goes to Dr. Ravi Prabhu, Dr. Carol Colfer, Dr. Mandy
Haggith and Dr. Doris Capistrano, for their support and help during the
completion of this program. I would also thank Catherine Snow for her kind
English edit and polish.
Acknowledgment must also be extended to my late mother, my father, my
mother-in-law and family members who never forgot to support and pray for the
successful completion of my study. I also would like to express my thanks to
those involved in the CIFOR Adaptive Collaborative Management Project, CIFOR
Bulungan Research Forest and Inhutani II, for sharing data and knowledge during
the study. My thanks also to my colleagues at the Forest Management
Department, Faculty of Forestry, Bogor Agricultural University, for their
encouragement and support.
To my wife, Nina Yudisiana, and to my children, Ryan Maulana Herwindo
compassion and understanding have always been in my deepest heart. I could
never have successfully completed this task without their sacrifices.
Above all, praise is to Allah, the Almighty God, who created and sustains
us. He is The Ultimate One who has made the accomplishment of my mission of
study possible. May Allah, the most gracious and the Most Merciful, bless us and
TABLE OF CONTENTS
TABLE OF CONTENTS...v
LIST OF TABLES...vi
LIST OF FIGURES... viii
LIST OF APPENDICES ...x
I. INTRODUCTION ... 1
1.1. Background ... 1
1.2. Research Questions... 4
1.3. Research Objectives ... 6
1.4. Research Hypotheses... 6
II. LITERATURE REVIEW ... 8
2.1. Sustainable Development Conceptual Framework ... 8
2.2. Local Knowledge and Perspectives... 11
2.3. Knowledge Base System Development ... 13
2.4. Multi-agent Systems... 16
2.5. Forest Stand Dynamic... 23
III. RESEARCH METHODS ... 25
3.1. Research Framework... 25
3.2. Site... 26
3.3. Methods... 27
IV. RESULTS AND DISCUSSIONS... 47
4.1. Generic C&I Knowledge for Sustainable Forest Management ... 47
4.2. Local Knowledge for Sustainable Forest Management... 74
4.3. Testing the First Hypothesis ... 84
4.4. Knowledge Base System of Criteria and Indicators ... 90
4.5. Artificial Society of Forest Actors ... 97
4.6. Collaboration Scenarios and Testing the Second Hypothesis ... 134
V. GENERAL DISCUSSION AND POLICY LINKS... 150
5.1. Incorporating Local Knowledge in Decentralization Policy... 152
5.2. Collaborative Forest Management... 155
5.3. Adaptive Decentralization policy... 159
VI. CONCLUSIONS AND FUTURE WORKS ... 161
6.1. Conclusions... 161
6.2. Future Works... 161
REFERENCES... 163
LIST OF TABLES
Table 2.1. The differences between scientific and indigenous or traditional
knowledge (Walker 1994)... 14
Table 3.1. Villages inside Inhutani II boundary ... 37
Table 3.2. Presence or absence indicator of each knowledge type ... 38
Table 4.1. The generic knowledge of ecological criteria for SFM... 53
Table 4.2. The generic knowledge of economical criteria for SFM... 55
Table 4.3. The generic knowledge of social criteria for SFM... 57
Table 4.4. The generic knowledge of SFM... 57
Table 4.5. A comparison of the developed C&I with the ITTO’s C&I... 59
Table 4.6. A comparison of the developed C&I with FSC’s P&C... 61
Table 4.7. A comparison of the developed C&I with the Montréal Process C&I 63 Table 4.8. A comparison of developed C&I with Finnish C&I ... 64
Table 4.9. A comparison of the developed C&I with ATO’s C&I... 66
Table 4.10. Generic C&I and their types ... 69
Table 4.11. Summary of C&I comparison and their categories ... 70
Table 4.12. Revised Generic C&I ... 72
Table 4.13. Supernatural indicators of good forest management, as identified by the local communities ... 81
Table 4.14. Policy indicators of good forest management, as identified by the local communities ... 81
Table 4.15. Socio-economic indicators of good forest management, as identified by the local communities ... 82
Table 4.16. Biophysical indicators of good forest management, as identified by the local communities ... 83
Table 4.17. The knowledge comparison between scientific and local knowledge ... 84
Table 4.18. Falsification of supernatural generic indicators... 87
Table 4.19. Falsification of policy generic indicators... 87
Table 4.20. Falsification of socio-economic generic indicators... 88
Table 4.21. Falsification of biophysical generic indicators ... 89
Table 4.22. The hierarchy of nodes... 93
Table 4.23. Stakeholder identification using “Who Counts” matrix... 98
Table 4.24. The stakeholders’ characteristics and their primary identified goals ... 100
Table 4.25. The stakeholders’ primary activities ... 100
Table 4.26. Budget projection of Inhutani II (in thousand rupiah)... 106
Table 4.27. Sequence diagram of agent interactions... 107
Table 4.28. Local communities’ response to events ... 109
Table 4.29. Forest Cover of Inhutani II year 1991... 116
Table 4.30. Landsat image interpretation and simulation results on ... 117
Table 4.31. Average number of trees per Ha of pristine forest stand before logging... 120
Table 4.32. Stand structure Dynamics Components (Septiana, 2000) ... 121
Table 4.33. Number of trees per Ha of pristine forest stand before logging after ... 122
Table 4.34. Simulation result of the revenue, cost and net revenue (in million rupiahs) ... 124
Table 4.35. The timber production of Inhutani II ... 126
Table 4.37. Regulations applied to concession holders... 130
Table 4.38. Amount of money paid by concession holders ... 131
Table 4.39. The overall model evaluation ... 133
Table 4.40. Criteria for collaborative timber harvesting from the perspective of two parties... 136
Table 4.41. Simulation outputs as biophysical indicators of the model ... 139
Table 4.42. Simulation outputs (In million rupiahs per year) as economic indicators of the model under the collaborative scenario ... 140
Table 4.43. Scenarios examined using simulation... 143
Table 4.44. The simulation outputs for non-collaboration and scenario A... 144
Table 4.45. The simulation outputs for non-collaboration and scenario B... 145
Table 4.46. The simulation outputs for non-collaboration and scenario C ... 146
LIST OF FIGURES
Figure 2.1. Conceptual framework for sustainability assessment... 9
Figure 2.2. Normative and scientific aspects of sustainability (modified from Becker 1997)... 10
Figure 2.3. The stakeholders conceptualized components (in box) and their perceived categories (in italic) of “good forest management” (Kearney et al. 1999) ... 12
Figure 2.4. The general architecture of a knowledge base system ... 13
Figure 2.5. Model of a fuzzy system (Panigrahi 1998)... 16
Figure 2.6. Qualitative and quantitative reasoning (Guerinn 1991) ... 17
Figure 2.7. Perception and action subsystems (Weiss 1999)... 18
Figure 2.8. Agents that maintain state (Weiss, 1999) ... 19
Figure 2.9. Schematic diagram of a generic belief-desire-intention architecture (Weiss 1999)... 20
Figure 2.10. Coordination among agents (Ossowski 1999)... 21
Figure 2.11. Comparison in methods of problem solving (modified from Holling 1978, and Starfield and Bleloch 1988 in Grant et al., 1997)... 22
Figure 3.1. The research sequence... 28
Figure 3.2. P, C & I concept for sustainable forest management assessment... 32
Figure 3.3. A network of C&I for sustainable forest management assessment.. 33
Figure 3.4. Relationship of conditions and indicators of sustainability ... 35
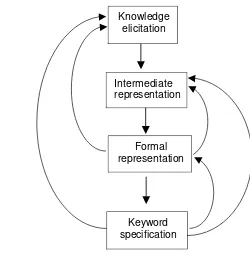
Figure 3.5. The four principle activities in the creation of knowledge base (Walker et al. 1994) ... 39
Figure 3.6. KBS inference engine... 40
Figure 3.7. An example of model components and their interaction located in the spatial system ... 41
Figure 3.8. Spatial representation of the firm’s activities and the movement of villagers ... 42
Figure 3.9. Communication among forest stakeholders ... 42
Figure 4.1. Organization of a forest ... 48
Figure 4.2. A model of a forest ... 50
Figure 4.3. Original and new functions of forests due to management ... 50
Figure 4.4. Trade-off situation faced by forest managers ... 51
Figure 4.5. The synergy situation faced by forest managers... 52
Figure 4.6. Number of stems and diameter class relationship... 54
Figure 4.7. Learning mechanisms of stakeholders ... 56
Figure 4.8. Swidden agriculture activities... 76
Figure 4.9. A typical village with its swidden agriculture (j is jekau) ... 77
Figure 4.10. The KBS architecture ... 91
Figure 4.11. Network of nodes that represent criteria and indicators ... 92
Figure 4.12. The argumentation process ... 93
Figure 4.13. The relation between nodes... 94
Figure 4.14. Assessment process ... 95
Figure 4.15. The architecture of the simulation model... 103
Figure 4.16. Main menu of ‘Forest Actors’ ... 112
Figure 4.17. The situation map of study area in 1991... 113
Figure 4.18. The communication observer... 114
Figure 4.19. The example of simulation output diagrams... 115
Figure 4.21. Diagram of vegetation areas after eight year's simulation time.... 118
Figure 4.22. Pristine forest stands structure... 121
Figure 4.23. . Number of trees per Ha of pristine forest stand before logging after ... 122
Figure 4.24. The simulation result of standing stock for 20 years ... 123
Figure 4.25. Simulation result diagram of the revenue, cost and net revenue . 124 Figure 4.26. Diagram of the difference between the actual net revenue and its plan ... 127
Figure 4.27. The income per household (in rupiahs), showing the communities’ products at fixed price in the year 2000. ... 129
Figure 4.28. The income per household (in rupiahs) using the communities’ product prices in the year 2000, with 10 % inflation ... 129
Figure 4.29. Simulation results of financial payments... 132
Figure 4.30. A social phenomenon of collaboration... 135
Figure 4.31. Development of collaboration scenarios... 136
Figure 4.32. The simulation map showing results of non-collaborative and collaborative management ... 141
Figure 4.33. Nine different simulation outputs of the best scenario (Scenario B). The collaboration area is black... 148
Figure 5.1. Plausible connections in a decentralization policy that... 154
LIST OF APPENDICES
Appendix 1. Interview guide of local knowledge on forest management... 172
Appendix 2. List of criteria and indicators from internationally recognized... 173
Appendix 3. The screen shows of the implementation of the built KBS ... 195
Appendix 4. The selected stakeholders’ characteristics ... 201
Appendix 5. Digital maps used in the simulation... 203
Appendix 6. Costs and revenues of Inhutani II ... 207
1.1. Background
Any research on sustainable forest management requires an
understanding of what these terms constitute, both on a local and generic level.
A forest is an ecosystem characterized by more or less dense and extensive tree
cover, often consisting of stands that vary in species composition, structure, age,
class, and associated processes. It commonly includes meadows, streams, fish
and wildlife (Helms 1998). Helms formulated forest management as the practical
application of biological, physical, quantitative, managerial, economic, social, and
policy principles to the regeneration, management, utilization, and conservation
of forests in order to meet specific goals and objectives while maintaining the
productivity of forests. In other words, forest management means managing
forest ecosystems to meet specific goals and objectives.
Indonesian forests are complex ecosystems, requiring efficient forestry
management. This involves consideration of forest management issues including
the richness of living organisms in forests, the uniqueness of forest-dependent
people, multiple products produced from the forests and property rights problems.
Good forest management takes into account all these aspects.
The Government of the Republic of Indonesia, through the Ministry of
Forestry, stated that all forest production should be managed sustainably. It is
obvious that sustainability involves satisfying present needs without
compromising future options. But what does this mean in terms of forest
management? In order to understand whether a particular forest is managed
sustainably or not, a set of criteria and indicators for assessment is required.
Research by Osmaton (1968) revealed that in good forest management,
management to the full. Without such an ideal, the organization of ways and
means becomes disoriented and there is no standard by which to measure the
efficiency of forest management. This ideal state of perfection is called a ‘normal
forest’. To satisfy the chosen target of management, the ‘normal forest’ must
possess certain general attributes, namely:
a. The specific composition, structure or form of the forest must be in
harmony with the local environment. The choice of species grown and
methods of silviculture adopted have to suit the particular site. Only then
can complete growth be secured.
b. The growing stock of trees must be constituted to provide the greatest
possible quantity of desired forest products ( with intangible benefits).
In 1992, the International Tropical Timber Organization (ITTO) published
criteria for the measurement of sustainable tropical forest management at
national and forest management unit (FMU) levels. Webster’s New World
Dictionary (Neufeldt and Guralnik 1988) defined criterion as a standard, rule, or
test by which something can be judged. The Society of American Foresters
(Helms 1998) defined criterion as a category, condition, or process by which
sustainable forest management may be assessed. The ITTO (1998) defined
criterion as an aspect that is considered important by which sustainable forest
management may be assessed. A criterion is accompanied by a set of related
indicators. The ITTO’s criteria for sustainable forest management at FMU level of
the year 1992, are: resource security; continuity of timber production;
conservation of flora and fauna; acceptable level of environmental impact;
economic benefits; planning and adjustment to experience.
In 1998, the ITTO updated their criteria and indicators (C&I) based on the
the components of sustainable forest management. This 1998 criteria covered:
enabling conditions for sustainable forest management; forest resource security;
forest ecosystem health ; the flow of forest produce; biological diversity; soil and
water; and economic, social and cultural aspects.
There are still a lot of questions to address in relation to the C&I, including
how to measure it in the field, how to reason and how to justify the sustainability
of forest management practices. The concept of C&I has been broadly adopted in
the forestry sector as a common approach to conceptualizing and evaluating
SFM. C&I is used to assess the quality of management and the ecosystem.
Other key programs and situations in which C&I have been created,
adopted or reformulated for the purposes of sustainable forest management are
the Smartwood Program (1993), Amazon Cooperation Treaty A.C. (1995), The
Montreal Process (1995), Scientific Certification Systems (1995), and the African
Timber Organization (1996), Forest Stewardship Council A.C. (1996), Center for
International Forestry Research (CIFOR, 1996), and Lembaga Ekolabel
Indonesia (LEI, 1997).
Criteria and indicators developed by ITTO can be categorized as generic
C&I. It is not scientifically accepted that a single set of C&I can be implemented
everywhere without adaptation. Any set of C&I needs to be adapted to the local
situation by taking into account local physical, biological, economic and social
conditions. For this purpose, it is necessary to develop a tool for modifying and
adapting the generic C&I. In addition, an inference tool by which a conclusion of
assessment is made is required – a matter still untouched in the ITTO guidelines.
This tool would reflect the capability of reasoning through C&I.
Approaching sustainability and C&I as a system is necessary to
understand their components and links. A systems approach to sustainability
Such an approach involves establishing general principles with which to
draw inferences about likely and actual interactions between the systems under
consideration. These principles can also be used to analyze and observe
patterns of interaction between systems (Clayton and Radcliffe 1996). The
linkage of C&I forms a network instead of a hierarchy. A C&I network is similar to
the concept of a semantic network, which is a way to represent knowledge for a
particular domain. Thus, a sustainable forest management assessment needs a
tool which would enable reasoning through a network of knowledge.
Application of a knowledge-base systems approach to sustainable forest
management assessment is quite new. There is no detailed research that has
been done in this area. However, the application of a knowledge base systems
approach in forestry has been introduced. Walker (1994) developed a
knowledge base systems approach to agro-forestry research and extension.
Walker developed a methodology for the acquisition, synthesis and storage of
knowledge. This was achieved by using the application of a knowledge base
systems technique, an AKT2 (Agroforestry Knowledge Kit) - a software toolkit
developed in PROLOG, an artificial intelligence programming language. It
provides the user with an environment for the creation, storage and exploration of
a large knowledge base, containing knowledge on specific topics drawn from a
range of resources.
1.2. Research Questions
Criteria and indicators for forest sustainability in Indonesia have been
formulated. The process was likely to have been similar to formulating TPTI
(Tebang Pilih Tanam Indonesia or Indonesian Selective Cutting and Planting).
One of the widely detected failures of the TPTI was its incompatibility to all
site. Any general formula on how to manage all forests will never be adequate.
Furthermore, the sustainability of forests is not only assessed by biophysical
indicators, but also by socio-economic indicators which take into account local
stakeholders, including forest-dependent people.
Considering forests are complex ecosystems, any formula to manage
them should be adapted to suit the specific site and local cultures. Room for
modification and adaptation should always be provided. Criteria & indicators of
forest sustainability as a tool for managing forests should also be adaptive.
A forest is not only characterized by its complex ecosystem, but also by
the complex social system around it. Different stakeholders with legitimate
interests in using the forest are located in the same area. An arrangement for
those stakeholders to share the benefits and costs of managing the forest is
required. However, the impacts of any policy option on collaborative forest
management between stakeholders always takes many years to measure - often
beyond the time allocated for research on the subject. How can we ensure that
collaborative arrangements are leading to better results for both stakeholders and
the long-term sustainability of forests? A simulation model is an appropriate
approach to use when the system is large and complex, and requires the ability
to observe potential impacts of different options on forest management.
“Simulation” means making a simplified representation of the reality.
Concerning those problems, the research tried to find the possible
answers for the following questions,
a. Could indigenous knowledge of forest-dependent people be
incorporated into current/generic knowledge to assess the
sustainability of forests?
b. Could an artificial society of forest actors be built and simulated in
1.3. Research Objectives
The objectives of the research were:
a. To harmonize the relationship between local people and modern
actors in the framework of a multi-stakeholder forest management
aimed at achieving sustainable forest management;
b. To develop tools to facilitate collaborative management of the forest.
1.4. Research Hypotheses
The research hypotheses were formulated as follows:
a. Local communities of forest-dependent people can define their own
sustainable forest management criteria and indicators suitable to the
specific site in which they live or depend on;
b. Involving local communities of forest-dependent people in the forest
management scheme can lead to better sustainability outcomes.
The research involved finding out what sustainability constitutes from
different angles and ways to go about achieving it. The first angle was modern
knowledge. This modern knowledge ideally becomes the basis on which
governments and forest managers develop sound forest management
approaches. Another angle was the knowledge of forest-dependent people who
live in the same area as the forest. The first hypothesis assumed the conformity
of the modern and local knowledge. It rose due to the fact that some people
were in doubt about the capacity of local people to understand and manage
forest sustainability.
The second question was how to achieve sustainability given each
stakeholder has a different interest in the forest. If there was a shared ideal
possible. Otherwise, co-existence was a possible scenario as an alternative to
II.
LITERATURE REVIEW
2.1. Sustainable Development Conceptual Framework
According to Webster’s New World Dictionary (1988), the etymological
root of sustainability is derived from the Latin verb sustenere (= to hold). This
etymology is also reflected in the debate among Spanish-speaking scientists
about whether sostenibilidad (from sostener) or sustentabilidad (from sustentar)
is the more accurate translation. The first term is closer to “being upheld” while
the latter term is closer to “to uphold” (Becker 1997). The latter terminology
indicates a strong normative component in the concept of sustainable
development.
Sustainable development has an essentially normative character, which
makes it difficult to put into practice. It implies a close relationship between
environmental considerations and economic growth. Within sustainable
development, economic and social objectives must be balanced against natural
constraints. A spirit of solidarity with future generations is included in the
concept. Sustainable development is based on the common principles of
self-reliance, fulfillment of basic needs and quality of life (Schtivelman and Russel
1989). Bruntland’s Commission defined sustainable development as a process
in which the exploitation of resources, direction of investments, orientation of
technology development and institutional changes are all in harmony, enhancing
both current and future abilities to meet human needs and aspirations(WCED
1987 in Haeruman 1995). Sustainable development must involve an
interdisciplinary approach. To present the interdisciplinary nature of sustainability
assessment, a conceptual framework or basic structure for sustainability
Figure 2.1. Conceptual framework for sustainability assessment (Modified from Becker 1997)
The framework shows very clearly that an assessment of sustainable
development must involve consideration of society’s ethical or cultural values.
Thus, any discussion about sustainable development in Indonesia should involve
an understanding of local values.
In addition, the policy environment has an impact on sustainability
assessment. Neglecting policy considerations in an assessment is likely to lead
to an incorrect assessment result. Figure 2.1 shows that development is
sustainable if it is economically viable, environmentally sound, socially accepted,
culturally appropriate and based on a holistic scientific approach.
As previously mentioned, sustainable development has normative and
scientific aspects - these are depicted in Figure 2.2. The normative approach
sees sustainable development as leading to the wise use of natural resources
and environmentally sound activities. It deals with nature and environmental
values, intergenerational and intra-generational equity. To be scientifically Culturalvalues of a society
Economic viability
Biophysical and environmental qualities
Socio-economic well-being
Policy environment Sustainable
sound, a new paradigm should be implemented that takes into account all
relevant factors.
Figure 2.2. Normative and scientific aspects of sustainability (modified from Becker 1997)
Webster’s New World Dictionary (1988) defines paradigm as an overall
concept accepted by intellectuals as a science, because of its effectiveness in
explaining a complex process, idea, or set of data. The vision of sustainable
development must be placed into a new development paradigm which allows for
the actual implementation of sustainable development. In the implementation,
environmental, economic and social disciplines should be taken into account
when assessing sustainability.
Sustainable development
Vision Operationalization
Normative aspect
Scientific aspect
Paradigm
Criteria: • Environmental
• Economic
• Social
Policy
Ethical preconditions: • Value of nature
• Intergenerational equity
2.2. Local Knowledge and Perspectives
Wavey (1993) stated that recently, academics, scientists and
researchers have “discovered” that the knowledge which indigenous people hold
about the earth, its ecosystems, wildlife, fisheries, forests and other integrated
living systems is both extensive and extremely accurate. On the eve of the 500th
anniversary of Christopher Columbus having stumbled upon North America, it is
appropriate to provide comments from an indigenous North American person on
how they perceive the concept of “discovery’.
Johannes (1993) suggested that research on indigenous people, their
traditional ecological knowledge and management systems should focus on four
essential perspectives and frames of reference:involving taxonomic, spatial,
temporal and social factors. Kearney et al. (1999) studied stakeholders’
perspectives on appropriate forest management in the Pacific Northwest of North
America by using a conceptual content cognitive map (3CM) and semi-structured
interviews. The study found how stakeholders conceptualised “good forest
management”, as shown in Figure 2.3. Three stakeholders were identified in the
study - environmentalist, industrialist and government (United State Forest
Service) stakeholders. Each explained their perspective on “good forest
management” which was then categorized. It was found that different
Figure 2.3. The stakeholders conceptualized components (in box) and their perceived categories (in italic) of “good forest management” (Kearney et al.
1999) Bringing stakeholders together Humble approach to management Public affairs/acceptance decide on habitat that must stay understand ecosystem manage recreation minimize damage avoid roads impact of roads non-timber resources effects on all
resources
resources are public (philosophy)
economics
Timber activities Understanding ways to
sustain the ecosystem
avoid clear cuts
Looking at all Resources economics reforestation regulation road construction riparian areas water quality public recreation issues views wildlife landscape management habitat after harvest habitat prior to harvest
Business Water Habitat
Stakeholder II: An industry participant’s representation
look at whole, not pieces
leave some areas to nature spiritual values collaborate with various interests educate public manage for goods & services
multiple uses
affect forest positively
Active management
2.3. Knowledge Base System Development
A knowledge base system (KBS) is a combination of a knowledge base
(an articulated and defined set of knowledge) and an inference engine. Inference
engine is a logic-based algorithm that draws inferences and conclusions from the
broad knowledge base. A knowledge base system is ‘domain specific’, meaning it
is developed for a particular knowledge. The knowledge has to be clearly
declared, to ensure the inference engine can accurately ‘reason’ with that
knowledge. Figure 2.4. describes the general architecture of a knowledge base
system. The knowledge base is comprised of any type of relevant knowledge
including local and scientific knowledge.
Figure 2.4. The general architecture of a knowledge base system
The body of knowledge is obtained from experts in a particular domain of
knowledge. The outcome of this process can be expressed in languages such as
English and Bahasa Indonesia instead of computer languages. It is important to
make the outcomes understandable to all stakeholders who are involved in the
knowledge base system development. These stakeholders should be able to
testify to the outcomes drawing on their own knowledge or by reviewing relevant
literature. The domain experts consist of scientists and traditional experts. In
forest sustainability assessment, the local people, who have extensive User
Interface Inference Engine Working Memory
Knowledge Base
experience in managing forests, can act as local experts. Structuring and
incorporating these two types of knowledge is challenging, because the
methodology used to form indigenous or traditional knowledge is often different
to the methodology used in scientific knowledge. These differences are shown in
Table 2.1.
Table 2.1. The differences between scientific and indigenous or traditional knowledge (Walker 1994)
Characteristics Scientific Knowledge Indigenous Knowledge
Scale Universal Local
Supernatural Absent Present
Transmission Formal Informal
Leaders Professional Informal leaders
Methodology Hypothesis and experiment Live experiences Original Lifestyle Western world Eastern world Viewing natural
resources
Exploiting natural resources Harmony with nature
Forests, from a scientific knowledge perspective, are regarded as sources
of biodiversity. Traditional knowledge practitioners use the forest as a source of
traditional medicine. Many of these traditional practitioners live a subsistent
lifestyle. To assess whether forest management practices maintain forest
biodiversity, scientific knowledge needs to use certain assessment parameters -
for instance, a Simpson Index or Shannon-Wiener Index, during the forest
utilization period. Sometimes, this is impractical, because it is difficult to show
changes in biodiversity during the utilization period. Traditional experts may
This is not always the case, but generally it offers a possible way to complement
modern knowledge in measuring biodiversity.
Knowledge synthesizing between different sources is critical to
sustainable forest management. One rule of thumb is using scientific knowledge
for universal ideas or concepts and traditional or indigenous knowledge for local
applications. It complies with a well-known environmental principle: “think globally
act locally". Scientific knowledge is not adequate to understand the complexity of
all forest eco- and social systems. Indigenous knowledge is not optional, but a
necessary condition to gain a greater understanding of forests. Furthermore, the
term ‘sustainability’ is influenced, if not dominated, by cultural values.
Sukadri (1997), at the XI World Forestry Congress in Antalya, Turkey,
revealed there are many different ways to analyze and assess policy reform for
sustaining forests, one of them, through ‘expert system’ application.
Guangxing Wang (1998) developed an expert system to improve forest inventory
and monitoring. This involves incorporating multi-source knowledge into the
knowledge base, with three paradigms of rule-based, object-oriented, and
procedural programming.
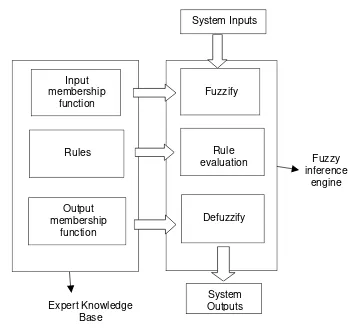
Panigrahi (1998) urged the utilisation of fuzzy logic in biology and
agriculture KBS decision-making techniques in response to its lack of quantitative
knowledge in some parts. The fuzzy system model is depicted in Figure 2.5.
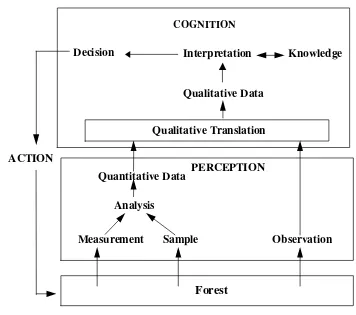
Guerinn (1991) used qualitative reasoning for ecological process modelling in
hydro-ecology. The architecture of his model is shown in Figure 2.6. Both the
fuzzy system and qualitative reasoning help us tackle uncertainties when we are
Figure 2.5. Model of a fuzzy system (Panigrahi 1998)
2.4. Multi-agent Systems
Using a simulation model is an appropriate approach when the system is
large, complex and requiring a study of different potential impacts of various
options. Simulation means making a simplified representation of a reality. Just as
a model aircraft captures many important physical features of a real aircraft, a
simulation model captures important operational features of a real system (CACI
n.d.).
One well-known computer-based simulation dealing with this matter is a
systems dynamics approach. This provides an understanding of how things have
changed through time (Forrester 1999). System dynamics software such as
STELLA, POWERSIM, SIMILE and VENSIM helps to formulate a model using
stock and flow components according to difference equations. Systems Input
membership function
Rules
Output membership
function
Fuzzify
Rule evaluation
Defuzzify System Inputs
System Outputs Expert Knowledge
Base
Fuzzy inference
dynamics has its roots in the systems of difference and differential equations
(Forrester 1980). The difference equation is usually used on biophysical
problems where the future state depends on the current state and other factors.
Another system is the multi-agent system (MAS), which focuses more on
stakeholders’ interactions.
Forest
Measurement
Sample
Observation
Analysis
Quantitative Data
Qualitative Translation
Qualitative Data
Interpretation
Knowledge
Decision
ACTION
COGNITION
[image:32.612.130.486.230.545.2]PERCEPTION
Figure 2.6. Qualitative and quantitative reasoning (Guerinn 1991)
MAS is an emerging sub-field of artificial intelligence that aims to provide
both principles for the construction of complex systems involving multiple agents,
and mechanisms for the coordination of independent agents' behaviors. While
there is no generally accepted definition of “agent'' in artificial intelligence, an
agent is generally considered as an entity with goals, actions, and domain
“behavior'' (Stone and Veloso 1997). The use of modelling based on MAS for
tackling natural resources and environment management issues is growing
steadily (Bousquet 1999). The study of MAS focuses on systems in which many
intelligent agents interact with each other. The agents are considered to be
autonomous entities, such as software programs or robots. Their interactions can
be either cooperative or egocentric – in other words, the agents can share a
common goal or they can pursue their own interests. (Sycara 2000).
Flores-Mendez (1999) said that agents are entities within an environment,
and that they can sense and act. This means that agents are not isolated, and
that they can communicate and collaborate with other entities. Once agents are
ready for collaboration, they need to find other appropriate agents with whom to
collaborate.
In this case, a MAS technique was chosen instead of a stock and flow
systems dynamic because the focus of this modeling is on forest stakeholders or
agents. The research was aimed at answering questions related to a future
scenario, aimed at improving the well-being of stakeholders and improving forest
sustainability. The hypothesis of the research was formulated to result in better
[image:33.612.183.468.526.687.2]outcomes in forest co-management by all relevant stakeholders.
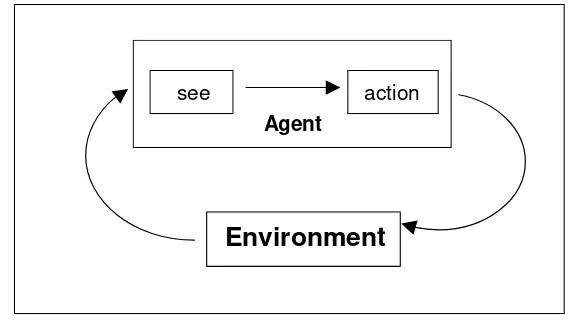
Figure 2.7. Perception and action subsystems (Weiss 1999)
see action
In order to simulate stakeholders’ activities and interactions, we need a
tool that can represent stakeholders’ individual knowledge, beliefs and
behaviours. This modelling assumes that each stakeholder or agent acts
autonomously, depending on their own perceptions of the environment, as shown
in Figure 2.7.
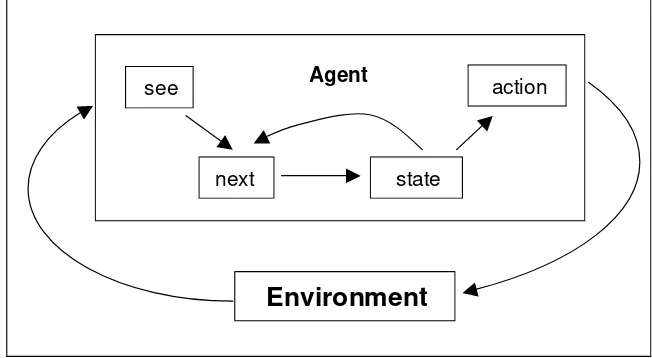
If the agent wants to take into account previous perceptions, then the
agent needs to integrate what they perceive and what is already in their mind, as
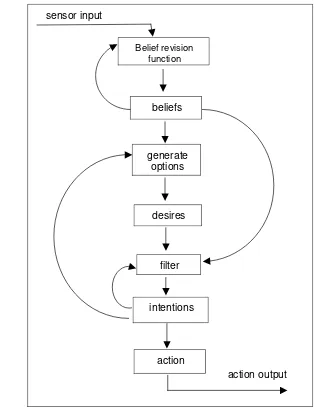
illustrated in Figure 2.8. Figure 2.9 shows a more comprehensive architecture
namely Belief-Desire-Intention (BDI). These architectures have their roots in the
philosophical tradition of understanding practical reasoning – the process of
[image:34.612.165.491.369.548.2]deciding, moment-by-moment, which action to perform in order to achieve a goal.
Figure 2.8. Agents that maintain state (Weiss, 1999) see
next state
action
Figure 2.9. Schematic diagram of a generic belief-desire-intention architecture (Weiss 1999)
The process of practical reasoning in a BDI agent was illustrated by
Weiss 1999 as involving: a set of current beliefs, representing information the
agent possesses about the current environment; a belief revision function (brf)
which takes into account a perceptual input and the agent’s current belief - and
on the basis of these, determines a new set of beliefs; an option generating
function, (options), which determines the options available to the agent (its
Belief revision function
beliefs
generate options
desires
filter
intentions
action sensor input
desires), on the basis of its current beliefs about its environment and its current
intentions; a set of current options, representing possible courses of actions
available to the agent; a filter function (filter), which represents the agent’s
deliberation process, and which determines the agent’s intentions on the basis of
its current beliefs, desires, and intentions; a set of current intentions, representing
the agent’s current focus – those states of affairs that it has committed to trying to
bring about; and an action selection function (execute), which determines an
action to perform based on current intentions.
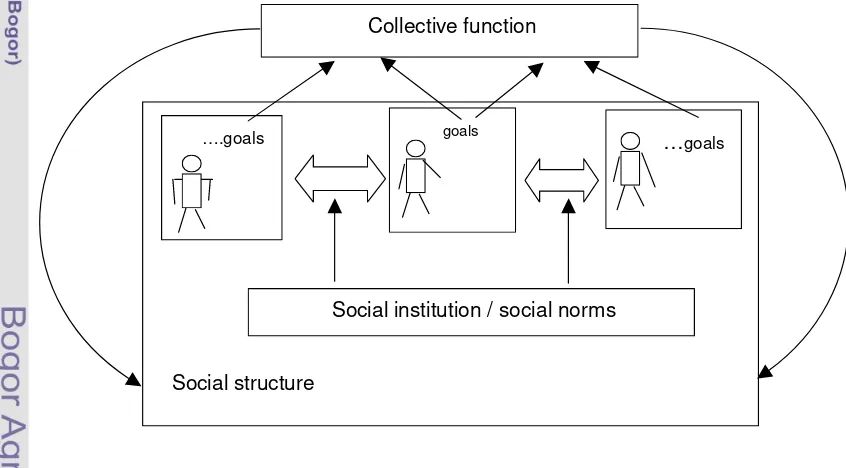
Agents always operate and exist within an environment. The environment
might be open or closed, and it might or might not contain other agents. If it
contains other agents, it can be seen as a society of agents or MAS. Ossowski
[image:36.612.104.527.394.628.2](1999) illustrated the coordination among agents as shown in Figure 2.10.
Figure 2.10. Coordination among agents (Ossowski 1999)
The communication protocols enable agents to exchange and understand
messages. A communication protocol might specify that the following messages
can be exchanged between two agents (Weiss 1999): Propose a course of
….goals goals …goals
Social institution / social norms Collective function
action; Accept a course of action; Reject a course of action; Retract a course of
action; Disagree with a proposed course of action; Counter-propose a course of
action.
Although a simulation is a useful approach to a complex system, a precise
definition of a “complex system” is neither possible nor necessary. However, it is
possible to relate types of systems to formal methods of problem solving in a very
general way. The most useful method of dealing with a given problem at a
particular time depends on our conceptualization of the problem and the current
state of knowledge about the problem within a conceptual framework - which
places us in one of the regions in Figure 2.11. Definitely, a simulation method is
useful to apply when we have little data but a high level of understanding.
[image:37.612.157.458.401.608.2]Otherwise, statistics or physics would be more appropriate.
Figure 2.11. Comparison in methods of problem solving (modified from Holling 1978, and Starfield and Bleloch 1988 in Grant et al., 1997)
Here, it is useful to distinguish models for understanding and models for
prediction (Bunnell 1989 in Vanclay 1994). Models for understanding are useful Understanding level
Data amount
high low
many
few
Statistics
Simulation Simulation
for comprehending and linking previously isolated bits of knowledge, and may
help to identify gaps where more work is needed. The benefits come from
insights gained while developing and exploring the model (Vanclay 1994).
2.5. Forest Stand Dynamic
In Indonesia, forest management and harvesting operations are regulated
under TPTI (Armitage and Kuswanda 1989). This system allows for all
commercial trees to have 50-60 cm dbh (the minimum harvest diameter depends
on the type of production forest), removed within a felling cycle of 35 years.
However, in previous times, not all trees above these diameter classes were cut
because some of them were not harvestable e.g. non-commercial trees,
protected trees (such as Dyera Costulata, Koompassia Excelsa, Eusideroxylon
Zwagery, and Shorea Pinanga), hollow trees, trees at steep slope, flute trees and
trees that are considered as seed bearers.
Diameter class projection methods (DCPM) represent the oldest class of
mathematical models developed for growth projection in tropical forests. The
basic concept of DCPM is that the forest is represented as stand table of tree
numbers classified by diameter classes. The change in the stand table is
calculated over an interval of perhaps 5-10 years using periodic increment data.
The revised table is then used as a starting point from which to repeat the
calculations. In this way, increment, mortality and in-growth observations made
from permanent sample plots over relatively short periods may be used to
estimate growth over a complete felling cycle or rotation (Alder 1995).
Vanclay (1994) categorized forest stand growth models into three
categories: whole stand models; size class models; and single tree models. He
stated that size class models provide information on the structure of the stand.
models. Stand growth models, logging and logging damage constitute stand
dynamic.
The form and extent of logging damage on forests is varied. The method
and intensity of logging will influence the degree and type of damage (Alder and
Synnott 1992). Sist et al. (in prep.) noted that logging in Inhutani II was done
under such high felling intensity (more than 9 trees per ha or about 80%), it led to
high damage to residual stands. Dead trees due for felling within residual stands
for dbh class one to five are 50% (20-30 cm), 40% (30-40 cm), 30% (40-50 cm),
20% (50-60 cm) and 10% (above 60 cm).
III. RESEARCH METHODS
3.1. Research Framework
Sustainability in relation to forest ecosystems incorporates biophysical,
economic and social aspects. The well-being of forest-dependent people
cannot be neglected if sustainability is a primary goal of forest management.
However, forest policymakers frequently think that local people do not have
sufficient knowledge on sustainability. Forest managers use this situation as a
formal reason to exclude forest-dependent people from their forest management
schemes. Many forest managers believe that they will maximize their own
benefits by not sharing forest management with others. On the other hand, many
non-government organizations (NGOs) and people’s organizations are struggling
to represent the interests of local people. This struggle, however, is often based
on idealism and romanticism.
The first hypothesis of this work - that local communities of
forest-dependent people can define sustainable forest management criteria and
indicators - indicates local community knowledge of sustainability. A comparison
of scientific and local sustainability indicators tested the first hypothesis. If this
hypothesis is accepted then rational policymakers have no reason not to include
local people in current forest management schemes. Furthermore, because local
people have been there for hundreds of years they should be made a priority in
any new forest management scheme. Even if this hypothesis is rejected, forest
policymakers still have to improve local people’s well-being and benefits they
obtain from the forest, even without automatically including them in forest
management.
The next question to ask is how to actively involve local people in forest
share forest benefits if the first hypothesis is rejected? Most production forests in
Indonesia have been allocated to forest concession companies. Right now about
375 forest concession companies are operating. The operators have legitimate
rights to manage forests. However, most of these forest managers think that the
involvement of local people in their management will decrease their profit.
The second hypothesis, involving local communities of forest-dependent
people in the current forest management scheme would achieve better
sustainability outcomes, was tested through developing a simulation model of
forest actors. Scenarios of collaboration were proposed if the first hypothesis
was accepted. Alternative scenarios of providing forest benefits to local people
were proposed. A simulation model was used because assessing the real impact
of policy options on natural forest management can take many years. Simple
indicators of sustainability agreed to by forest actors were used in the simulation
model to measure the impact of different scenarios.
Through testing these two hypotheses, it is possible to propose a way to
manage forests more sustainably. The research also proposes a way to
integrate modern C&I knowledge and local people’s C&I knowledge, and to
formulate agreed sustainability indicators among different forest actors.
3.2. Site
The field study was carried out at FMU level of Inhutani II in Malinau
District, East Kalimantan. The research took place in the year 2000 and 2001.
The site was chosen because the area has many different stakeholders with a
willingness to accept researchers and to collaborate. The availability of
biophysical and socio-economic data also supported the site selection.
The FMU is located at 116o28' East Longitude and 3o14' North Latitude.
January 1991 through Minister of Forestry decree no. 64/KPTS-II/91. Before
1991, the area was allocated to Inhutani I and co-managed with Inhutani II.
According to the Long-term Temporary Forest Utilization Work Plan
(Rencana Karya Pengusahaan Hutan Sementara) 1996, the total area is about
48,300 ha, of which 14,180 ha is comprised of limited production forest which is
pristine forest, and 34,120 ha of production forest including 23,890 ha of pristine
forest, 7,280 ha of logged-over forest, 2,920 shrubs and fallow (ladang), and 30
ha of settlements.
According to the Plan, Inhutani II will continue logging an area amounting
to 1,106 ha per year or approximately 11 blocks of 100 ha. The
silviculture system implemented is TPTI. Because Inhutani II has no industry
close to the area, the timber is sold as logs. Commercial species that dominate
the area are Shorea spp. (Meranti), Dryobalanops spp. (Kapur), Dipterocarpus
spp. (Keruing), Shorea laevis (Bangkirai), Palaquium spp. (Nyatoh), Gonistylus
spp. (Ramin) and Agathis spp. (Agathis).
3.3. Methods
The research was carried out using a combination of deductive and
inductive methods. The deductive parts took place in the process of formulating
hypotheses, formulating generic C&I and developing computer-based tools.
Inductive methods took place in formulating local communities’ C&I and testing
the hypotheses. The research was conducted in the following steps:
a. Identifying and formulating a set of generic and scientifically based C&I for
sustainable forest management based on the ideal function of forests and
existing C&I from different sources;
b. Formulating a local C&I set through field observation and related
c. Testing the first hypothesis;
d. Developing a knowledge base system (KBS) for adapting generic criteria
and indicators for sustainable forest management to meet local
conditions;
e. Developing and simulating forest stakeholders’ activities and interactions
in order to know their influence on the sustainability of the forest;
[image:43.612.117.508.375.649.2]f. Testing the second hypothesis.
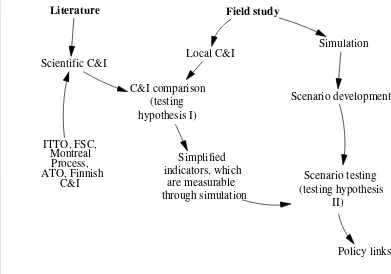
Figure 3.1. illustrates the steps involved and the links between each step.
The literature review and field study initiated these steps. The steps conclude
with a discussion of policy links related to the research.
Scientific C&I
ITTO, FSC, Montreal
Process, ATO, Finnish
C&I
Local C&I Simulation
Scenario development
Scenario testing (testing hypothesis
II) Simplified
indicators, which are measurable through simulation C&I comparison
(testing hypothesis I)
Field study Literature
Policy links
Figure 3.1. The research sequence
The relevant knowledge for SFM was derived from the ideal function of
forests in Indonesia and existing C&I from different sources including the ITTO,
FSC (Forest Stewardship Council) and ATO (African Timber Organization).
Forests, in general, possess ecological, economic and social functions. In order
to assess sustainability of forests, these functions were taken into account and
were elaborated on in a particular way so that the assessment process could be
carried out. The end of the elaboration process resulted in a set of SFM criteria
and indicators. This knowledge acted as a benchmark on which to compare local
knowledge. The knowledge, which was scientifically sound, was able to
represent future stakeholders in their absence.
Consideration of the ecological, economic and social functions of forests
was used to derive principles, criteria and indicators (P, C and I) for sustainable
forest management. A principle is a fundamental truth or law as the basis of
reasoning (Concise Oxford Dictionary 1995). A principle refers to a function of a
forest ecosystem or to a relevant aspect of the social system(s) that interact with
the ecosystem. This means that all forest functions, and relevant aspects of the
social system(s) that interact with it, are covered. A principle could be described
as an objective or attitude in relation to these functions and aspects. However,
measures and prerequisites for the realization of the goal or attitude should not
be formulated as principles - for instance, issues concerning legislation and
institutions (Bueren and Blom 1997).
Criterion is a standard, rule or test by which something can be judged
(Concise Oxford Dictionary 1995). The function of the criteria is to show the
level of compliance with principles related to the forest ecosystem or its related
social system. Compliance with the principles is translated into descriptions of
resulting specific and concrete states or dynamics of the forest ecosystem, or the
the practical results of complying with each principle, and also provide more
concrete principles which are easier to assess than the abstract non-measurable
principles. As the function of criteria is to show the level of compliance with a
principle for the forest ecosystem or related social systems, criteria should be
formulated in terms of outcome. This means that a criterion describes which state
is most desired in the forest or social system. Formulations of criteria must not
express that a desired state should be achieved nor how this state is to be
achieved. Formulations in the form of prescriptions do not comply with the
requirements for criteria in the hierarchical framework. Prescriptions should be
reserved for the formulation of guidelines and actions. The formulation of a
criterion must allow a verdict to be given on the degree of compliance within an
actual situation. (Bueren and Blom 1997).
An indicator was defined by the ITTO (1998) as a quantitative, qualitative
or descriptive attribute that, when periodically measured or monitored, indicates
the direction of change. To “indicate” is defined in the Concise Oxford Dictionary
(1995) as point out, make shown, show, or be a sign or symptom of, express the
presence of. FSC defined indicators as any variable, which can be measured in
relation to specific criteria. An indicator is an assessable parameter describing
features of the ecosystem or social system (outcome parameters), or policy and
management conditions and processes (input or process indicators). An
indicator as an outcome parameter often describes the actual condition of an
element in the forest ecosystem or related social system in quantitative or relative
terms. Indicators may also refer to a human process or intervention which is to be
executed - or to an input (e.g. the existence or characteristics of a management
plan; or a law). These types of indicators are respectively known as process and
input indicators. They are in fact indirect indicators that reflect elements of the
LEI Standard 5000-1 about a System for Sustainable Natural Production
Forest Management classifies indicators into three categories: necessary
conditions; core activities; and sufficiency requirements. Necessary conditions
are all those processes or factors that have to be fulfilled before the next process
or factor can be implemented. Core activities are all those processes or factors
that should be implemented in a management procedure. Sufficiency
requirements are possible supportive processes or factors required to achieve
management objectives.
Indicators may be identified at any point in the causal chain from human
intervention to biodiversity (Boyle et al. 1998). Brown et al. (1997) in Boyle et al.
(1998) mentioned that pressure indicators are easier to develop than state or
response indicators, but provide much less valuable information. Response
indicators, potentially the most valuable indicators, are also the hardest to
develop and apply.
The P, C and I concept forms a hierarchy (Bueren and Blom 1997) as
shown in Figure 3.2. A hierarchical framework describes hierarchical levels (P,
C, & I) to facilitate the formulation of a set of parameters in a consistent and
coherent way. It describes the function of each level as well as the common
characteristics of the parameters appearing on a particular level. The potential
value of a hierarchical framework is that it: increases the chances of complete
coverage of all the important aspects to be monitored or assessed; avoids
redundancy; limits the set of P, C & I to a minimum without superfluous
indicators; shows a clear relationship between indicators measured, and
Figure 3.2. P, C & I concept for sustainable forest management assessment
A fourth hierarchical level, below the level of these indicators, may be
needed to describe the way the indicators are measured in the field. The
parameters at this level are called verifiers. Verifiers are not shown in the
hierarchy because they are optional. They refer to the source of information for
the indicator and relate to the measurable element of the indicator. The
verification procedure clarifies the way the indicator is measured in the field and
the way reference values are established. Choosing a reference value is always
difficult when formulating target values or thresholds because it is often an
arbitrary procedure (Bueren and Blom 1997). Since this research was not aimed
at describing the operational use of developed C&I, verifiers were not
investigated.
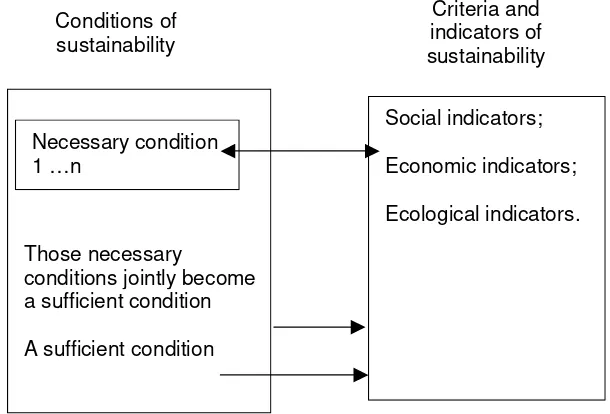
However, according to the established knowledge a network form of C&I
is more useful than the hierarchy system. An indicator, for instance, of water
quality, could not only help indicate the quality of forest harvesting, but also the
quality of human well-being, as is schematically expressed in Figure 3.3. SFM
Principles
Criteria
Figure 3.3. A network of C&I for sustainable forest management assessment
In general, sustainability indicators mean “things that point out or show
sustainability”. Conditions of sustainability are things to make those indicators
happen. Condition is defined in Webster’s’ New World Dictionary (1988) as
anything required before the performance of or completion of something else, or
anything essential to the existence or occurrence of something else. So if we talk
about sustainability, it means the conditions required before sustainability, or
anything essential to the existence or occurrence of sustainability.
Conditions are divided into two categories: necessary conditions and
sufficient conditions. Swartz (1997) defined necessary condition as follows:
A condition A is said to be necessary for a condition B, if (and only if) the
falsification (non-existence/non-occurrence) of A guarantees (or brings <