TRANSIT SYSTEM SERVICE QUALITY IN A TOURISM-EDUCATION CITY AND A BUSINESS CITY
Aleksander Purba1*, Fumihiko Nakamura2, Dwi Herianto1, I Wayan Diana1, M Jafri1, Ch Niken1
1
Department of Civil Engineering, University of Lampung, Bandar Lampung, 35145, Indonesia 2
Graduate School of Urban Innovation, Yokohama National University, 79-5 Tokiwadai, Hodogaya-ku, Yokohama, 240-8501, Japan
(Received: December 2016 / Revised: May 2017 / Accepted: November 2017)
ABSTRACT
Service quality is a key performance indicator of a system, there being many elements that constitute service quality in a transport system. The customer’s point of view is at the center of policy, planning and delivery decisions. As an education city, Jogjakarta’s customers comes from all over Indonesia, and as an international tourism destination, Jogjakarta welcomes people from all over the world. As a business city, customers in Palembang have a different character to those in Jogjakarta. The aim of this research is to identify the main aspects of transit system service quality within tourism-education city and a business city.
Keywords: Business city; Service quality; Tourism-education city; Transit system
1. INTRODUCTION
Technological development is a significant factor to the gaining of product and project competitive advantage (Berawi, 2015). Continuity of long-term strategies and development plans is required to achieve such goals (Berawi, 2016). New systems of transportation have been applied in Jogjakarta and Palembang, Indonesia as part of a long-term strategy to achieve good service quality. Service quality is a key performance indicator, with Hensher (2015), mentioning that public transport services have become increasingly sophisticated. This growing sophistication has led to greater focus on an increasing number of key performance indicators as a way of measuring service quality (Hensher, 2015). There are many different elements that come together to define transport system quality. Purba et al. (2014) mentioned that satisfaction is different for different cities. Service employees also play a role in shaping customers’ perceptions of service quality, with the interactions they perform during the service encounter influencing customer perception of the service delivered (Kennedy, 2011). Transport system customers have specific perceptions of service quality that they will typically use as performance indicators in relation to the transport system. The attitude of employees and the system of transportation both affect the interaction, with inconsistent service delivery potentially resulting in unfavourable customer experiences (Halvorsrud et al., 2016). As such, many service firms fail to deliver quality service to their customers (Kennedy, 2011).
In order to increase the level of service quality as seen from the point of view of transport system users (public transport users and non-users), service quality elements that need to be acted upon must be identified (Grujičić, 2014). Putting the customer at the center of policy,
planning, and delivery decisions requires a system for measuring customer satisfaction that is both robust and, capable of benchmarking customer satisfaction for use in informing policy and service planning (Hensher, 2015). A framework based on customer journeys for a structured portrayal of service delivery from the customer’s point of view, has also been studied (Halvorsrud et al., 2016). Eboli and Mazzula (2007) developed a structural equation model that explores the impact of the relationship between global customer satisfaction and service quality (SQ) attributes in a bus service context. The research was based on the bus services regularly used by University of Calabria students to reach their campus. In the context of this study, customers in Jogjakarta differ to those in Palembang. As an education city, Jogjakarta’s customers comes from all over Indonesia and, as the tourism destination, Jogjakarta attracts visitors from all over the world. As a business city, customers in Palembang have a different character to those in Jogjakarta. This aim of this research is to look at the differences in both types of city in relation to SQ.
Purba et al. (2014) studied the service performance of the TransJogja and TransMusi bus transit systems from the user’s point of view and concluded that the local governments of both Jogjakarta and Palembang should aim to improve the subsidy and fare aspects relating to SQ and satisfaction in order to maintain user satisfaction and loyalty. This paper, using the same data and method, explores in further detail the most important factors in determining SQ. The aim of this research is to identify the main aspects of SQ in tourism- education city and a business city.
2. EXPERIMENTAL PROGRAM
There are formidable challenges involved in the delivery and maintenance of SQ in the area of public transport. This relates to how to deal with such a complex, fuzzy, and abstract concept as SQ and whether we should use perception of performance only, or also customer expectation. Customer expectation should be considered in the form of either: ideal, desired, adequate, or tolerable quality. Additionally, consideration needs to be given to how to identify the most relevant attributes that affect SQ and how to deal with such related aspects (de Oña & de Oña, 2014).
3. RESULTS AND DISCUSSION
3.1. Descriptive Statistics
producer units in the region. GRDP includes regional estimates for the three major sectors of the economy, including their sub-sectors, namely:
Agriculture, fishery and forestry (primary)
The industrial sector, including mining and quarrying, manufacturing, construction, electricity and water (secondary)
The service sector, including transport, communication and storage, trade, finance, renting and business services and other private services (tertiary).
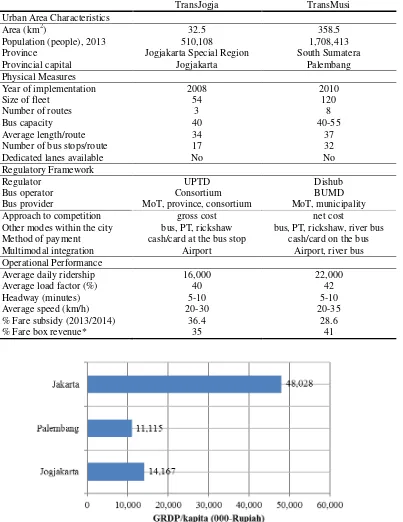
Table 1Profile of the Trans bus
TransJogja TransMusi
During the period 2011-2012, the secondary and tertiary sectors combined were the driving force of the economies of the two cities (Figure 2); in Jogjakarta the secondary and tertiary sectors accounted for 31% and 68% of the city’s economy, respectively, in Palembang the corresponding contributions for secondary and tertiary were 44% and 55%, respectively. The minimal presence of the primary sector indicates that agriculture is no longer attractive to most urban communities.
Figure 2 Formation of the two city economies, by sector
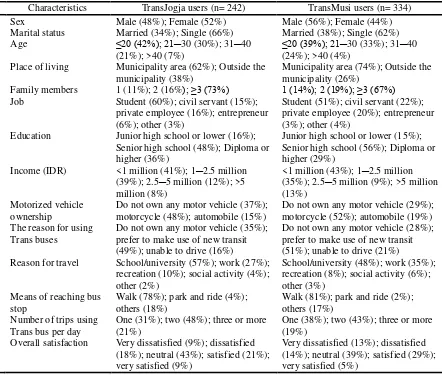
Table 2 Socio-economic characteristics of the respondents
No Characteristics TransJogja users (n= 242) TransMusi users (n= 334)
1 Sex Male (48%); Female (52%) Male (56%); Female (44%)
2 Marital status Married (34%); Single (66%) Married (38%); Single (62%)
3 Age ≤20 (42%); 21─30 (30%); 31─40
(21%); >40 (7%)
≤20 (39%); 21─30 (33%); 31─40
(24%); >40 (4%) 4 Place of living Municipality area (62%); Outside the
municipality (38%)
7 Education Junior high school or lower (16%);
Senior high school (48%); Diploma or higher (36%)
Junior high school or lower (15%); Senior high school (56%); Diploma or higher (29%)
Do not own any motor vehicle (37%); motorcycle (48%); automobile (15%)
Do not own any motor vehicle (29%); motorcycle (52%); automobile (19%) 10 The reason for using
Trans buses
Do not own any motor vehicle (35%); prefer to make use of new transit (49%); unable to drive (16%)
Do not own any motor vehicle (28%); prefer to make use of new transit (51%); unable to drive (21%) 11 Reason for travel School/university (57%); work (27%);
recreation (10%); social activity (4%);
14 Overall satisfaction Very dissatisfied (9%); dissatisfied (18%); neutral (43%); satisfied (21%); very satisfied (9%)
3.2. Socio-economic Status of Respondents
Of the 265 questionnaires returned by TransJogja users, only 242 questionnaires could be used for further analysis, while of the 370 questionnaires returned by TransMusi users, only 334 questionnaires could be used in the next stages of the model analysis. The descriptive statistics of the respondents are reported in Table 2. As shown in the table below, more than half of the Trans users in both Jogjakarta and Palembang are students. Other striking characteristics of the respondents is the age of the majority of users, i.e., under 40 years old, and their single status. The potential implication of this is that the perception of students and young users may be the dominant perception among users as a whole.
Furthermore, women accounted for the largest proportion of TransJogja users, while man are the primary users of TransMusi. The fact that almost 40 percent of TransJogja users reside outside of the municipality indicates that approaching half of travel across the region. The corresponding figure for Palembang is 26 percent. These percentages may continue to grow in line with the increasing population size of both cities. In terms of income, about 80 percent of Trans users are from lower-class households, and about 10 percent are from the wealthiest class.
3.3. Model Results
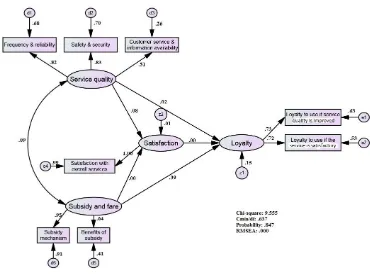
In this paper, path analysis was employed to reveal the relationship among variables. The model was calibrated using the AMOS 22 package from SmallWaters Corporation (Arbuckle & Worthke, 1999). Models of the results for TransJogja and TransMusi users are shown in Table 3 and Figures 3 and 4.
3.4. Discussion
The minimum discrepancy function values in the TransJogja and TransMusi models are 64.055 and 9.555 (Figures 3 and 4), indicating that they are statistically significant according to the chi-square test. The values for GFI, AGFI, NFI, IFI, and CFI for the TransJogja model are 0.957, 0.932, 0.963, 0.991, and 0.991, respectively, close to unity, meaning that the model is a perfect fit. Based on this result, it is clear that the TransJogja model displays a good fitness, since all the parameters obtained imply a good-fit model. On the other hand, the values for GFI, AGFI, NFI, IFI, and CFI for the TransMusi model are 0.993, 0.983, 0.985, 1.009, and 1.000, respectively. Some of the parameter fit values of the TransMusi model exceed one, implying a marginal fit model.
According to the level of significance and regression weight, safety and security (0.784/0.834), and customer service and information availability (0.764/0.514) are the two most important attributes for improving the quality of service of the TransJogja and TransMusi models, in addition to the subsidy and fare (0.881) attribute in the TransJogja model alone. In regard to subsidy and fare policy, the distribution of subsidies (0.833), and effect of subsidization (0.708) attributes are the two most likely to capture the attention of local government in the TransJogja model, while the effect of subsidization (0.641) attribute is the one with the highest priority in the TransMusi model that could lead to an increase in the effectiveness of transport subsidies.
Table 3Standardized factor loading estimates
Latent
Service quality → Satisfaction 0.247** -0.084**
Safety and security Service quality → Loyalty -0.213** 0.016** Customer service &
information availability
Service quality → Frequency and
reliability 0.652* 0.822*
Service quality → Safety and
security 0.784*** 0.834***
Service quality → Customer
service & information availability 0.764*** 0.514***
Service quality ↔ Subsidy and
fare 0.881*** -0.091**
Subsidy and fare
Affordability of fare Subsidy and fare → Satisfaction 0.651*** 0.004** Effect of subsidization Subsidy and fare → loyalty 0.930*** 0.392*** Distribution of
subsidies
Subsidy and fare → Affordability
of fare 0.734* --
Subsidy and fare → Effect of
subsidization 0.708*** 0.641***
Subsidy and fare → Distribution
of subsidies 0.833*** 0.954*
helpfulness of personnel 0.816*** --
Satisfaction→ Satisfaction with
overall services 0.832* 0.996*
Loyalty
Loyalty to use if service quality is improved
Loyalty → Loyalty to use if
service quality is improved 0.799* 0.793*
Loyalty to use if the service is satisfactory
Loyalty → Loyalty to use if the
services is satisfactory 0.695*** 0.725***
Loyalty to use if the
Figure 3Average speed and percentage share of vehicles at study sections
Figure 4Relationship among variables in the TransMusi model
and fare, in addition to the coefficient of loyalty from satisfaction being lower than that of loyalty from subsidy and fare. These results indicate that the permanent availability of transport subsidies in case study cities is the most important measure for maintaining customer satisfaction and loyalty rather than efforts to improve the quality of service and satisfaction. Since funding for urban bus subsidies comes from a public budget, bus subsidies and the political support they engender play a crucial role in supporting new urban bus services.
There are three hypotheses in the TransJogja model and one hypothesis in the TransMusi model, with all of the regression weights significant at 1 percent. Other hypotheses are less statistically significant (level of significance 5%). The first hypothesis, which positively correlates quality of service with subsidy and fare, is statistically significant, supported by the positive value (TransJogja model). This implies that the higher the quality of service, the greater the amount of subsidy required, and vice versa; the higher the subsidy level, the greater the quality of service that could be provided. This result appears to be both natural and reasonable. The second hypothesis, the positive relationship between subsidy and fare, and loyalty, is also statistically supported (TransJogja and TransMusi models). It stands to reason that the higher the subsidy, the more loyal the users are likely to be. The third hypothesis, the relationship between subsidy and fare, and satisfaction, is also statistically supported (TransJogja model). This implies that a higher subsidy will also increase the satisfaction of TransJogja users. The fourth hypothesis, the relationship between service quality and satisfaction (TransJogja model); the fifth, the relationship between service quality and loyalty (TransMusi model); and the sixth, the relationship between satisfaction and loyalty (TransJogja and TransMusi models) all have positive values but are statistically less significant. These results show that a higher quality of service provided does not directly increase user satisfaction and loyalty, while at the same time an increase in users’ satisfaction does not directly increase user loyalty; since both satisfaction and loyalty are influenced by other aspects and the results may therefore not include other potentially valuable information. The seventh hypothesis, the co-relationship between service quality and subsidy and fare (TransMusi model); the eighth, the relationship between service quality and satisfaction (TransMusi model); and the ninth, the relationship between service quality and loyalty (TransJogja model) were also confirmed, albeit with less significant negative values. Additionally, the models show that service quality influences loyalty (-0.213) more strongly than subsidy and fare (-0.091) and also satisfaction (-0.084). The last three hypotheses support the finding that Trans bus users do not perceive loyalty, subsidy and fare, and satisfaction independently.
4. CONCLUSION
Based on the findings from the models, users’ level of dependency on the Trans bus system influences their perceptions of loyalty, subsidy and fare, and satisfaction with the mode. In this study, the service quality delivered represents users’ dependence on the Trans bus. It is understandable that even with the low quality of service provided and the fact that the distribution of transport subsidies is not well-targeted, users tend to more readily perceive the available service as satisfactory and to show increased loyalty to it, so long as it is able to fulfill their transport needs.
5. REFERENCES
Arbuckle, J.L., Worthke, W., 1999. Amos 4.0 User’s Guide. SmallWater Corporation, Chicago, IL
Berawi, M.A., 2016. Forecasting the Future: Accelerating Countries Development and the World’s Sustainable Development. International Journal of Technology, Volume 7(5), pp. 729–731
de Oña, J., de Oña, R., 2014. Quality of Service in Public Transport based on Customer Satisfaction Survey: A Review and Assessment of Methodological Approaches. Transportation Science, Volume 49(3), pp. 605–622
Eboli, L., Mazzula, G., 2007. Service Quality Attributes Affecting Customer Satisfaction for Bus Transit. Journal of Public Transportation, Volume 16(3), pp. 21–28
Grujičić, D., Ivanović, I., Jović, J., Dorić, V., 2014. Customer Perception of Service Quality Transport. Journal Transport, Volume 29(3), pp.285–295
Hensher, D.A., 2015. Customer Service Quality and Benchmarking in Public Transport Contract. International Journal of Quality Innovation, Volume 1(4), pp.1–17
Kennedy, J., 2011. Current Trend in Service Quality: A Transportation Sector Review. Journal of Marketing Developments and Competitiveness, Volume 5(6), pp.104–115
Purba, A., Nakamura, F., Tanaka, S., 2014. Service Delivered on New Transit System from Users Viewpoint (Case Study: TransJogya and TransMusi-Indonesia). In: Proceeding of Symposium on City Planning, Hanoi, Vietnam, 2014, 13 pages