Chemometric quantification of peaberry coffee in blends using UV–visible
spectroscopy and partial least squares regression
Diding Suhandy, Meinilwita Yulia, and Kusumiyati
Citation: AIP Conference Proceedings2021, 060010 (2018); doi: 10.1063/1.5062774
View online: https://doi.org/10.1063/1.5062774
View Table of Contents: http://aip.scitation.org/toc/apc/2021/1
Chemometric Quantification of Peaberry Coffee in Blends
Using UV–Visible Spectroscopy and Partial Least Squares
Regression
Diding Suhandy
1,a), Meinilwita Yulia
2,b)and Kusumiyati
3,c)1Spectroscopy Research Group (SRG), Laboratory of Bioprocess and Postharvest Engineering, Department of
Agricultural Engineering, Faculty of Agriculture, The University of Lampung, Jalan Prof. Dr. Soemantri Brojonegoro No.1, Bandar Lampung, 35145, Indonesia.
2Department of Agricultural Technology, Lampung State Polytechnic, Jalan Soekarno Hatta No. 10, Rajabasa
Bandar Lampung, 35141, Indonesia.
3Laboratorium of Plant Production Technology, Department of Agronomy, Faculty of Agriculture, Padjadjaran
University, Jalan Raya Jatinangor KM 21, Bandung, Indonesia.
a)Corresponding author: [email protected] b)[email protected]
Abstract. The aim of the present study is to quantify peaberry coffee in blends using UV–visible spectroscopy and partial least squares (PLS) regression. A total of 210 ground roasted peaberry coffee in blends (pure and adulterated with degree of adulteration 0%–90%) were used as samples. After the extraction process, spectral data of 3 mL aqueous samples was acquired using a UV–visible spectrometer in the range of 190–1100 nm (Genesys 10s, Thermo Scientific, USA). The PLS regression was used to quantify the peaberry content in blends (peaberry-to-normal blends). The best PLS model was achieved using Savitzky-–Golay first derivative spectra in the interval of 190–450 nm with low root mean square error of calibration (RMSEC = 1.165430%) and high determination coefficient (R2 = 0.99). The calibration model also had high a RPD, 11.88. This analytical method is simple, easy to use, of low cost, and has excellent sensitivity.
Keywords: chemometri, peaberry coffee, regression, UV-Visible Spectroscopy.
INTRODUCTION
Coffee is an important crop that guarantees a sustainable economy to farmers in tropical regions, and Indonesia is no exception. It is produced in over 50 developing countries around the world. Several specialty coffees have a
particularly high economic value, including civet coffee (‘kopi luwak’ in the Indonesian language) and peaberry
coffee (‘kopi lanang’ in Indonesian). A peaberry is a natural mutation of the coffee bean inside the cherry. Normally
two coffee beans grow in a fruit (dicotyledonous)—flat against each other like halves of a peanut; however, on rare occasions a single bean is produced (monocotyledon). The production of peaberry coffee is very limited, with only about 7% of any given coffee crop containing peaberry beans.1 The higher price for peaberry beans arises from its
supposedly more concentrated flavor compared with normal beans. Due to the rarity and unique taste of this peaberry coffee, substitution by cheaper normal beans (not peaberry) may give rise to fraudulent substitution.1,2
The quality and authenticity of ground roasted coffee is an important issue since it has been the target of fraudulent admixtures with a variety of cheaper materials, including spent coffee grounds, coffee husks, and other roasted grains.2 In order to satisfy the quality requirements of the consumer, the authentication of specialty coffees
trade, as a result of the significant increase in the price gap between the specialty coffees and regular (non-specialty) coffees in the past few years.
For peaberry coffee, adulteration is done by adding cheaper normal (not peaberry) ground roasted coffee into authentic ground roasted peaberry coffee. This kind of adulteration is both frequent and imperceptible to the naked eye. The potential of several advanced analytical methods has been explored in the detection of adulteration and estimating the authenticity of ground roasted coffee. These include high performance liquid chromatography (HPLC),3 ultra-high performance liquid chromatography coupled with high resolution mass spectrometry
(UPLC-HRMS),4 electrophoresis-tandem mass spectrometry (CE-MS),5 nuclear magnetic resonance (NMR) spectroscopy,6,7
near-infrared spectroscopy (NIRS),8,9 UV–Vis spectroscopy,1,10-12 mid-infrared spectroscopy,13–15 Raman
spectroscopy16,17 and fluorescence spectroscopy.18 A fusion of these methods for ground roasted coffee
authentication has also been reported.19
Among these available methods, the detection of ground roasted coffee adulteration using UV–visible spectroscopy is preferable since the UV–visible instrumentation is easily obtainable by most developing countries’
laboratories to carry out the routine analysis of detecting adulterants. Previously, Suhandy and Yulia1 showed the
possibility of using UV–visible spectroscopy combined with soft independent modelling of class analogy (SIMCA) and partial least squares discriminant analysis (PLS-DA) to discriminate between pure peaberry and pure normal ground roasted coffee. However, as far as the author’s knowledge extends, there is no published quantitative study of estimating the concentration of peaberry in blends (peaberry-to-normal blends). For this reason, in this research, we demonstrate that the spectral information in the UV–visible region of ground roasted coffee can be used to quantitatively measure the peaberry-to-normal ratio in a blend. The main purpose of the work is to establish a new and simple analytical method with minimal and free-chemical sample preparation and relatively fast analysis that allows accurately determining the peaberry content in a blend.
MATERIALS AND METHODS
Coffee Samples
Peaberry and normal bean roasted coffee samples were purchased from the local market (Hasti Coffee, Lampung, Indonesia). All coffee samples were ground using a home coffee-grinder (Sayota). In this research, 210 blends of ground roasted coffee samples belonging to both peaberry and normal coffee were used (Table 1). The samples had eleven different levels of peaberry content (10%, 20%, 30%, 40%, 50%, 60%, 70%, 80%, 90%, 95%, and 100% (w/w), Table 1). The sample preparation, including the sieving and extraction procedures.1,10–12
Spectral Acquisition using UV-Visible Spectrometer
The spectrum of each coffee sample was measured immediately after the extraction procedures. The measurements were carried out with a UV–Visible spectrometer (GENESYS 10S UV–Vis, Thermo Scientific, USA) equipped with a quartz cell with optical path of 10 mm and spectral resolution of 1 nm at 27|C–29|C in the range of
190–1100 nm (full wavelength). The blank spectrum was recorded with distilled water.
Data Analysis
The samples were randomly divided into two subsets: calibration (147) and prediction (63) sets. The calibration set was used for the development of the model. The prediction set was used to estimate the performance of the model. The concentration of ground roasted peaberry coffee in blends (%, w/w) was calculated by using a PLS regression analysis. The PLS model was developed using modified spectra (using Savitzky–Golay first derivative with ordo: 2 and window: 9) in the range of 190–450 nm. The PLS calibration model was calculated using commercial multivariate analysis software (The Unscrambler® X (30 days trial version–CAMO Software, Oslo, Norway)).
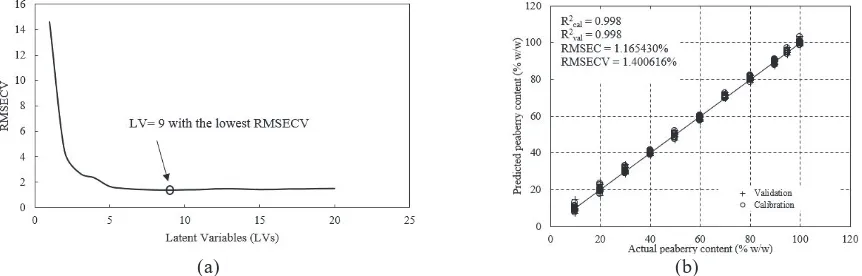
The following parameters were used to assess the quality of the PLS model: root mean square error of calibration (RMSEC) and the coefficient of determination in calibration (R2calibration). The optimum number of latent variables
The performance of PLS model was evaluated by using root mean square error of prediction (RMSEP), the coefficient of determination in prediction (R2prediction), the bias and the residual prediction deviation (RPD) of the
PLS model. A large discrepancy between the RMSECV and RMSEP values indicates an over-fitted model. For RPD, higher value is desirable and a value greater than 3 corresponds to excellent prediction accuracy.21–23
TABLE 1. Peaberry content (% w/w) in coffee samples of calibration (a) and prediction set (b).
RESULTS AND DISCUSSION
Spectral Analysis
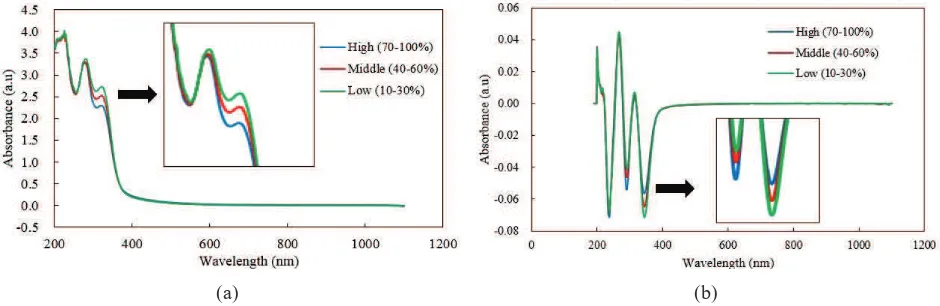
Fig. 1 shows the average spectra obtained for ground roasted coffee blends with different levels of peaberry content (low, middle and high). The spectra are similar: most of the significant wavelengths are concentrated in the range of 190–450 nm. In general, the absorbance values were higher for this range, while in the range of 450–1100 nm, the absorbance values are close to zero.
Several sharp wavelengths at 236 nm, 270 nm, 288 nm, 320 nm, and 345 nm can be clearly seen in the modified spectrum corresponding to ground roasted coffee. These wavelengths have been previously reported to be present in the spectra of ground roasted arabica and robusta coffee samples. The wavelength at 275 nm is related to the C=O chromophore absorption of caffeine,1,10–12, 24 The wavelengths at 288 nm and 320 nm are closely related to the
absorbance of chlorogenic acids and trigonelline, respectively.10–12, 24
(a) (b)
FIGURE 1. UV–Visible spectra of the average 210 coffee samples with low, middle and high peaberry content (a) original spectra, (b) modified spectra (using Savitzky-Golay first derivative with ordo: 2 and window: 9).
PCA Overview of UV
–
Visible Spectral Data
In order to see mapping of the coffee sample data set, PCA has been applied to the extracted the meaningful PCs. The results of PCA on the whole samples (210 samples) using wavelength in the range of 190-450 nm is shown in Fig. 2. The samples were divided into three different groups according to concentration of peaberry coffee in blends (%, w/w), low groups (10%–30%), middle group (40%–60%) and high group (70%–100%). There are several different strategies to select number of adequate PCs. In this research, percentages of variance in the data matrix is explained by each PC and the cumulative percentages of variance (CPV) are reported for PCA analysis.
As seen in Fig. 2 (a), the first two principal components can explain 86% of the variance in the dataset. In general, the results of the PCA showed that there was satisfactory discrimination between low, middle and high levels of peaberry content. The results of PCA showed that peaberry coffee samples (pure and adulterated) clustered into three different groups according to their concentration of peaberry (authenticity), changing along the direction of PC1. In Fig. 2 (b), we can see a plot of x-loadings versus wavelength for PC1 and PC2. This plot (Fig. 2 (b))
shows the wavelengths that had a significant contribution to the variation described by PC1 and PC2. This could be identified by their higher loading values (absolute values). Wavelengths with a higher loading indicate carrying more information about the difference of peaberry content in the coffee samples. As seen in Fig. 2 (b) there are several wavelengths which had higher loading values: 257 nm, 287 nm and 346 nm. The wavelengths 257 nm and 287 nm correspond with the absorbance of caffeine1,24 while wavelength 346 nm corresponds with the absorbance of
(a) (b)
FIGURE 2.PCA results based on absorbance spectra (190-450 nm) of ground roasted coffee aqueous samples (a) Plot PC1 vs. PC2 (b) X-loadings vs. wavelength.
Results from PLS Regression
Fig. 3 shows the best PLS calibration model based on modified or pre-processed spectra (Savitzky–Golay first derivative with ordo: 2 and window: 9). This PLS model has 9 PLS factors with the lowest RMSECV as seen in Fig. 3 (a). As shown in Fig. 3 (b), R2 was found to be 0.99 for both calibration and validation. Figure 4 shows the actual
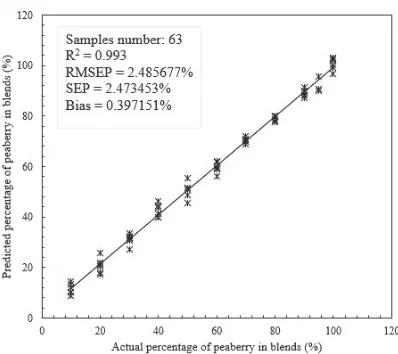
and predicted values of peaberry content in blends for the prediction set. The RMSEP was 2.485677% (w/w) and the determination coefficients were 0.99. The predicted bias was 0.397151% (w/w). The RPD of 11.88 was obtained using the best PLS model.
Our PLS model was quite superior to several previous reported studies. The determination coefficient of 0.97 and RMSECV of 4.58% (w/w) were obtained in the measurement of the arabica content in arabica-to-robusta blends.8Using this PLS model, a prediction of the robusta content in arabica-to-robusta blends was conducted and
resulted in RMSEP = 4.34% (w/w), representing errors about 1.7 times higher than our result (RMSEP of 2.485677% w/w). Another work has developed a more sensitive analytical technique using ambient ionization mass spectrometry to predict percentage of robusta ground roasted coffee in blends and obtained RMSEP of 2.54%, which is very close to our result.25 Using mid infrared spectroscopy, a quantification of robusta in blends has been reported
using several wavelength selection methods. The best PLS model was obtained for the ordered predictors selection (OPS) method: it could predict the robusta content with RMSEP of 1.89% (w/w).15
It is noteworthy to mention here that the evaluation of the authenticity for ground roasted peaberry coffee samples using the proposed UV–Visible spectroscopy coupled with PLS regression analysis took around ten minutes for sample preparation (extraction process with hot distilled water) and an additional one minute for spectral data acquisition. Thus, it is established that our simple sample preparation and chemical free protocol, encapsulating good efficiency (rapid), accuracy and validity (R2prediction> 0.99), is a prospective alternative method to assess the
authenticity of ground roasted peaberry coffee.
(a) (b)
FIGURE 4. Actual vs. predicted peaberry content (% w/w) values for prediction sample set.
SUMMARY
In this research, we showed the potentialities of UV–Visible spectroscopy coupled with chemometrics analysis for detecting authenticity of ground roasted peaberry coffee and quantifying the content of ground roasted peaberry coffee in blends (peaberry-to-normal). PCA could clearly separate between low, middle and high levels of peaberry content. The best PLS model has nine PLS factors; it had the lowest RMSECV = 1.400616% (w/w), and it attained a determination coefficient (R2) of 0.99 for both calibration and for validation. The RMSEP was 2.485677% (w/w)
and the determination coefficients were 0.99. The results show that UV–visible spectroscopy combined with the PLS regression method is a prospective alternative method to assess the authenticity of ground roasted peaberry coffee.
ACKNOWLEDGEMENTS
The authors acknowledge Hasti Coffee Lampung for providing the peaberry and normal coffee samples. The authors also would like to express their sincere appreciation to Ministry of Research, Technology and Higher Education, Republic of Indonesia (Kemenristekdikti) for financial support under Research Grant Penelitian Berbasis
Kompetensi (PBK) (Grant Number: 384/UN26.21/PN/2018).
REFERENCES
1. D. Suhandy and M. Yulia, Int. J. Food Prop.20, S331–S339 (2017).
2. N. Reis, A. S. Franca and L. S. Oliveira, LWT - Food Sci. Technol.53, 395–401 (2013).
3. E. D. Pauli, F. Barbieri, P. S. Garcia, T. B. Madeira, V. R. A. Junior, I. S. Scarminio, C. A. P. da Camara and S. L. Nixdorf, Food Res. Int.61, 112–119 (2014).
4. T. Cai, H. Ting and Z. Jin-lan, Food Chem.190, 1046–1049 (2016).
5. D. Daniel, F. S. Lopes, V. B. dos Santos and C. L. do Lago, Food Chem.243, 305–310 (2018).
6. M. V. M. Ribeiro, N. Boralle, H.R. Pezza, L. Pezza and A. T. Toci, J. Food Compos. Anal. 57, 24–30 (2017). 7. L. R. Cagliani, G. Pellegrino, G. Giugno and R. Consonni, Talanta 106, 169–173 (2013).
8. E. Bertone, A. Venturello, A. Giraudo, G. Pellegrino and F. Geobaldo, Food Control59, 683–689 (2016). 9. N. Reis, A. S. Franca and L. S. Oliveira, LWT-Food Sci. Technol.50, 715–722 (2013).
11. M. Yulia and D. Suhandy, J. Phys.: Conf. Ser. 835, 1–6 (2017). 12. D. Suhandy and M. Yulia, Int. J. Food Sci. 1-7 (2017).
13. J. Medina, D. C. Rodríguez, V. A. Arana, A. Bernal, P. Esseiva and J. Wist. Int. J. Anal. Chem. 1–8 (2017). 14. A. P. Craig, B. G. Botelho, Leandro S. Oliveira and A. S. Franca. Food Chem. 245, 1052–1061 (2018). 15. C. Assis, L. S. Oliveira and M. M. Sena. Food Anal. Methods 11, 578–588 (2018).
16. T. Wermelinger, L. D’Ambrosio, B. Klopprogge and C. Yeretzian. J. Agric. Food Chem. 59, 9074–9079 (2011).
17. R. C. E. Dias and C. Yeretzian. Int J. Exp. Spectroscopic Tech. 1, 1–5 (2016). 18. A. Dankowska, A. Domagała and W. Kowalewski, Talanta172, 215–220 (2017).
19. N. Reis, B. G. Botelho, A. S. Franca and L. S. Oliveira, Food Anal. Methods 10, 2700–2709 (2017). 20. X. Sun, W. Lin, X. Li, Q. Shen and H. Luo. Anal. Methods7, 3939–3945 (2015).
21. D. Suhandy, T. Suzuki, Y. Ogawa, N. Kondo, H. Naito, T. Ishihara, Y. Takemoto and W. Liu, Eng. in Agric. Environ. Food 5, 90–95 (2012).
22. D. Suhandy, M. Yulia, Y. Ogawa and N. Kondo, Eng. in Agric. Environ. Food 5, 152–158 (2012). 23. D. Suhandy, M. Yulia, Y. Ogawa and N. Kondo, Eng. in Agric. Environ. Food6, 111–117 (2013). 24. G. Navarra, M. Moschetti, V. Guarrasi, M. R. Mangione, V. Militello and M. Leone, J. Chem. 1–8 (2017). 25. R. Garrett, B. G. Vaz, A. M. C. Hovell, M. N. Eberlin, C. M. Rezende, J. Agric. Food Chem. 60, 4253–4258