J Trop Soils, Vol. 15, No. 2, 2010: 153-157
Spatial Variability of Soil Nutrients Content Related to Rice Yield
Tamaluddin Syam
1Received 30 November 2009 / accepted 5 May 2010
ABSTRACT
Keywords: Rice yield,soil nutrients content, spatial maps, variable rate fertilizer
Spatial Variability of Soil Nutrients Content Related to Rice Yield (T Syam): Soil nutrients content and its spatial
distribution are very important data for site specific fertilizer management to supply sufficient crop nutrition. The study was carried out at the farmer paddy field in Rejomulyo Village, Metro Town District of Lampung Province. The aim of this study was to evaluate the relationship between soil nutrients content (N, P, K) and rice yield. Soil samples were collected before fertilizers treatment by the grid sampling method and GPS was used as a tool for precisely determine sample site location. Rice yield data were collected by small plot method on the each-of soil sample location. Spatial analysis using GS + software and statistical analysis using SPSS software. The result indicated that total nitrogen in the soil had a significantly correlation with the rice yield (r = 0.95**) and their spatial distribution was relatively similar each others. Spatial maps of soil nutrients content could be used for the variable rate fertilizers treatment, especially for nitrogen.
1Soil Science Department, Faculty of Agriculture, The University of Lampung, Jl. Sumantri Brojonegoro
No. 1 Bandarlampung 35145, e-mail: [email protected] J Trop Soils, Vol. 15, No. 2, 2010: 153-157
ISSN 0852-257X
INTRODUCTION
Precision farming systems are an agricultural management technology which basically aims to generate sustainable agricultural production and it is about the farm management techniques which are based on a specific spatial variability of land characteristics including soil nutrients content, temperature regime, water, and crop requirement in the field. The purpose of precision farming system is to integrate the use of land resources characteristics and crop requirements by the agronomic practices due to variability of land characteristics for every place and time (McBratney and Pringle 1997). Furthermore, Voltz (1997) stated that appropriate farming systems required accurate information about the land characteristics in detailed and land management to implement specific land treatment. A site-specific management basis would optimize yields and inputs (Reyniers et al. 2006). A fundamental question of the farmers on precision farming concept is how to measure and properly treat the diversity of land properties for site specific management program on rationally cost (Grenzdorffer 1997). In principle,
precision farming system requires three main components namely: (a) global positioning system (GPS) to determine precisely where the position of the samples, (b) proper time mechanism for controlling nutrients, pesticides, soil moisture and other production inputs, and (c) a database that provides information is needed to develop an appropriate package of inputs for various site specific conditions (Camberdella and Karlen 1999). An integrated approach of the agricultural process starts from the planning of soil tillage, planting, use of fertilizers and pesticides, harvesting and post-harvest processes.
Soil characteristics and crop yield mapping were the main key for the success of precision farming systems. Therefore the diversity of soil nutrient mapping and the yield should be accurate as possible, because it was used as a basis for determining specific treatment in precision farming (Schuller 2001). The diversity of the nutrient content was very important in precision farming systems, to achieve the crop needs quickly and appropriately through fertilizing (Tinker 1976). Therefore, the spatial map of soil nutrients content variability became very important
.
.
in precision farming systems as a basis for granting a fertilizer based on specific site specific fertilization to improve the efficiency of fertilizer use. According to Yanai et al. (2000), Geostatistics Software was a way that can be used to analyze the spatial diversity of soil properties. Results of analysis can be used as a basis for explaining the spatial diversity of soil properties quantitatively. According to Juang et al. (2002), the spatial distribution of the fertilizer-P availability index can be estimated by using a kriging map. Jalali (2007) suggested that such classes of K could formed a basis for variable-rate application to maintain an adequate K status for crop production and to reduce potential K loss from soil by leaching. The amount of nutrient in the soil can be easily manipulated by fertilization (McBratney and Pringle 1997).
The objective of this study was to evaluate the soil nutrients content and its spatial distribution of N, P and K related to rice yield. The goal of this study is to supply plant nutrients precisely by variable rate fertilizer in accordance with the availability of nutrient content in the soil.
MATERIALS AND METHODS Study Site
The study was carried out on October 2005 at the farmer paddy fields in the Rejomulyo Village, Metro City District, with the geographical position of 9429145 to 9429370 m north and 534438 to 534615 m east.
Soil Sampling
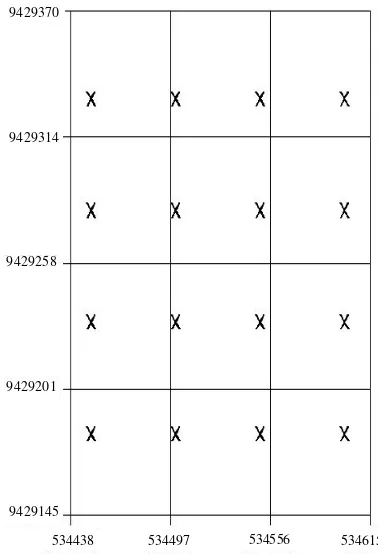
The study was done using survey method. Sixteen soil samples were collected before tillage on the top soil by the systematic sampling with the distance of 50 m by 50 m and 0 to 20 cm depth. Distribution of sample sites were shown in Figure 1. To determine the precisely geographic position of each sample site, Global Positioning System (GPS) was used.
Soil and Plant Analysis
All of soil samples collected were air dried, crushed to pass the 2 mm sieve for analysis of total nitrogen (N) by Kjeldahl Methods, available of phosphorus (P) by Bray I, and exchangeable potassium (K-dd) by NH4OAc. Soil analysis carried out in the Soil Science Laboratory Department of Soil
Science, Faculty of Agriculture, the University of Lampung.
Rice yield data were collected at the every point where the soil sample sites by small plot with the size of 5 m by 5 m. The grain yield was weighed based on the dry weigh of the water content field.
Data Analysis
Semivariance analysis and spatial variability map of soil nutrient content and rice yield were conducted using Geostatistics plus software (GS +). and the
relationships between nutrients content in the soil and the rice yield were analyzed by classical statistical analysis.
RESULTS AND DISCUSSION
Statistical Analysis
Descriptive statistical analysis nutrient content of N, P and K in the soil were listed in Table 1. The results of statistical analysis showed that total N content varied in the range of 0.11 to 0.16%, while available P was in the range of 2.48 to 18.12 ppm and exchangeable K were 58.65 to 164.22 ppm. Available P content in the soil was the highest coefficient of
9429370
9429314
9429258
9429201
9429145 534438
534615
534556 534497
variability, and then followed by Exchangeable K and total N, respectively.
Based on the existing CV value, available P can be classified into a high diversity class, while the exchangeable K and total N was classified as low. The low diversity of total N in the soil was most likely caused by nutrient characteristics of total N itself which was mobile in the soil (Brady, 1990; Havlin, 1999). Similar results were done by Syam et al. (2004) which stated that the coefficient of nutrient variability in oil palm plantation were classified in the highest category for available P, then followed by the exchangeable K and total N.
A correlation test analysis between nutrient content in the soil and rice yield showed that total N was a very high correlation (r = 0.95 **), and then followed by exchangeable K which was categorized as a high correlation (r = 0.56 *), whereas for available P was no significant correlation (r = 0.015). The similar study which was conducted in the Hanau Brak Village, South Lampung District showed similar results which was total N content in the soil had a very high significant correlation (r = 0.96 **) with the rice yield (Syam 2005).
Semivariance Analysis
The semivariance analysis of soil nutrients content were characterized by a semivariogram.
Description
Total N (%)
Available P (ppm)
Exch. K (ppm)
Minimum 0.11 2 .48 58 .65
Maximum 0.16 18.12 164 .22
Average 0.13 11.18 89 .07
CV (%) 14.41 44.28 29 .87
Table 1. The statistical analysis of nutrient content in soil.
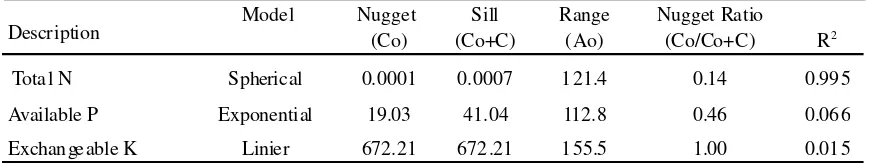
Description Model Nugget (Co) (Co+C) Sill Range (Ao) Nugget Ratio (Co/Co+C) R 2
Total N Spherical 0.0001 0.0007 1 21.4 0.14 0.99 5
Available P Exponential 19.03 41.04 112.8 0.46 0.06 6
Exchan geable K Linier 672.21 672 .21 1 55.5 1.00 0.01 5
Table 2. The semivariogram parameters analysis of nutrient content in soil.
Description and values of the semivariogram parameters were shown in Table 2.
The best fit model for total N, available P, and exchangeable K in the soil were spherical, exponential, and linier, respectively. The nugget values (Co) was low for total N indicating the small error of the estimation processes. The sources of errors in estimation process might be due to many factors such as sampling intensity, positioning chemical analysis, data recording and soil properties. The results of nugget ratio showed that total N could be classified into strongly spatial dependence, whereas for available P classified into moderately spatial dependence, and then for exchangeable K in the soil was classified into weakly spatial dependence. This result demonstrated that in the future sampling maximum distance of total N, available P, and exchangeable K in the soil were 121.4 m, 112.8, and 155.5 m, respectively. Otherwise, any pair of nutrient values by the lag distance was greater than that range would be spatially independent.
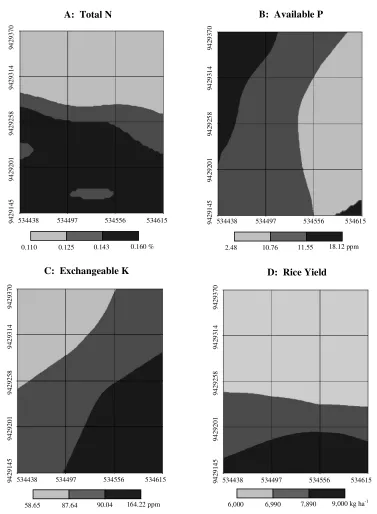
Kriged Maps
The spatial analysis results by kriged map of soil nutrients content and distribution of total N, available P and exchangeable K, and rice yield were shown in Figure 2. Based on the appearance in Figure 1, spatial distribution patterns of rice yield (Figure 2D) were relatively similar to the distribution patterns of nutrient content of total N in the soil (Figure 2A), and it has a close relationship each other. This result was similar to the last study by Syam (2005) which stated that the nutrient content of total N in the soil had a high relationship with the rice yield which was indicated by the kriged map spatial distribution patterns is similar to each other.
A: Total N that the level of yield was not only determined by the soil nutrient content alone, but also it was influenced by the other environmental factors. Therefore, the spatial map of soil nutrients content and spatial distribution of nutrients in the soil was one of the most important factor for the implementation of precision farming.
CONCLUSIONS
It was concluded that the nutrient content of total N in the soil was closely related to the rice yield. The increasing of total N content in the soil was followed by increasing of rice yield. So that, spatial maps of soil nutrients content variability can be used as a basis for variable rate fertilizers management to supply plant nutrients sufficiently.
ACKNOWLEDGMENTS
The author would like to thank to Achmad Hidayat Buys and FX. Meindra Sulistya for their helping in conducting this study. Thank also goes to Mr. Basir (Alm) and Mr. Sugito as the field farmers’ owner which had allowed their land for study and other supporting information about the history of land.
REFERENCES
Brady NC. 1990. The Nature and Properties of Soils. Tenth edition. Macmillan Publishing Company, New York. 621 p.
Cambardella CA and DL Karlen. 1999. Spatial analysis of soil fertility parameters. Precision Agric J 1: 5-14. Grenzdorffer, G. 1997. Remote sensing and GIS for a
site-specific farm management system. In: JV Stafford (ed). Precision Agriculture ‘97. Vol. II Bioss Scientific Publ. Ltd., Oxford, United Kingdom, pp. 678-696.
Havlin JL, JD Beaton, SL Tisdale and WL Nelson. 1999. Soil Fertility and Fertilizers: An Introduction to Nutrient Management. Sixth edition. Prentice Hall, Upper Saddle River, New Jersey. 499 p.
Jalali M. 2007. Site-specific potassium application based on the fertilizer potassium availability index of soil. Precision Agric J 8:199-211.
Juang KW, DC Liou and DY Lee. 2002. Site-specific phosphorous application based on the Kriging fertilizer-phosphorous availability index of soils. J Environ Qual 31: 1248-1255.
McBratney AB and MJ Pringle. 1997. Spatial variability in soil-implication for precision agriculture. In: JV
Stafford (ed) Precision Agriculture ‘97. Vol. I Bioss Scientific Publ. Ltd., Oxford, United Kingdom, pp.3-31.
Reyn ier s M, K Maer tens, E Vr in dts an d J De Baerdemaeker. 2006. Yield variability related to landscape properties of a loamy soil in Central Belgium. Soil Till Res 88: 262-273.
Schuller JK. 2001. Variable rate technologies. Paper Smart Farming II Workshop on Automation for Agriculture. March 2001, Putra Jaya, Malaysia. Syam T, K Jusoff, AR Anuar, MH Tajudin dan ZZ Zakaria.
2004. Spatial analysis of soil nutrient content of N, P and K on the oil palm plantation in semenanjung Malaysia. J Trop Soil 8 (2): 137-143.
Syam T. 2005. Precision farming on paddy fields: Correlation between soil nutrients content and rice yields. Proc. of seminar and annual meeting of Dean Faculty of Agriculture Association of West Part Government University. The topic of national seminar is “Applied Sustainable Agriculture and the Future Threat”. September 14-16, 2005. Andalas University, Padang.
Tinker PB. 1976. Soil requirements of the oil palm. In: RHV Corley, JJ Hardon and BJ Wood (eds). Oil Palm Research. Elsevier Scien tific Publishing Co. Amsterdam, pp 165-181.
Voltz M. 1997. Spatial variability of soil moisture regimes at different scales: Implication in the context of precision agriculture. Chapter included in “Precision agriculture: Spatial and temporal variability of environmental quality”, John Wiley & Sons Ltd, pp.18-37.